
林业科学 ›› 2023, Vol. 59 ›› Issue (12): 37-50.doi: 10.11707/j.1001-7488.LYKX20230039
郭泽鑫1,胡中岳2,曹聪1,刘萍1,*
收稿日期:2023-02-01
接受日期:2023-10-24
出版日期:2023-12-25
发布日期:2024-01-08
通讯作者:
刘萍
基金资助:Zexin Guo1,Zhongyue Hu2,Cong Cao1,Ping Liu1,*
Received:2023-02-01
Accepted:2023-10-24
Online:2023-12-25
Published:2024-01-08
Contact:
Ping Liu
摘要:
目的: 构建广东省主要森林类型林分生物量和碳储量模型,为省内储量数据的本底摸查、省级与县市级储量数据的有效衔接提供模型支撑;分析树种结构和气候条件对模型的影响和作用机制,为更精细的碳汇监测及森林质量提升提供理论指导。方法: 以广东省12种主要森林类型为研究对象,基于2007、2012和2017年3期森林资源连续清查数据,采用非线性误差变量联立方程组构建各森林类型与蓄积量兼容的地上和地下生物量、地上和地下碳储量模型。以哑变量形式区分树种结构,以再参数化方法建立气候敏感的林分生物量和碳储量模型,评价模型拟合结果,分析气候变量对林分生物量和碳储量的影响。结果: 研究得到各森林类型的蓄积量、地上和地下生物量模型以及地上和地下林分平均含碳系数。1) 基于胸高断面积和平均树高的基础模型调整决定系数(
中图分类号:
郭泽鑫,胡中岳,曹聪,刘萍. 广东主要森林类型林分生物量和碳储量模型研建[J]. 林业科学, 2023, 59(12): 37-50.
Zexin Guo,Zhongyue Hu,Cong Cao,Ping Liu. Stand-Level Models of Biomass and Carbon Stock for Major Forest Types in Guangdong[J]. Scientia Silvae Sinicae, 2023, 59(12): 37-50.
表1
建模样地林分特征统计量"
| 森林类型 Forest type | 样地数 Sample plot number | 统计量 Statistics | 林分密度 Stand density (trees?hm?2) | 平均胸径 Mean DBH/ cm | 平均 树高 Mean tree height/ m | 胸高断 面积 Basal area/ (m2?hm?2) | 蓄积量 Volume/ (m3?hm?2) | 地上生物量 Above-ground biomass/ (t?hm?2) | 地下生物量 Below-ground biomass/ (t?hm?2) |
| 马尾松林 Pinus massoniana forest | 352 | 最小值Min. | 30 | 5.1 | 2.6 | 0.06 | 0.10 | 0.15 | 0.02 |
| 最大值Max. | 2 864 | 27.9 | 16.7 | 33.56 | 197.63 | 152.81 | 34.31 | ||
| 均值Mean | 694 | 13.3 | 8.6 | 8.96 | 45.35 | 36.20 | 7.07 | ||
| 湿地松林 Pinus elliottii forest | 148 | 最小值Min. | 105 | 5.7 | 2.0 | 0.27 | 0.58 | 0.62 | 0.22 |
| 最大值Max. | 2 039 | 24.1 | 16.2 | 26.23 | 137.65 | 101.34 | 28.22 | ||
| 均值Mean | 799 | 12.9 | 9.0 | 9.23 | 42.49 | 32.42 | 9.17 | ||
| 杉木林 Cunninghamia lanceolata forest | 318 | 最小值Min. | 15 | 5.4 | 2.0 | 0.04 | 0.10 | 0.08 | 0.02 |
| 最大值Max. | 5 172 | 18.1 | 18.5 | 42.65 | 228.61 | 139.77 | 33.65 | ||
| 均值Mean | 1 351 | 10.7 | 8.3 | 12.19 | 60.26 | 35.05 | 7.95 | ||
| 桉树林 Eucalyptus spp. forest | 655 | 最小值Min. | 15 | 5.2 | 2.5 | 0.05 | 0.22 | 0.17 | 0.02 |
| 最大值Max. | 3 928 | 22.0 | 20.8 | 38.26 | 207.32 | 220.14 | 32.88 | ||
| 均值Mean | 1 001 | 9.6 | 10.8 | 7.36 | 37.05 | 30.75 | 4.27 | ||
| 栎树林 Quercus spp. forest | 65 | 最小值Min. | 90 | 6.0 | 2.5 | 0.25 | 0.94 | 1.19 | 0.40 |
| 最大值Max. | 3 298 | 25.3 | 20.3 | 44.51 | 316.45 | 348.35 | 76.28 | ||
| 均值Mean | 1 195 | 12.4 | 9.5 | 13.49 | 78.67 | 83.81 | 21.41 | ||
| 木荷林 Schima superba forest | 58 | 最小值Min. | 45 | 5.4 | 3.3 | 0.10 | 0.36 | 0.32 | 0.10 |
| 最大值Max. | 3 043 | 20.1 | 15.1 | 29.71 | 159.01 | 143.33 | 36.78 | ||
| 均值Mean | 926 | 10.6 | 8.5 | 9.16 | 49.89 | 41.44 | 11.91 | ||
| 相思林 Acacia spp. forest | 43 | 最小值Min. | 45 | 6.5 | 2.8 | 0.31 | 1.57 | 1.05 | 0.18 |
| 最大值Max. | 3 358 | 24.2 | 18.5 | 27.62 | 194.63 | 156.57 | 54.76 | ||
| 均值Mean | 869 | 12.8 | 10.0 | 10.54 | 60.69 | 54.45 | 13.38 | ||
| 其他软阔林 Other soft broadleaved forest | 125 | 最小值Min. | 75 | 6.2 | 2.5 | 0.30 | 1.23 | 0.65 | 0.17 |
| 最大值Max. | 2 354 | 24.7 | 16.0 | 32.98 | 242.22 | 222.72 | 56.93 | ||
| 均值Mean | 894 | 10.7 | 8.3 | 8.67 | 48.38 | 39.19 | 10.08 | ||
| 其他硬阔林 Other hard broadleaved forest | 216 | 最小值Min. | 30 | 5.2 | 2.4 | 0.13 | 0.43 | 0.31 | 0.07 |
| 最大值Max. | 3 373 | 20.9 | 17.0 | 38.67 | 262.38 | 265.58 | 57.06 | ||
| 均值Mean | 1 175 | 11.3 | 8.7 | 12.44 | 70.27 | 65.04 | 14.37 | ||
| 针叶混交林 Coniferous mixed forest | 159 | 最小值Min. | 105 | 6.6 | 4.5 | 0.59 | 1.92 | 1.67 | 0.38 |
| 最大值Max. | 3 433 | 23.6 | 14.7 | 35.32 | 187.72 | 131.02 | 28.83 | ||
| 均值Mean | 1 007 | 12.7 | 9.2 | 11.59 | 59.44 | 42.21 | 9.56 | ||
| 阔叶混交林 Broadleaved mixed forest | 599 | 最小值Min. | 90 | 5.8 | 2.5 | 0.31 | 1.24 | 0.46 | 0.13 |
| 最大值Max. | 3 613 | 29.1 | 19.2 | 51.93 | 393.93 | 334.83 | 77.77 | ||
| 均值Mean | 1 173 | 11.4 | 9.4 | 13.09 | 74.54 | 68.31 | 17.17 | ||
| 针阔混交林 Coniferous and broadleaved mixed forest | 302 | 最小值Min. | 90 | 6.3 | 3.0 | 0.35 | 1.12 | 0.97 | 0.19 |
| 最大值Max. | 3 343 | 21.3 | 18.3 | 39.20 | 230.60 | 191.07 | 46.99 | ||
| 均值Mean | 1 048 | 11.6 | 9.2 | 11.69 | 62.79 | 49.77 | 11.74 |
表2
模型系统M-1拟合与评价结果①"
| 森林类型 Forest type | 模型Model | 含碳系数 Carbon content coefficient | 评价指标Evaluation index | |||||
| SEE | TRE(%) | MSE(%) | MPE(%) | MPSE(%) | ||||
| 马尾松林 Pinus massoniana forest | 0.974 | 6.69 | 1.16 | ?1.46 | 1.55 | 11.79 | ||
| 0.541 61 | 0.983 | 4.18 | 1.13 | ?1.37 | 1.21 | 7.71 | ||
| 0.534 40 | 0.959 | 1.34 | 1.54 | ?2.48 | 1.99 | 13.39 | ||
| 0.985 | 2.17 | 1.02 | ?1.29 | 1.16 | 7.46 | |||
| 0.961 | 0.70 | 1.44 | ?2.45 | 1.95 | 13.31 | |||
| 湿地松林 Pinus elliottii forest | 0.980 | 4.03 | 0.38 | ?0.01 | 1.54 | 7.91 | ||
| 0.562 56 | 0.987 | 2.36 | 0.48 | 0.02 | 1.18 | 5.39 | ||
| 0.550 83 | 0.992 | 0.52 | ?0.03 | 0.17 | 0.92 | 4.13 | ||
| 杉木林 Cunninghamia lanceolata forest | 0.975 | 7.75 | 0.00 | 0.03 | 1.42 | 9.41 | ||
| 0.552 28 | 0.972 | 4.65 | 0.26 | 0.02 | 1.47 | 7.88 | ||
| 0.540 47 | 0.962 | 1.23 | 0.09 | 0.02 | 1.70 | 9.56 | ||
| 桉树林 Eucalyptus spp. forest | 0.997 | 1.45 | 0.16 | 0.05 | 0.30 | 3.30 | ||
| 0.540 41 | 0.974 | 4.07 | 0.85 | 0.03 | 1.02 | 7.29 | ||
| 0.533 31 | 0.947 | 0.83 | 1.10 | ?0.10 | 1.50 | 9.85 | ||
| 栎树林 Quercus spp. forest | 0.977 | 10.53 | 1.03 | 0.30 | 3.32 | 10.28 | ||
| 0.488 10 | 0.973 | 12.19 | 1.16 | 0.55 | 3.61 | 8.57 | ||
| 0.472 98 | 0.993 | 1.35 | 0.58 | 0.08 | 1.56 | 4.26 | ||
| 木荷林 Schima superba forest | 0.987 | 5.47 | ?0.19 | ?0.20 | 2.89 | 7.17 | ||
| 0.551 34 | 0.993 | 3.18 | 0.15 | ?0.03 | 2.02 | 4.68 | ||
| 0.545 31 | 0.989 | 1.16 | ?0.09 | ?0.25 | 2.56 | 5.90 | ||
| 相思林 Acacia spp. forest | 0.984 | 6.66 | 1.47 | ?1.21 | 3.38 | 7.35 | ||
| 0.534 31 | 0.984 | 5.95 | ?0.91 | 1.90 | 3.37 | 9.70 | ||
| 0.525 38 | 0.993 | 1.15 | 0.51 | ?0.40 | 2.65 | 3.84 | ||
| 其他软阔林 Other soft broadleaved forest | 0.980 | 6.76 | 0.97 | 0.09 | 2.47 | 7.13 | ||
| 0.521 96 | 0.997 | 2.20 | ?0.18 | ?0.30 | 0.99 | 3.43 | ||
| 0.511 15 | 0.996 | 0.62 | ?0.07 | ?0.36 | 1.10 | 3.72 | ||
| 其他硬阔林 Other hard broadleaved forest | 0.978 | 8.22 | 1.06 | ?0.36 | 1.57 | 7.48 | ||
| 0.523 44 | 0.995 | 3.66 | 0.18 | ?0.06 | 0.75 | 3.44 | ||
| 0.514 35 | 0.994 | 0.85 | 0.12 | ?0.21 | 0.80 | 4.06 | ||
| 针叶混交林 Coniferous mixed forest | 0.978 | 5.98 | 0.09 | ?0.16 | 1.58 | 8.12 | ||
| 0.546 61 | 0.977 | 4.30 | 0.15 | ?0.15 | 1.60 | 7.20 | ||
| 0.537 85 | 0.952 | 1.45 | ?0.07 | 0.18 | 2.38 | 10.88 | ||
| 阔叶混交林 Broadleaved mixed forest | 0.978 | 9.01 | 0.42 | 0.03 | 0.97 | 6.96 | ||
| 0.520 14 | 0.977 | 8.77 | 0.65 | ?0.20 | 1.03 | 8.13 | ||
| 0.504 87 | 0.973 | 2.32 | 0.66 | ?0.35 | 1.08 | 11.77 | ||
| 针阔混交林 Coniferous and broadleaved mixed forest | 0.980 | 6.97 | 0.27 | ?0.02 | 1.26 | 7.34 | ||
| 0.535 74 | 0.967 | 7.02 | 0.21 | ?0.32 | 1.60 | 9.16 | ||
| 0.525 19 | 0.961 | 1.87 | 0.47 | ?0.11 | 1.81 | 12.52 | ||
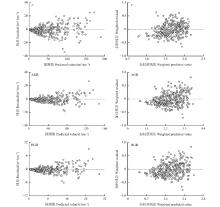
图1
马尾松林M-1模型未加权(左)和加权(右)回归残差分布"
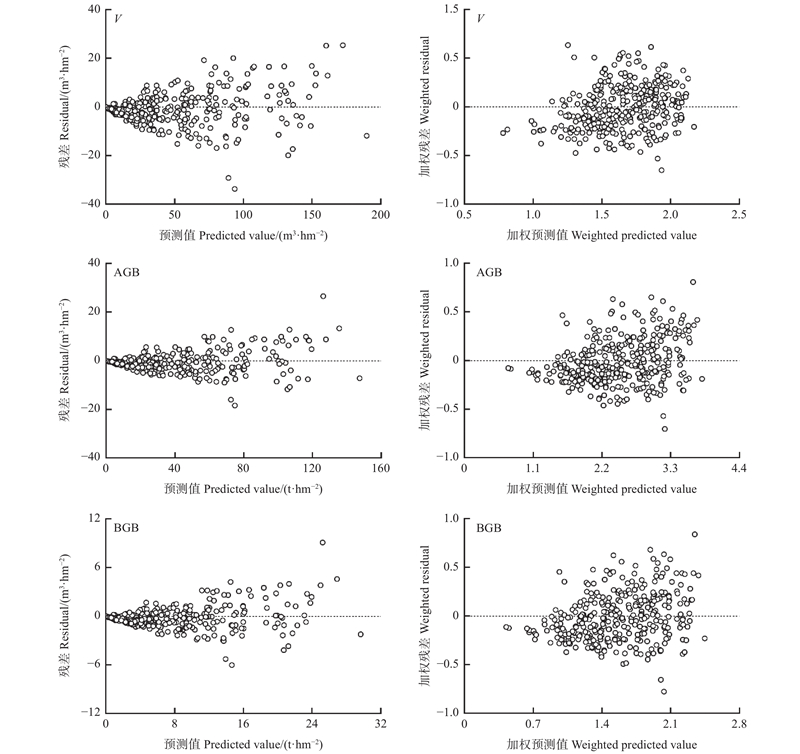
表3
模型系统M-2和M-3拟合与评价结果"
| 森林类型Forest type | 模型系统M-2 Model system M-2 | 含碳系数Carbon content coefficient | 评价指标Evaluation index | 模型系统M-3 Model system M-3 | 含碳系数Carbon content coefficient | 评价指标Evaluation index | |||
| SEE | SEE | ||||||||
| 马尾松林 Pinus massoniana forest | 0.968 | 7.51 | 0.900 | 13.18 | |||||
| 0.541 59 | 0.979 | 4.70 | 0.541 63 | 0.900 | 10.25 | ||||
| 0.534 32 | 0.950 | 1.49 | 0.534 35 | 0.899 | 2.11 | ||||
| 湿地松林 Pinus elliottii forest | 0.954 | 6.13 | 0.935 | 7.28 | |||||
| 0.562 34 | 0.967 | 3.83 | 0.562 46 | 0.940 | 5.19 | ||||
| 0.550 75 | 0.985 | 0.70 | 0.550 84 | 0.937 | 1.46 | ||||
| 杉木林Cunninghamia lanceolata forest | 0.961 | 9.70 | 0.954 | 10.55 | |||||
| 0.552 17 | 0.957 | 5.72 | 0.552 28 | 0.953 | 5.97 | ||||
| 0.540 41 | 0.945 | 1.48 | 0.540 57 | 0.947 | 1.45 | ||||
| 桉树林 Eucalyptus spp. forest | 0.996 | 1.72 | 0.962 | 5.43 | |||||
| 0.540 40 | 0.971 | 4.32 | 0.540 47 | 0.969 | 4.47 | ||||
| 0.533 31 | 0.944 | 0.86 | 0.533 42 | 0.959 | 0.73 | ||||
| 栎树林 Quercus spp. forest | 0.975 | 10.98 | 0.931 | 18.30 | |||||
| 0.488 12 | 0.972 | 12.29 | 0.487 97 | 0.919 | 21.10 | ||||
| 0.472 94 | 0.994 | 1.30 | 0.472 83 | 0.929 | 4.46 | ||||
| 木荷林 Schima superba forest | 0.983 | 6.15 | 0.971 | 8.04 | |||||
| 0.551 20 | 0.993 | 3.40 | 0.551 20 | 0.962 | 7.68 | ||||
| 0.545 18 | 0.986 | 1.30 | 0.545 27 | 0.977 | 1.67 | ||||
| 相思林 Acacia spp. forest | 0.969 | 9.27 | 0.875 | 18.55 | |||||
| 0.534 38 | 0.981 | 6.39 | 0.534 30 | 0.862 | 17.21 | ||||
| 0.525 03 | 0.876 | 4.91 | 0.525 47 | 0.775 | 6.63 | ||||
| 其他软阔林 Other soft broadleaved forest | 0.977 | 7.20 | 0.933 | 12.29 | |||||
| 0.521 96 | 0.950 | 8.95 | 0.521 90 | 0.914 | 11.75 | ||||
| 0.511 13 | 0.951 | 2.29 | 0.511 06 | 0.913 | 3.03 | ||||
| 其他硬阔林 Other hard broadleaved forest | 0.977 | 8.46 | 0.963 | 10.64 | |||||
| 0.523 42 | 0.920 | 14.98 | 0.523 43 | 0.923 | 14.67 | ||||
| 0.514 32 | 0.922 | 3.21 | 0.514 34 | 0.926 | 3.13 | ||||
| 针叶混交林 Coniferous mixed forest | 0.970 | 7.07 | 0.863 | 15.03 | |||||
| 0.546 59 | 0.973 | 4.66 | 0.546 45 | 0.875 | 10.02 | ||||
| 0.537 83 | 0.947 | 1.53 | 0.537 66 | 0.857 | 2.51 | ||||
| 阔叶混交林 Broadleaved mixed forest | 0.976 | 9.39 | 0.964 | 11.57 | |||||
| 0.520 17 | 0.956 | 12.20 | 0.520 32 | 0.938 | 14.47 | ||||
| 0.504 92 | 0.955 | 3.03 | 0.505 12 | 0.935 | 3.62 | ||||
| 针阔混交林 Coniferous and broadleaved mixed forest | 0.976 | 7.58 | 0.976 | 7.58 | |||||
| 0.535 76 | 0.951 | 8.56 | 0.535 76 | 0.951 | 8.56 | ||||
| 0.525 29 | 0.942 | 2.28 | 0.525 29 | 0.942 | 2.28 | ||||
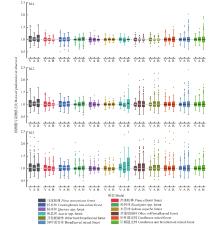
图2
基础模型预测值与观测值之比的分布 V表示蓄积量模型,A表示地上生物量模型,B表示地下生物量模型;箱体中横线表示中位数,正方形表示平均值。"
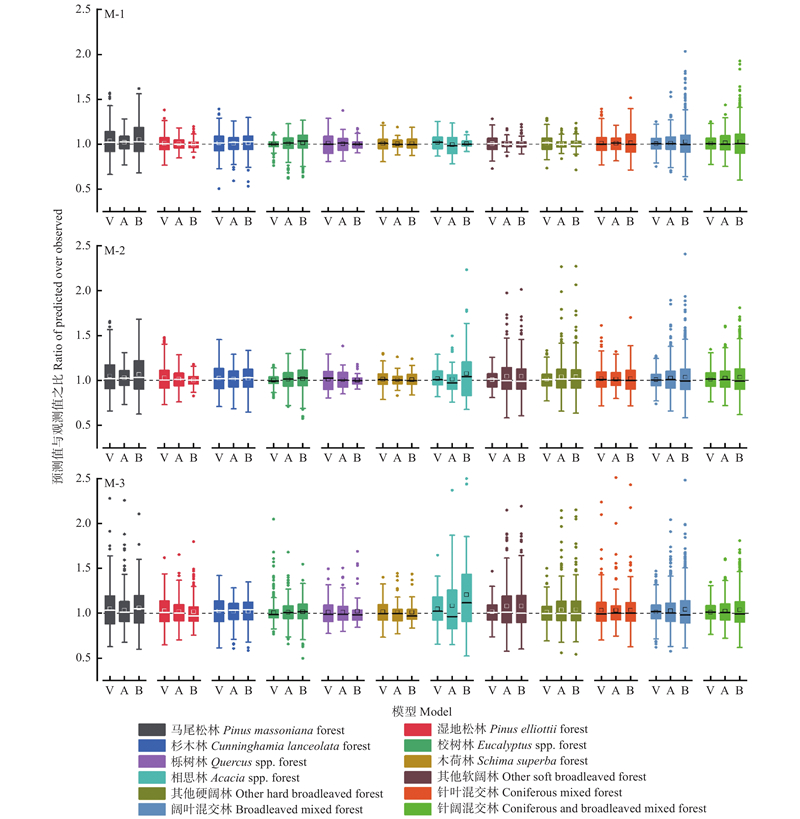
表4
模型系统M-4拟合与评价结果①"
| 森林类型 Forest type | 目标变量Target variable | 参数估计值Parameter estimate | 含碳系数 Carbon content coefficient | 评价指标Evaluation index | P | |||||||||
| 纯林Pure forest | 相对纯林Relative pure forest | SEE | ||||||||||||
| 马尾松林 Pinus massoniana forest | 2.355 50 | 0.125 92 | 1.041 01 | 0.021 28 | 0.283 02 | ?0.046 94 | 0.974 | 6.77 | — | |||||
| 2.457 46 | 0.196 97 | 1.035 32 | ?0.008 63 | 0.173 72 | ?0.024 60 | 0.542 16 | 0.541 00 | 0.984 | 4.16 | 0.091 | ||||
| 0.402 16 | ?0.031 11 | 1.038 99 | 0.010 25 | 0.257 28 | ?0.003 05 | 0.535 33 | 0.533 40 | 0.960 | 1.32 | 0.005* | ||||
| 湿地松林 Pinus elliottii forest | 2.188 36 | ?0.613 06 | 1.023 99 | 0.011 81 | 0.310 15 | 0.117 40 | 0.981 | 3.91 | 0.009* | |||||
| 1.951 00 | ?0.153 48 | 1.011 90 | 0.004 35 | 0.254 37 | 0.013 01 | 0.565 52 | 0.559 50 | 0.988 | 2.36 | 0.355 | ||||
| 0.601 68 | 0.067 14 | 1.020 11 | ?0.008 54 | 0.192 13 | ?0.022 43 | 0.552 63 | 0.548 85 | 0.993 | 0.50 | 0.004* | ||||
| 杉木林Cunninghamia lanceolata forest | 2.531 49 | ?0.682 42 | 1.047 68 | ?0.029 81 | 0.247 17 | 0.174 87 | 0.974 | 7.88 | — | |||||
| 1.790 15 | ?0.246 12 | 1.021 97 | ?0.015 35 | 0.213 72 | 0.036 27 | 0.555 73 | 0.548 59 | 0.981 | 3.78 | 0.000* | ||||
| 0.387 65 | ?0.059 78 | 1.015 85 | ?0.008 07 | 0.246 51 | 0.029 38 | 0.544 09 | 0.536 67 | 0.973 | 1.03 | 0.000* | ||||
| 桉树林 Eucalyptus spp. forest | 3.657 76 | ?0.128 52 | 1.017 84 | ?0.001 32 | 0.113 77 | 0.013 70 | 0.997 | 1.43 | 0.000* | |||||
| 2.170 30 | ?0.125 85 | 1.042 68 | ?0.021 42 | 0.255 96 | 0.002 86 | 0.540 68 | 0.538 92 | 0.984 | 3.25 | 0.000* | ||||
| 0.342 21 | ?0.071 25 | 1.054 08 | ?0.036 59 | 0.240 54 | 0.030 28 | 0.533 94 | 0.530 43 | 0.982 | 0.49 | 0.000* | ||||
| 栎树林 Quercus spp. forest | 3.584 64 | ?0.257 31 | 1.083 09 | 0.036 80 | 0.091 64 | 0.001 85 | 0.976 | 10.82 | — | |||||
| 3.962 38 | 0.175 77 | 1.049 32 | 0.054 25 | 0.104 62 | ?0.044 73 | 0.483 72 | 0.491 41 | 0.978 | 10.90 | 0.001* | ||||
| 1.330 31 | 0.196 34 | 1.008 81 | 0.012 56 | 0.046 17 | ?0.041 02 | 0.468 49 | 0.476 35 | 0.997 | 0.85 | 0.000* | ||||
| 木荷林 Schima superba forest | 3.016 58 | 0.553 27 | 1.045 98 | 0.007 04 | 0.198 61 | ?0.068 09 | 0.986 | 5.56 | 0.762 | |||||
| 2.797 66 | 0.501 51 | 1.034 60 | ?0.006 99 | 0.164 98 | ?0.057 49 | 0.554 34 | 0.549 79 | 0.993 | 3.34 | — | ||||
| 0.879 62 | 0.226 84 | 1.008 46 | 0.007 19 | 0.148 44 | ?0.075 50 | 0.548 08 | 0.543 80 | 0.992 | 0.99 | 0.000* | ||||
| 相思林 Acacia spp. forest | 4.200 32 | ?0.578 31 | 1.045 53 | ?0.036 09 | 0.054 94 | 0.126 22 | 0.989 | 5.56 | 0.001* | |||||
| 1.616 34 | 0.169 80 | 0.945 77 | 0.033 00 | 0.533 41 | ?0.084 22 | 0.534 12 | 0.534 74 | 0.984 | 5.89 | 0.311 | ||||
| 0.128 65 | ?0.025 10 | 0.989 98 | 0.011 65 | 0.896 78 | 0.100 42 | 0.525 84 | 0.524 94 | 0.997 | 0.79 | 0.000* | ||||
| 其他软阔林 Other soft broadleaved forest | 3.368 01 | ?0.159 66 | 1.068 08 | 0.024 57 | 0.141 79 | ?0.000 37 | 0.979 | 6.91 | — | |||||
| 0.756 10 | ?0.132 43 | 1.019 70 | ?0.018 66 | 0.771 45 | 0.105 02 | 0.520 92 | 0.523 78 | 0.997 | 2.07 | 0.001* | ||||
| 0.199 21 | ?0.035 50 | 1.039 47 | ?0.038 82 | 0.733 00 | 0.138 16 | 0.510 26 | 0.512 74 | 0.997 | 0.58 | 0.000* | ||||
| 其他硬阔林 Other hard broadleaved forest | 3.601 74 | 0.004 28 | 1.094 19 | ?0.027 00 | 0.070 72 | 0.049 94 | 0.980 | 7.91 | 0.000* | |||||
| 0.995 27 | ?0.232 89 | 1.003 02 | ?0.014 14 | 0.724 59 | 0.145 72 | 0.522 76 | 0.524 05 | 0.996 | 3.17 | 0.000* | ||||
| 0.240 39 | ?0.060 26 | 0.991 64 | ?0.011 04 | 0.705 37 | 0.141 74 | 0.513 81 | 0.514 88 | 0.995 | 0.83 | 0.002* | ||||
表5
模型系统M-5拟合与评价结果①"
| 森林类型 Forest type | 模型Model | 含碳系数 Carbon content coefficient | 评价指标 Evaluation index | P | |
| SEE | |||||
| 马尾松林 Pinus massoniana forest | 0.974 | 6.71 | |||
| 0.541 73 | 0.983 | 4.20 | |||
| 0.534 55 | 0.962 | 1.30 | 0.000* | ||
| 湿地松林 Pinus elliottii forest | 0.980 | 4.03 | |||
| 0.562 58 | 0.987 | 2.36 | |||
| 0.550 85 | 0.992 | 0.52 | 0.223 | ||
| 桉树林 Eucalyptus spp. forest | 0.997 | 1.41 | 0.000* | ||
| 0.540 41 | 0.974 | 4.05 | 0.010* | ||
| 0.533 31 | 0.947 | 0.83 | 0.135 | ||
| 栎树林 Quercus spp. forest | 0.985 | 8.41 | 0.000* | ||
| 0.487 94 | 0.988 | 7.99 | 0.000* | ||
| 0.472 85 | 0.995 | 1.12 | 0.000* | ||
| 其他软阔林 Other soft broadleaved forest | 0.989 | 5.08 | 0.000* | ||
| 0.521 97 | 0.998 | 1.89 | 0.000* | ||
| 0.511 16 | 0.997 | 0.54 | 0.000* | ||
| 针叶混交林 Coniferous mixed forest | 0.979 | 5.86 | 0.018* | ||
| 0.546 83 | 0.976 | 4.38 | - | ||
| 0.538 01 | 0.951 | 1.47 | 0.768 | ||
| 阔叶混交林 Broadleaved mixed forest | 0.979 | 8.86 | 0.000* | ||
| 0.520 14 | 0.978 | 8.50 | 0.000* | ||
| 0.504 93 | 0.976 | 2.19 | 0.000* | ||
| 针阔混交林 Coniferous and broadleaved mixed forest | 0.984 | 6.34 | 0.000* | ||
| 0.535 91 | 0.970 | 6.68 | 0.000* | ||
| 0.525 40 | 0.966 | 1.75 | 0.000* | ||
| 曹 磊, 刘晓彤, 李海奎, 等. 广东省常绿阔叶林生物量生长模型. 林业科学研究, 2020, 33 (5): 61- 67. | |
| Cao L, Liu X T, Li H K, et al. Biomass growth models for evergreen broad-leaved forests in Guangdong. Forest Research, 2020, 33 (5): 61- 67. | |
| 国家林业和草原局. 2014a. LY/T 2263—2014 立木生物量模型及碳计量参数——马尾松. 北京: 中国标准出版社. | |
| National Forestry and Grassland Administration. 2014a. LY/T 2263—2014 tree biomass models and related parameters to carbon accounting for Pinus massoniana. Beijing: China Standard Press. [in Chinese] | |
| 国家林业和草原局. 2014b. LY/T 2261—2014 立木生物量模型及碳计量参数——湿地松. 北京: 中国标准出版社. | |
| National Forestry and Grassland Administration. 2014b. LY/T 2261—2014 tree biomass models and related parameters to carbon accounting for Pinus elliottii. Beijing: China Standard Press. [in Chinese] | |
| 国家林业和草原局. 2014c. LY/T 2264—2014 立木生物量模型及碳计量参数——杉木. 北京: 中国标准出版社. | |
| National Forestry and Grassland Administration. 2014c. LY/T 2264—2014 tree biomass models and related parameters to carbon accounting for Cunninghamia lanceolata. Beijing: China Standard Press. [in Chinese] | |
| 国家林业和草原局. 2016a. LY/T 2657—2016 立木生物量模型及碳计量参数——柳杉. 北京: 中国标准出版社. | |
| National Forestry and Grassland Administration. 2016a. LY/T 2657—2016 tree biomass models and related parameters to carbon accounting for Cryptomeria fortunei. Beijing: China Standard Press. [in Chinese] | |
| 国家林业和草原局. 2016b. LY/T 2658—2016 立木生物量模型及碳计量参数——栎树. 北京: 中国标准出版社. | |
| National Forestry and Grassland Administration. 2016b. LY/T 2658—2016 tree biomass models and related parameters to carbon accounting for Quercus. Beijing: China Standard Press. [in Chinese] | |
| 国家林业和草原局. 2016c. LY/T 2660—2016 立木生物量模型及碳计量参数——木荷. 北京: 中国标准出版社. | |
| National Forestry and Grassland Administration. 2016c. LY/T 2660—2016 tree biomass models and related parameters to carbon accounting for Schima superba. Beijing: China Standard Press. [in Chinese] | |
| 国家林业和草原局. 2016d. LY/T 2661—2016 立木生物量模型及碳计量参数——枫香. 北京: 中国标准出版社. | |
| National Forestry and Grassland Administration. 2016d. LY/T 2661—2016 tree biomass models and related parameters to carbon accounting for Liquidambar formosana. Beijing: China Standard Press. [in Chinese] | |
| 何 潇, 雷相东. 东北地区落叶松人工林生物量转换与扩展因子空间自回归模型. 林业科学, 2021, 57 (10): 49- 58. | |
| He X, Lei X D. Spatial autoregressive biomass conversion and expansion factor models for larch plantations in northeast China. Scientia Silvae Sinicae, 2021, 57 (10): 49- 58. | |
| 黄金金, 刘晓彤, 张逸如, 等. 广东省含参数分级的阔叶林分生物量生长模型. 北京林业大学学报, 2022a, 44 (5): 19- 33. | |
| Huang J J, Liu X T, Zhang Y R, et al. Stand biomass growth model of broadleaved forest with parameter classification in Guangdong Province of southern China. Journal of Beijing Forestry University, 2022a, 44 (5): 19- 33. | |
| 黄金金, 刘晓彤, 张逸如, 等. 广东省针叶树种蓄积量和生物量生长模型研究. 林业科学研究, 2022b, 35 (3): 93- 102. | |
| Huang J J, Liu X T, Zhang Y R, et al. Growth models of stand volume and biomass of coniferous species in Guangdong Province. Forest Research, 2022b, 35 (3): 93- 102. | |
| 李海奎, 雷渊才. 2010. 中国森林植被生物量和碳储量评估. 北京: 中国林业出版社. | |
| Li H K, Lei Y C. 2010. Estimation and evaluation of forest biomass carbon storage in China. Beijing: China Forestry Publishing House. [in Chinese] | |
| 罗云建, 王效科, 逯 非. 2015. 中国主要林木生物量模型手册. 北京: 中国林业出版社. | |
| Luo Y J, Wang X K, Lu F. 2015. Comprehensive database of biomass regressions for China's tree species. Beijing: China Forestry Publishing House. [in Chinese] | |
| 唐守正, 郎奎建, 李海奎. 2008. 统计和生物数学模型计算(Forstat教程). 北京: 科学出版社. | |
| Tang S Z, Lang K J, Li H K. 2008. Statistics and computation of biomathematical models (Forstat textbook). Beijing: Science Press. [in Chinese] | |
| 徐期瑚, 林丽平, 薛春泉, 等. 广东不同起源枫香各器官的含碳系数及碳储量. 森林与环境学报, 2018a, 38 (3): 318- 325. | |
| Xu Q H, Lin L P, Xue C Q, et al. Carbon content coefficient and storage in different origins of Liquidambar formosana in Guangdong Province. Journal of Forest and Environment, 2018a, 38 (3): 318- 325. | |
| 徐期瑚, 林丽平, 薛春泉, 等. 广东木荷各器官含碳率及碳储量研究. 中南林业科技大学学报, 2018b, 38 (10): 71- 78. | |
| Xu Q H, Lin L P, Xue C Q, et al. Component specific carbon content coefficients and storage of Schima superba in Guangdong Province. Journal of Central South University of Forestry & Technology, 2018b, 38 (10): 71- 78. | |
| 徐期瑚, 林丽平, 薛春泉, 等. 广东樟树各器官含碳率及碳储量. 浙江农林大学学报, 2019, 36 (1): 70- 79. | |
| Xu Q H, Lin L P, Xue C Q, et al. Component specific carbon content coefficient and storage of Cinnamomum camphora in Guangdong Province. Journal of Zhejiang A & F University, 2019, 36 (1): 70- 79. | |
| 薛春泉, 陈振雄, 杨加志, 等. 省市县一体化森林碳储量估测技术体系: 以广东省为例. 林业资源管理, 2022, (4): 157- 163. | |
| Xue C Q, Chen Z X, Yang J Z, et al. A provincial-municipal-county integrated forest carbon storage estimating technology system: take Guangdong Province as an example. Forest Resources Management, 2022, (4): 157- 163. | |
| 叶金盛. 广东省主要树种相对树高曲线模型的研建. 广东林业科技, 2006, 22 (1): 26- 31. | |
| Ye J S. Establishment of relative tree height models for main tree species in Guangdong. Guangdong Forestry Science and Technology, 2006, 22 (1): 26- 31. | |
| 曾伟生, 孙乡楠, 王六如, 等. 东北林区10种主要森林类型的蓄积量、生物量和碳储量模型研建. 北京林业大学学报, 2021, 43 (3): 1- 8. | |
| Zeng W S, Sun X N, Wang L R, et al. Developing stand volume, biomass and carbon stock models for ten major forest types in forest region of northeastern China. Journal of Beijing Forestry University, 2021, 43 (3): 1- 8. | |
| 曾伟生, 唐守正. 立木生物量方程的优度评价和精度分析. 林业科学, 2011, 47 (11): 106- 113. | |
| Zeng W S, Tang S Z. Goodness evaluation and precision analysis of tree biomass equations. Scientia Silvae Sinicae, 2011, 47 (11): 106- 113. | |
| 曾伟生, 唐守正. 一个新的通用性相对生长生物量模型. 林业科学, 2012, 48 (1): 48- 52. | |
| Zeng W S, Tang S Z. A new general biomass allometric model. Scientia Silvae Sinicae, 2012, 48 (1): 48- 52. | |
| 曾伟生. 加权回归估计中不同权函数的对比分析. 林业资源管理, 2013, (5): 55- 61. | |
| Zeng W S. Comparison of different weight functions in weighted regression. Forest Resources Management, 2013, (5): 55- 61. | |
| 曾伟生. 基于木材密度的34个树种组一元立木生物量模型建立. 林业资源管理, 2017, (6): 41- 46. | |
| Zeng W S. Developing one-variable individual tree biomass models based on wood density for 34 tree species in China. Forest Resources Management, 2017, (6): 41- 46. | |
| 张红爱. 广东8种主要乔木树种碳含量测定分析. 林业资源管理, 2018, (1): 148- 154. | |
| Zhang H A. Measurement and analysis of carbon content rates of eight tree species in Guangdong Province. Forest Resources Management, 2018, (1): 148- 154. | |
|
Aguirre A, del Río M, Ruiz-Peinado R, et al. Stand-level biomass models for predicting C stock for the main Spanish pine species. Forest Ecosystems, 2021, 8, 29.
doi: 10.1186/s40663-021-00308-w |
|
|
Bennett A C, Penman T D, Arndt S K, et al. Climate more important than soils for predicting forest biomass at the continental scale. Ecography, 2020, 43 (11): 1692- 1705.
doi: 10.1111/ecog.05180 |
|
|
Dong L H, Zhang L J, Li F R. Evaluation of stand biomass estimation methods for major forest types in the Eastern Da Xing’an Mountains, Northeast China. Forests, 2019, 10 (9): 715.
doi: 10.3390/f10090715 |
|
| Fang J Y, Yu G R, Liu L L, et al. Climate change, human impacts, and carbon sequestration in China. Proceedings of the National Academy of Sciences of the United States of America, 2018, 115 (16): 4015- 4020. | |
| Fu L Y, Lei X D, Hu Z D, et al. Integrating regional climate change into allometric equations for estimating tree aboveground biomass of Masson pine in China. Annals of Forest Science, 2017a, 74 (2): 1- 15. | |
|
Fu L Y, Sun W, Wang G X. A climate-sensitive aboveground biomass model for three larch species in northeastern and northern China. Trees, 2017b, 31 (2): 557- 573.
doi: 10.1007/s00468-016-1490-6 |
|
|
González-García M, Hevia A, Majada J, et al. Above-ground biomass estimation at tree and stand level for short rotation plantations of Eucalyptus nitens (Deane & Maiden) Maiden in northwest Spain. Biomass and Bioenergy, 2013, 54, 147- 157.
doi: 10.1016/j.biombioe.2013.03.019 |
|
| He X, Lei X D, Dong L H. 2021. How large is the difference in large-scale forest biomass estimations based on new climate-modified stand biomass models? Ecological Indicators, 126: 107569. | |
|
Hu H F, Wang S P, Guo Z D, et al. The stage-classified matrix models project a significant increase in biomass carbon stocks in China’s forests between 2005 and 2050. Scientific Reports, 2015, 5, 11203.
doi: 10.1038/srep11203 |
|
|
Huang L, Liu J Y, Shao Q Q, et al. Carbon sequestration by forestation across China: past, present, and future. Renewable and Sustainable Energy Reviews, 2012, 16 (2): 1291- 1299.
doi: 10.1016/j.rser.2011.10.004 |
|
| Jagodziński A M, Dyderski M K, Gęsikiewicz K, et al. Tree and stand level estimations of Abies alba Mill. aboveground biomass. Annals of Forest Science, 2019, 76 (2): 1- 14. | |
|
Jagodziński A M, Dyderski M K, Horodecki P. Differences in biomass production and carbon sequestration between highland and lowland stands of Picea abies (L. ) H. Karst. and Fagus sylvatica L. Forest Ecology and Management, 2020, 474, 118329.
doi: 10.1016/j.foreco.2020.118329 |
|
|
Jagodziński A, Dyderski M, Gęsikiewicz K, et al. Tree- and stand-level biomass estimation in a Larix decidua Mill. chronosequence. Forests, 2018, 9 (10): 587.
doi: 10.3390/f9100587 |
|
|
Khan M N I, Shil M C, Azad M S, et al. Allometric relationships of stem volume and stand level carbon stocks at varying stand density in Swietenia macrophylla King plantations, Bangladesh. Forest Ecology and Management, 2018, 430, 639- 648.
doi: 10.1016/j.foreco.2018.09.002 |
|
|
Luo Y J, Wang X K, Ouyang Z Y, et al. A review of biomass equations for China’s tree species. Earth System Science Data, 2020, 12 (1): 21- 40.
doi: 10.5194/essd-12-21-2020 |
|
|
Sileshi G W. A critical review of forest biomass estimation models, common mistakes and corrective measures. Forest Ecology and Management, 2014, 329, 237- 254.
doi: 10.1016/j.foreco.2014.06.026 |
|
|
Sullivan M J P, Lewis S L, Affum-Baffoe K, et al. Long-term thermal sensitivity of Earth's tropical forests. Science, 2020, 368 (6493): 869- 874.
doi: 10.1126/science.aaw7578 |
|
| Tang X L, Zhao X, Bai Y F, et al. Carbon pools in China’s terrestrial ecosystems: new estimates based on an intensive field survey. Proceedings of the National Academy of Sciences of the United States of America, 2018, 115 (16): 4021- 4026. | |
|
Wang G, Guan D S, Xiao L, et al. Forest biomass-carbon variation affected by the climatic and topographic factors in Pearl River Delta, South China. Journal of Environmental Management, 2019, 232, 781- 788.
doi: 10.1016/j.jenvman.2018.11.130 |
|
|
Wang T L, Wang G Y, Innes J L, et al. ClimateAP: an application for dynamic local downscaling of historical and future climate data in Asia Pacific. Frontiers of Agricultural Science and Engineering, 2017, 4 (4): 448.
doi: 10.15302/J-FASE-2017172 |
|
|
West G B, Brown J H, Enquist B J. The fourth dimension of life: fractal geometry and allometric scaling of organisms. Science, 1999, 284 (5420): 1677- 1679.
doi: 10.1126/science.284.5420.1677 |
|
|
Zeng W S, Chen X Y, Yang X Y. Developing national and regional individual tree biomass models and analyzing impact of climatic factors on biomass estimation for poplar plantations in China. Trees, 2021, 35 (1): 93- 102.
doi: 10.1007/s00468-020-02020-8 |
|
|
Zeng W S, Zhang L J, Chen X Y, et al. Construction of compatible and additive individual-tree biomass models for Pinus tabulaeformis in China. Canadian Journal of Forest Research, 2017, 47 (4): 467- 475.
doi: 10.1139/cjfr-2016-0342 |
| [1] | 杨涛, 邱勇斌, 沈汉, 郑成忠, 张振, 王文月, 金国庆, 周志春. 柏木无性系和家系含碳量的早期评价与优良品系选择[J]. 林业科学, 2023, 59(9): 85-94. |
| [2] | 薛盼盼,缪宁,岳喜明,陶琼,张远东,冯秋红,毛康珊. 青藏高原东缘岷江冷杉径向生长对升温响应分异的坡向和海拔差异[J]. 林业科学, 2023, 59(7): 65-77. |
| [3] | 屈彦成,江怡航,姜彦妍,张建国,罗安利,张雄清. 基于胸高处边材面积、胸径和冠基部直径的杉木单木叶生物量预测模型[J]. 林业科学, 2023, 59(7): 106-114. |
| [4] | 韦雪蕾,张国钢,贾茹,姬云瑞,徐红英,杨泽玉,刘化金,刘宇霖,杨培宇. 黑龙江兴凯湖水鸟多样性变化及其影响因素[J]. 林业科学, 2023, 59(6): 118-129. |
| [5] | 王烨,李广德,刘国彬,廖婷,郭丽琴,姚砚武,曹均. 毛白杨人工林物候特征和生长对施肥的可塑性响应[J]. 林业科学, 2023, 59(5): 32-40. |
| [6] | 曾伟生,蒲莹,杨学云,易善军. 我国5种主要人工林乔木层碳储量生长模型及其气候驱动分析[J]. 林业科学, 2023, 59(3): 21-30. |
| [7] | 张煜星,王雪军. 1973—2018年我国桉树人工林生产力及碳汇能力[J]. 林业科学, 2023, 59(3): 54-64. |
| [8] | 刘南,曲鲁平,汤行昊,余海霞,张子雷,王浩,邵长亮,董刚. 水分条件和热浪频次对木荷苗木光合特性与生长速率的影响[J]. 林业科学, 2023, 59(3): 104-114. |
| [9] | 王亚,王军辉,王福德,刘逸夫,谭灿灿,袁艳超,聂稳,刘建锋,常二梅,贾子瑞. 末次间冰期以来及未来气候情景下红皮云杉适生分布区模拟[J]. 林业科学, 2023, 59(12): 1-12. |
| [10] | 张淑宁,陈俊兴,敖敦,红梅,张雅茜,包福海,王淋,乌云塔娜,白玉娥,包文泉. 气候变化背景下我国长柄扁桃潜在适生区预测[J]. 林业科学, 2023, 59(12): 25-36. |
| [11] | 周昊,叶尔江·拜克吐尔汉,何怀江,张春雨,赵秀海,郝珉辉. 东北地区主要造林树种幼苗期生物量分配特征与异速生长模型[J]. 林业科学, 2023, 59(11): 23-32. |
| [12] | 司莉青,王明玉,陈锋,舒立福,赵凤君,李伟克. 雷电分布特征与雷击森林火预警[J]. 林业科学, 2023, 59(10): 1-8. |
| [13] | 王薇,赵涵,黄欣,侯卓梁,姜在民,蔡靖. 白杨无性系叶片水力及经济性状与生物量的关系[J]. 林业科学, 2023, 59(10): 89-98. |
| [14] | 张雪,王冬梅,温文杰,刘若莎. 青海高寒区4种人工林细根生物量及其养分储量变化特征[J]. 林业科学, 2022, 58(6): 13-22. |
| [15] | 郝龙飞,刘婷岩,何永琴,张盛晰,赵媛. 菌根真菌调控灌木铁线莲根际土壤生态化学计量特征对氮沉降的应激响应[J]. 林业科学, 2022, 58(6): 151-160. |
| 阅读次数 | ||||||
|
全文 |
|
|||||
|
摘要 |
|
|||||