
林业科学 ›› 2023, Vol. 59 ›› Issue (11): 23-32.doi: 10.11707/j.1001-7488.LYKX20220428
周昊1( ),叶尔江·拜克吐尔汉2,何怀江3,张春雨1,赵秀海1,郝珉辉1,*()
收稿日期:2022-06-23
接受日期:2023-08-25
出版日期:2023-11-25
发布日期:2023-12-08
通讯作者:
郝珉辉
E-mail:1533706828@qq.com;haomh0515@163.com
基金资助:
Hao Zhou1(),Baiketuerhan Yeerjiang2,Huaijiang He3,Chunyu Zhang1,Xiuhai Zhao1,Minhui Hao1,*()
Received:2022-06-23
Accepted:2023-08-25
Online:2023-11-25
Published:2023-12-08
Contact:
Minhui Hao
E-mail:1533706828@qq.com;haomh0515@163.com
摘要:
目的: 分析东北地区10种主要造林树种幼龄期各组分生物量分配特征,建立并筛选单树种和全树种最优生长模型,为该地区森林生物量尤其是幼龄林生物量估算提供模型参考。方法: 在吉林省舒兰市生物多样性与生态系统功能控制试验样地内,2021年7―8月份选取长势良好的植株进行全株取样,每个树种选取15~21株个体,共计200株。测量根系、茎干、叶片各器官生物量及其分配比例,并计算地上部分以及整株生物量。以基径和树高为自变量,以根系、茎干、叶片各器官和地上部分及整株生物量为因变量,建立一元线性、多元线性、幂函数等形式的回归方程,构建单树种和全树种生物量模型,并通过决定系数、参数显著性以及赤池信息标准(AIC)等指标筛选最优模型。结果: 1)10个树种的生物量总体呈现出茎干生物量占比最高(45%)、根系生物量次之(35.5%)、叶片生物量最低(19.5%)的分配格局。随着基径增长,茎干生物量占比呈上升趋势,叶片生物量占比呈下降趋势,根系生物量占比变化不明显。2)10个树种的生物量最优模型均以幂函数形式为主,单树种生物量模型以Y=a(D2H)b和Y=aDb为最优形式;全树种生物量模型则以Y=a(D2H)b和Y=aDbHc为最优模型形式(D为基径,H 为树高,a,b,c分别为方程系数)。结论: 幂函数形式为生物量最优模型,其中单树种生物量模型具有更高拟合优度,适用于特定树种生物量的精确估算,而全树种生物量模型则对区域性的生物量估算具有更广泛的适用性。
中图分类号:
周昊,叶尔江·拜克吐尔汉,何怀江,张春雨,赵秀海,郝珉辉. 东北地区主要造林树种幼苗期生物量分配特征与异速生长模型[J]. 林业科学, 2023, 59(11): 23-32.
Hao Zhou,Baiketuerhan Yeerjiang,Huaijiang He,Chunyu Zhang,Xiuhai Zhao,Minhui Hao. Biomass Distribution Characteristics and Species-Specific Allometric Equations for Afforestation Species in Northeast China[J]. Scientia Silvae Sinicae, 2023, 59(11): 23-32.
表1
生物量方程形式①"
| 方程代码 Equation code | 方程类型 Model styles | 方程形式 Equations form | 方程代码 Equation code | 方程类型 Model styles | 方程形式 Equations form |
| Eq.1 | 对数Logarithmic | lnY=lna+blnH | Eq.8 | 一元二次Quadratic | Y=aH2+b |
| Eq.2 | 对数Logarithmic | lnY=lna+blnD | Eq.9 | 一元二次Quadratic | Y=aD2+b |
| Eq.3 | 对数Logarithmic | lnY=lna+bln(D2H) | Eq.10 | 一元二次Quadratic | Y=aH+bH2+c |
| Eq.4 | 对数Logarithmic | lnY=lna+blnH+clnD | Eq.11 | 一元二次Quadratic | Y=aD+bD2+c |
| Eq.5 | 一元线性Linear | Y=aH+b | Eq.12 | 多元二次Multivariate quadratic | Y=aH+bD2+c |
| Eq.6 | 一元线性Linear | Y=aD+b | Eq.13 | 多元二次Multivariate quadratic | Y=aD+bH2+c |
| Eq.7 | 多元线性Multiple linear | Y=aH+bD+c | Eq.14 | 多元二次Multivariate quadratic | Y=aH2+bD2+c |
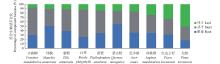
图1
不同树种各组分生物量分配格局"
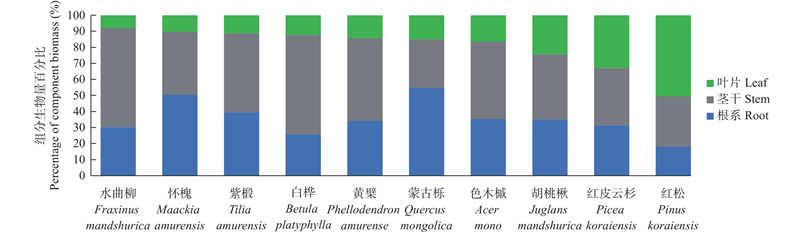
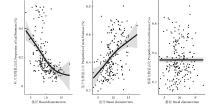
图2
各器官生物量分配比例随基径的变化趋势"
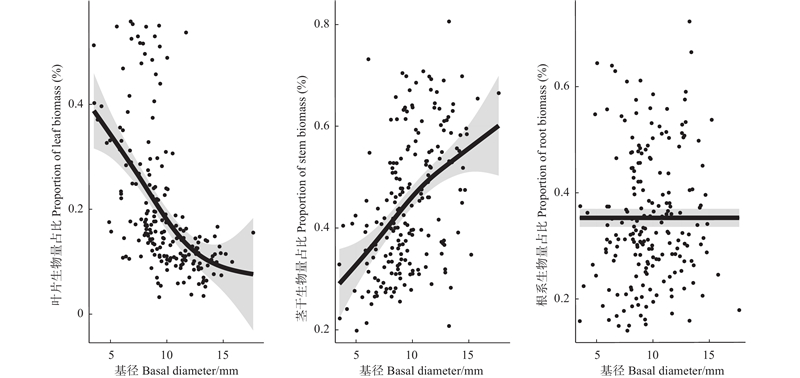
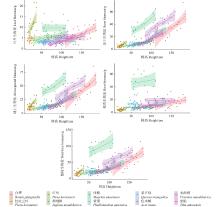
图3
各组分生物量随树高的变化趋势"

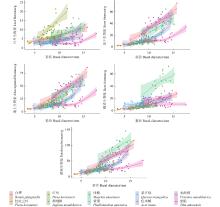
图4
各组分生物量随基径的变化趋势"

表2
各组分生物量最优模型①"
| 树种 Species | 组分 Components | 方程形式 Equation form | 系数Coefficients | 拟合优度 R2 | 显著性 P | 校正因子 CF | ||
| a | b | c | ||||||
| 白桦 Betula platyphylla | 地上生物量 Aboveground biomass | Y=a(D2H)b | 0.021* | 0.775 * | 0.87 | <0.05 | 1.001 | |
| 整株生物量 Total biomass | Y=a(D2H)b | 0.023 * | 0.794 * | 0.83 | <0.05 | 1.001 | ||
| 根系生物量 Root biomass | Y=aDb | 0.088 * | 2.133 * | 0.67 | <0.05 | 1.010 | ||
| 茎干生物量 Stem biomass | Y=a(D2H)b | 0.017 * | 0.780 * | 0.88 | <0.05 | 1.001 | ||
| 叶片生物量 Leaf biomass | Y=a(D2H)b | 0.004 * | 0.757 * | 0.65 | <0.05 | 1.015 | ||
| 红皮云杉 Picea koraiensis | 地上生物量 Aboveground biomass | Y=a(D2H)b | 0.242 * | 0.545 * | 0.82 | <0.05 | 1.003 | |
| 整株生物量 Total biomass | Y=aDb | 1.438 * | 1.240 * | 0.83 | <0.05 | 1.003 | ||
| 根系生物量 Root biomass | Y=aDb | 0.271 * | 1.538 * | 0.78 | <0.05 | 1.073 | ||
| 茎干生物量 Stem biomass | Y=a(D2H)b | 0.040 * | 0.712 * | 0.90 | <0.05 | 1.006 | ||
| 叶片生物量 Leaf biomass | Y=aDb | 0.982 * | 0.852 * | 0.48 | <0.05 | 1.023 | ||
| 红松 Pinus koraiensis | 地上生物量 Aboveground biomass | Y=a(D2H)b | 0.846 * | 0.714 * | 0.77 | <0.05 | 1.003 | |
| 整株生物量 Total biomass | Y=a(D2H)b | 0.111 * | 0.704 * | 0.81 | <0.05 | 1.002 | ||
| 根系生物量 Root biomass | Y=aDb | 0.068 * | 1.942 * | 0.84 | <0.05 | 1.011 | ||
| 茎干生物量 Stem biomass | Y=a(D2H)b | 0.016 * | 0.809 * | 0.83 | <0.05 | 1.007 | ||
| 叶片生物量 Leaf biomass | Y=a(D2H)b | 0.082 * | 0.655 * | 0.67 | <0.05 | 1.007 | ||
| 黄檗 Phellodendron amurense | 地上生物量 Aboveground biomass | Y=a(D2H)b | 0.017 * | 0.766 * | 0.83 | <0.05 | 1.003 | |
| 整株生物量 Total biomass | Y=a(D2H)b | 0.029 * | 0.752 * | 0.80 | <0.05 | 1.003 | ||
| 根系生物量 Root biomass | Y=aDb | 0.051 * | 2.249 * | 0.72 | <0.05 | 1.009 | ||
| 茎干生物量 Stem biomass | Y=a(D2H)b | 0.005 * | 0.866 * | 0.87 | <0.05 | 1.003 | ||
| 叶片生物量 Leaf biomass | Y=aDb | 0.214 * | 1.249 * | 0.41 | <0.05 | 1.049 | ||
| 怀槐 Maackia amurensis | 地上生物量 Aboveground biomass | Y=aDbHc | 0.033 * | 2.071 * | 0.464 * | 0.74 | <0.05 | 1.002 |
| 整株生物量 Total biomass | Y=aDb | 0.274 * | 2.289 * | 0.62 | <0.05 | 1.002 | ||
| 根系生物量 (Root biomass) | Y=aDb | 0.142 * | 2.274 * | 0.49 | <0.05 | 1.004 | ||
| 茎干生物量 Stem biomass | Y=a(D2H)b | 0.012 * | 0.857 * | 0.73 | <0.05 | 1.003 | ||
| 叶生物量 Leaf biomass | Y=aDb | 0.124 * | 1.704 * | 0.38 | <0.05 | 1.010 | ||
| 色木槭 Acer mono | 地上生物量 Aboveground biomass | Y=aHb | 0.007 * | 1.729 * | 0.58 | <0.05 | 1.009 | |
| 整株生物量 Total biomass | Y=a(D2H)b | 0.135 * | 0.590 * | 0.67 | <0.05 | 1.004 | ||
| 根系生物量 Root biomass | Y=a(D2H)b | 0.051 * | 0.583 * | 0.62 | <0.05 | 1.011 | ||
| 茎干生物量 Stem biomass | Y=aDbHc | 0.005 * | 0.959 * | 1.299 * | 0.72 | <0.05 | 1.010 | |
| 叶片生物量 Leaf biomass | Y=aHb | 0.052 * | 0.998 * | 0.22 | <0.05 | 1.063 | ||
| 蒙古栎 Quercus mongolica | 地上生物量 Aboveground biomass | Y=aDb | 0.593 * | 1.394 * | 0.71 | <0.05 | 1.003 | |
| 整株生物量 Total biomass | Y=aDb | 2.155 * | 1.152 * | 0.52 | <0.05 | 1.003 | ||
| 根系生物量 Root biomass | Y=aDb | 1.719 * | 0.966 * | 0.31 | <0.05 | 1.008 | ||
| 茎干生物量 Stem biomass | Y=a(D2H)b | 0.021 * | 0.715 * | 0.79 | <0.05 | 1.006 | ||
| 叶片生物量 Leaf biomass | Y=aDb | 0.529 * | 0.920 * | 0.36 | <0.05 | 1.023 | ||
| 水曲柳 Fraxinus mandshurica | 地上生物量 Aboveground biomass | Y=a(D2H)b | 0.051 * | 0.698 * | 0.63 | <0.05 | 1.003 | |
| 整株生物量 Total biomass | Y=a(D2H)b | 0.154 * | 0.620 * | 0.49 | <0.05 | 1.003 | ||
| 根系生物量 Root biomass | Y=a(D2H)b | 0.290 | 0.427 | 0.16 | 0.08 | 1.015 | ||
| 茎干生物量 Stem biomass | Y=a(D2H)b | 0.038 * | 0.715 * | 0.65 | <0.05 | 1.003 | ||
| 叶片生物量 Leaf biomass | Y=a(D2H)b | ?0.582 | 0.019 | 0.18 | 0.06 | 1.187 | ||
| 胡桃楸 Juglans mandshurica | 地上生物量 Aboveground biomass | Y=aHb | 0.339 * | 0.877 * | 0.65 | <0.05 | 1.004 | |
| 整株生物量 Total biomass | Y=aHb | 1.759 * | 0.595 * | 0.47 | <0.05 | 1.003 | ||
| 根系生物量 Root biomass | Y=aHb | 0.244 | 0.145 | 0.03 | 0.46 | 1.011 | ||
| 茎干生物量 Stem biomass | Y=aHb | 0.167 * | 0.932 * | 0.75 | <0.05 | 1.004 | ||
| 叶片生物量 Leaf biomass | Y=aHb | 0.190 * | 0.783 * | 0.31 | <0.05 | 1.051 | ||
| 紫椴 Tilia amurensis | 地上生物量 Aboveground biomass | Y=aDbHc | 0.002 * | 0.875 * | 1.481 * | 0.66 | <0.05 | 1.004 |
| 整株生物量 Total biomass | Y=a(D2H)b | 0.025 * | 0.483 * | 0.36 | <0.05 | 1.004 | ||
| 根系生物量 Root biomass | Y=aHb | 0.239 | 0.178 | 0.00 | 0.78 | 1.020 | ||
| 茎干生物量 Stem biomass | Y=aDbHc | 0.001 * | 0.954 * | 1.508 * | 0.69 | <0.05 | 1.005 | |
| 叶片生物量 Leaf biomass | Y=aHb | 0.002 * | 1.611 * | 0.35 | <0.05 | 1.157 | ||
| 全树种 All species | 地上生物量 Aboveground biomass | Y=aDbHc | 0.296 * | 1.336 * | 0.278 * | 0.56 | <0.05 | 1.013 |
| 整株生物量 Total biomass | Y=aDbHc | 0.434 * | 1.423 * | 0.248 * | 0.60 | <0.05 | 1.008 | |
| 根系生物量 Root biomass | Y=aDbHc | 0.114 * | 1.549 * | 0.242 * | 0.49 | <0.05 | 1.038 | |
| 茎干生物量 Stem biomass | Y=a(D2H)b | 0.041 * | 0.664 * | 0.73 | <0.05 | 1.019 | ||
| 叶片生物量 Leaf biomass | Y=aDbHc | 2.595 * | 0.985 * | ?0.352 * | 0.14 | <0.05 | 1.115 | |
表3
单树种和全树种生物量最优模型t检验"
| 检验类型Test type | 叶片生物量 Leaf biomass | 茎干生物量 Stem biomass | 地上生物量 Aboveground biomass | 根系生物量 Root biomass | 整株生物量 Total biomass |
| t检验值t-value | 5.69 | 1.84 | 5.77 | 2.09 | 0.70 |
| P检验值P-value | P<0.05 | P<0.05 | P<0.05 | P<0.05 | 0.25 |
|
代海军, 何怀江, 赵秀海, 等. 阔叶红松林两种主要树种的生物量分配格局及异速生长模型. 应用与环境生物学报, 2013, 19 (4): 718- 722.
doi: 10.3724/SP.J.1145.2013.00718 |
|
|
Dai H J, He H J, Zhao X H, et al. Biomass allocation patterns and allometric models of two dominant tree species in broad-leaved and Korean pine mixed forest. Chinese Journal of Applied and Environmental Biology, 2013, 19 (4): 718- 722.
doi: 10.3724/SP.J.1145.2013.00718 |
|
| 董 点, 林天喜, 唐景毅, 等. 紫椴生物量分配格局及异速生长方程. 北京林业大学学报, 2014, 36 (4): 54- 63. | |
| Dong D, Lin T X, Tang J Y, et al. Biomass allocation patterns and allometric models of Tilia amurensis. Journal of Beijing Forestry University, 2014, 36 (4): 54- 63. | |
| 董利虎. 2015a. 东北林区主要树种及林分类型生物量模型研究. 哈尔滨: 东北林业大学. | |
| Dong L H. 2015a. Developing individual and stand-level biomass equations in northeast China forest area. Haerbin: Northeast Forestry University.[in Chinese] | |
| 董利虎, 李凤日, 宋玉文. 东北林区4个天然针叶树种单木生物量模型误差结构及可加性模型. 应用生态学报, 2015b, 26 (3): 704- 714. | |
| Dong L H, Li F R, Song Y W. Error structure and additivity of individual tree biomass model for four natural conifer species in Northeast China. Chinese Journal of Applied Ecology, 2015b, 26 (3): 704- 714. | |
| 董利虎, 张连军, 李凤日. 立木生物量模型的误差结构和可加性. 林业科学, 2015c, 51 (2): 28- 36. | |
| Dong L H, Zhang L J, Li F R. Error structure and additivity of individual tree biomass model. Scientia Silvae Sinicae, 2015c, 51 (2): 28- 36. | |
| 范春楠, 庞圣江, 郑金萍, 等. 长白山林区14种幼树生物量估测模型. 北京林业大学学报, 2013, 35 (2): 9. | |
| Fan C N, Pang S J, Zheng J P, et al. Biomass estimating models of saplings for 14 species in Changbaishan Mountains, northeastern China. Journal of Beijing Forestry University, 2013, 35 (2): 9. | |
| 费 玲, 钟全林, 程栋梁, 等. 2016. 天然阔叶林与杉木人工林灌木层地上地下生物量的分配关系. 林业科学, 52(3): 97−104. | |
| Fei L, Zhong Q L, Cheng D L, et al. 2016. Biomass allocation between aboveground-and underground of shrub layer vegetation in natural evergreen broad-leaved forest and Chinese fir plantation. 52(3): 97−104.[in Chinese] | |
| 冯宗炜. 1999. 中国森林生态系统的生物量和生产力. 北京: 科学出版社. | |
| Feng Z W. 1999. Biomass and productivity of forest ecosystem in China. Beijing: Science Press.[in Chinese] | |
| 何怀江. 2018. 采伐干扰对吉林蛟河针阔混交林碳储量和碳平衡的影响. 北京: 北京林业大学. | |
| He H J. 2018. Effects of thinning disturbance on carbon storage and carbon balance in coniferous and broad-leaved mixed forest in JiaoheJilin Province. Beijing: Journal of Beijing Forestry University.[in Chinese] | |
| 侯燕南, 吴惠俐. 非线性回归方法建立亚热带常绿阔叶树种地上生物量相对生长方程. 中南林业科技大学学报, 2016, 36 (12): 98- 101,107. | |
| Hou Y N, Wu H L. Using nonlinear regression method to develop allometric equations for aboveground biomass estimate of three evergreen broadleaved tree species in subtropical China. Journal of Central South University of Forestry & Technology, 2016, 36 (12): 98- 101,107. | |
| 李晓娜, 国庆喜, 王兴昌, 等. 东北天然次生林下木树种生物量的相对生长. 林业科学, 2010, 46 (8): 22- 32. | |
| Li X N, Guo Q X, Wang X C, et al. Allometry of understory tree species in a natural secondary forest in northeast China. Scientia Silvae Sinicae, 2010, 46 (8): 22- 32. | |
| 黎燕琼, 郑绍伟, 龚固堂, 等. 不同年龄柏木混交林下主要灌木黄荆生物量及分配格局. 生态学报, 2010, 30 (11): 2809- 2818. | |
| Li Y Q, Zheng S W, Gong G T, et al. Biomass and its allocation of undergrowth Vitex negundo L. in different classes of mixed cypress forest. Acta Ecologica Sinica, 2010, 30 (11): 2809- 2818. | |
| 林 力. 2011. 马尾松人工林生物量模型的研究. 福州: 福建农林大学. | |
| Lin L. 2011. Studies on the Biomass model of Pinus massoniana plantations. Fuzhou: Fujian Agriculture and Forestry University.[in Chinese] | |
| 罗云建, 张小全, 王效科, 等. 森林生物量的估算方法及其研究进展. 林业科学, 2009, 45 (8): 129- 134. | |
| Luo Y J, Zhang X Q, Wang X K, et al. Forest biomass estimation methods and their prospects. Scientia Silvae Sinicae, 2009, 45 (8): 129- 134. | |
| 毛子军. 森林生态系统碳平衡估测方法及其研究进展. 植物生态学报, 2002, (6): 731- 738. | |
| Mao Z J. Summary of estimation methods and research advances of the carbon balance of forest ecosystem. Chinese Journal of Plant Ecology, 2002, (6): 731- 738. | |
| 孙 越, 何怀江, 李 良, 等. 阔叶红松林下6种早夏草本不同生长期生物量分配及模型构建. 生态学报, 2017, 37 (19): 6523- 6533. | |
| Sun Y, He H J, Li L, et al. Biomass allocation and biomass allometric models of six early-summer herbs under the canopy of broad-leaved Korean pine forest during different growth periods in Jiaohe, Jilin Province. Acta Ecologica Sinica, 2017, 37 (19): 6523- 6533. | |
| 唐守正, 张会儒, 胥 辉. 相容性生物量模型的建立及其估计方法研究. 林业科学, 2000, 36 (s1): 19- 27. | |
| Tang S Z, Zhang H R, Xu H. Study on establish and estimate method of compatible biomass model. Scientia Silvae Sinicae, 2000, 36 (s1): 19- 27. | |
|
王春梅, 王金达, 刘景双, 等. 东北地区森林资源生态风险评价研究. 应用生态学报, 2003,, 14 (6): 863- 866.
doi: 10.3321/j.issn:1001-9332.2003.06.006 |
|
|
Wang C M, Wang J D, Liu J S, et al. Ecological risk assessment of forest resource in northeast China. Chinese Journal of Applied Ecology, 2003,, 14 (6): 863- 866.
doi: 10.3321/j.issn:1001-9332.2003.06.006 |
|
| 王 淼, 李秋荣, 郝占庆, 等. 土壤水分变化对长白山主要树种蒙古栎幼树生长的影响. 应用生态学报, 2004, (10): 1765- 1770. | |
| Wang M, Li Q R, Hao Z Q, et al. Effects of soil water regimes on the growth of Quercus mongolica seedlings in Changbai Mountains. Chinese Journal of Applied Ecology, 2004, (10): 1765- 1770. | |
| 杨 瑞, 喻理飞, 罗 云, 等. 喀斯特森林林分环境对光皮桦幼树生物量的影响. 南京林业大学学报(自然科学版), 2009, 33 (1): 143- 145. | |
| Yang R, Yu L F, Luo Y, et al. Effects of different environment of Karst forest on the biomass of Betula luminifera saplings. Journal of Nanjing Forestry University(Natural Sciences Edition), 2009, 33 (1): 143- 145. | |
| 宇万太, 于永强. 植物地下进展. 应用生态学报, 2001, 12 (6): 927- 932. | |
| Yu W T, Yu Y Q. Advances in the rescarch of underground biomass. Chinese Journal of Applied Ecology, 2001, 12 (6): 927- 932. | |
| 张会儒, 雷相东, 张春雨, 等. 森林质量评价及精准提升理论与技术研究. 北京林业大学学报, 2009, 41 (5): 1- 18. | |
| Zhang H R, Lei X D, Zhang C Y, et al. Research on theory and technology of forest quality evaluation and precision improvement. Journal of Beijing Forestry University, 2009, 41 (5): 1- 18. | |
| 张梦弢, 亢新刚, 蔡 烁. 长白山云冷杉林下主要树种幼树生物量. 浙江农林大学学报, 2012, 29 (5): 655- 660. | |
| Zhang M T, Kang X G, Cai S. Biomass for saplings of primary species in a spruce-fir understory of the Changbai Mountains. Journal of Zhejiang A & F University, 2012, 29 (5): 655- 660. | |
| 张小全, 朱建华, 侯振宏. 主要发达国家林业有关碳源汇及其计量方法与参数. 林业科学研究, 2009, 22 (2): 285- 293. | |
| Zhang X Q, Zhu Z H, Hou Z H. Carbon removals/sources of forests and forest conversion and applie carbon accounting methods and parameters in major developed Count. Forest Research, 2009, 22 (2): 285- 293. | |
| 赵厚本, 周光益, 李兆佳, 等. 南亚热带常绿阔叶林4个常见树种的生物量分配特征与异速生长模型. 林业科学, 2022, 58 (2): 23- 31. | |
| Zhao H B, Zhou G Y, Li Z J, et al. Biomass allocation and allometric growth models of four common tree species in southern subtropical evergreen broad-leaved forest. Scientia Silvae Sinicae, 2022, 58 (2): 23- 31. | |
| Alaback P B. Biomass regression equations for understory plants in coastal Alaska: effects of species and sampling design on estimates. Northwestence, 1986, 60 (2): 90- 103. | |
|
Bond-Lamberty B, Wang C, Gower S T. Aboveground and belowground biomass and sapwood area allometric equations for six boreal tree species of northern Manitoba. Canadian Journal of Forest Research, 2002, 32 (8): 1441- 1450.
doi: 10.1139/x02-063 |
|
|
Chambers J Q, Joaquim D S, Ralfh J R, et al. Tree damage, allometric relationships, and above-ground net primary production in central Amazon forest. Forest Ecology and Management, 2001, 152 (1-3): 73- 84.
doi: 10.1016/S0378-1127(00)00591-0 |
|
| Chave J, Andalo C, Brown S, et al. 2005. Tree allometry and improved estimation of carbon stocks and balance in tropical forests. Oecologia. 145(1): 87−99. | |
|
Cienciala E, Černý M, Tatarinov F, et al. Biomass functions applicable to Scots pine. Trees, 2006, 20 (4): 483- 495.
doi: 10.1007/s00468-006-0064-4 |
|
| Duncanson L I, Dubayah R O, Enquist B J. Assessing the general patterns of forest structure: quantifying tree and forest allometric scaling relationships in the United States. Global Ecology and Biogeography, 2015, 24 (12): 1465- 1475. | |
|
Fournier R A, Luther J E, Guindon L, et al. Mapping aboveground tree biomass at the stand level from inventory information: test cases in Newfoundland and Quebec. Canadian Journal of Forest Research, 2003, 33, 1846- 1863.
doi: 10.1139/x03-099 |
|
|
Hendrik P, Niklas J K, Reich B P, et al. Biomass allocation to leaves, stems and roots: meta-analyses of interspecific variation and environmental control. The New Phytologist, 2012, 193 (1): 30- 50.
doi: 10.1111/j.1469-8137.2011.03952.x |
|
|
Hossain M, Saha C, Rubaiot Abdullah S M, et al. Allometric biomass, nutrient and carbon stock models for Kandelia candel of the Sundarbans, Bangladesh. Trees, 2016, 30 (3): 709- 717.
doi: 10.1007/s00468-015-1314-0 |
|
|
McCarthy M C, Enquist B J. Consistency between an allometric approach and optimal partitioning theory in global patterns of plant biomass allocation. Functional Ecology, 2007, 21 (4): 713- 720.
doi: 10.1111/j.1365-2435.2007.01276.x |
|
| Peichl M, Arain M A. Allometry and partitioning of above- and belowground tree biomass in an age-sequence of white pine forests. Forest Ecology and Management, 2007, 253 (1-3): 68- 80. | |
| Roxburgh S H, Paul K I, Clifford D, et al. Guidelines for constructing allometric models for the prediction of woody biomass: how many individuals to harvest?. Ecosphere, 2016, 6 (3): 1- 27. | |
|
Tobner C M, Paquette A Gravel D, et al. Functional identity is the main driver of diversity effects in young tree communities. Ecology Letters, 2016, 19 (6): 638- 647.
doi: 10.1111/ele.12600 |
|
|
Ubuy M H, Eid T, Bollandsås O M, et al. Aboveground biomass models for trees and shrubs of exclosures in the drylands of Tigray, northern Ethiopia. Journal of Arid Environments, 2018, 156, 9- 18.
doi: 10.1016/j.jaridenv.2018.05.007 |
|
|
Wang C K. Biomass allometric equations for 10 co-occurring tree species in Chinese temperate forests. Forest Ecology and Management, 2006, 222 (1-3): 9- 16.
doi: 10.1016/j.foreco.2005.10.074 |
|
|
Wang C K, Bond-Lamberty B, Gower S T. Environmental controls on carbon dioxide flux from black spruce coarse woody debris. Oecologia, 2002, 132 (3): 374- 381.
doi: 10.1007/s00442-002-0987-4 |
|
| Weiner J. Allocation, plasticity and allometry in plants. Perspectives in Plant Ecology Evolution and Systematics, 2004, 6 (4): 207- 215. | |
| Xie X F, Hu Y K, Pan X, et al. Biomass allocation of stoloniferous and rhizomatous plant in response toresource availability: a phylogenetic meta-analysis. Frontiers in Plant Science, 2016, 7, 603. |
| [1] | 杨涛, 邱勇斌, 沈汉, 郑成忠, 张振, 王文月, 金国庆, 周志春. 柏木无性系和家系含碳量的早期评价与优良品系选择[J]. 林业科学, 2023, 59(9): 85-94. |
| [2] | 屈彦成,江怡航,姜彦妍,张建国,罗安利,张雄清. 基于胸高处边材面积、胸径和冠基部直径的杉木单木叶生物量预测模型[J]. 林业科学, 2023, 59(7): 106-114. |
| [3] | 王烨,李广德,刘国彬,廖婷,郭丽琴,姚砚武,曹均. 毛白杨人工林物候特征和生长对施肥的可塑性响应[J]. 林业科学, 2023, 59(5): 32-40. |
| [4] | 王薇,赵涵,黄欣,侯卓梁,姜在民,蔡靖. 白杨无性系叶片水力及经济性状与生物量的关系[J]. 林业科学, 2023, 59(10): 89-98. |
| [5] | 张雪,王冬梅,温文杰,刘若莎. 青海高寒区4种人工林细根生物量及其养分储量变化特征[J]. 林业科学, 2022, 58(6): 13-22. |
| [6] | 郝龙飞,刘婷岩,何永琴,张盛晰,赵媛. 菌根真菌调控灌木铁线莲根际土壤生态化学计量特征对氮沉降的应激响应[J]. 林业科学, 2022, 58(6): 151-160. |
| [7] | 张兹鹏,王君杰,刘索名,姜立春. 形率对白桦单木材积和生物量预测精度的影响[J]. 林业科学, 2022, 58(5): 31-39. |
| [8] | 李聪,吕晶花,陆梅,杨志东,刘攀,任玉连,杜凡. 文山国家级自然保护区不同海拔地带性植被的土壤微生物生物量碳氮分布特征[J]. 林业科学, 2022, 58(3): 20-30. |
| [9] | 石永磊,王志慧,李世明,李春意,肖培青,张攀,常晓格. 基于光学遥感的稀疏乔灌木地上部分生物量反演方法[J]. 林业科学, 2022, 58(2): 13-22. |
| [10] | 付晓,张煜星,王雪军. 2060年前我国森林生物量碳库及碳汇潜力预测[J]. 林业科学, 2022, 58(2): 32-41. |
| [11] | 周莎,马寰菲,王洁莹,任成杰,郭垚鑫,王俊,赵发珠. 我国森林土壤微生物生物量碳的纬度分布特征及影响因子[J]. 林业科学, 2022, 58(2): 49-57. |
| [12] | 于水今,王娟,何海燕,张春雨,赵秀海. 针阔混交林生物量稳定性驱动因子[J]. 林业科学, 2022, 58(11): 181-190. |
| [13] | 陈星京,冯林艳,张宇超,刘清旺,杨朝晖,符利勇,白晋华. 基于机载激光雷达的崇礼冬奥核心区林分地上生物量反演[J]. 林业科学, 2022, 58(10): 35-46. |
| [14] | 薛海连,田相林,曹田健. 利用经验-过程混合建模方法优化华山松过程模型的参数[J]. 林业科学, 2021, 57(9): 21-33. |
| [15] | 张维伟,赵忠,刘金良,邓平. 桥山林区3种麻栎群落类型的种群动态与幼苗特征[J]. 林业科学, 2021, 57(7): 1-10. |
| 阅读次数 | ||||||
|
全文 |
|
|||||
|
摘要 |
|
|||||