
林业科学 ›› 2026, Vol. 62 ›› Issue (6): 56-70.doi: 10.11707/j.1001-7488.LYKX20250583
高博洋1,徐健楠2,李伟克3,王明玉3,宁吉彬1,杨光1,*( )
)
收稿日期:2025-09-22
修回日期:2026-02-12
出版日期:2026-06-10
发布日期:2026-06-13
通讯作者:
杨光
E-mail:yangguang@nefu.edu.cn
基金资助:
Boyang Gao1,Jiannan Xu2,Weike Li3,Mingyu Wang3,Jibin Ning1,Guang Yang1,*()
Received:2025-09-22
Revised:2026-02-12
Online:2026-06-10
Published:2026-06-13
Contact:
Guang Yang
E-mail:yangguang@nefu.edu.cn
摘要:
目的: 全球气候变暖、极端天气频发,导致雷击火灾的规模更大、强度更高、破坏性更强。探究大兴安岭雷击火灾的时空分布及聚集性演变规律,并识别其关键驱动因素,为雷击火灾的防控和管理提供科学依据。方法: 基于2013—2024年大兴安岭雷击火灾历史数据,综合运用统计分析、二维高斯核密度分析、地理探测器等方法,分析雷击火灾的动态演化规律、空间聚集特征及关键驱动因素的解释力。结果: 1) 12年间共发生雷击火灾791次,2019年达到峰值。雷击火灾主要集中在4—10月,尤其是春季防火期和夏季生长期,最早记录为4月24日,最晚为9月19日。春季防火期结束后雷击火灾数量回落,但于7月中旬再次达到高峰。每日13:00—17:00(不含 17:00 时刻)为雷击火灾的高发时段,占总发生次数的50%以上。2) 12年间雷击火灾整体在研究区西北部呈明显聚集。逐年分析显示,聚集区呈现年度差异。采用自然断裂法将雷击火灾核密度值划分为5个风险等级,南部地区通常为极低风险区域(仅2022年出现少量雷击火灾)。Getis-Ord Gi*显著性检验显示,极高风险区具有稳定的空间聚集特征。3) 前3日平均气温、月最高气温、海拔、月平均气温、0~7 cm土层土壤湿度和归一化植被指数是各年份中解释力最强的核心驱动因素。相对湿度和月平均气温(较高解释力出现次数9次)、海拔和归一化植被指数(7次)等组合在历年数据中解释力普遍较强,表明其对雷击火灾的发生影响较为显著。此外,月平均气温、月最高气温和海拔与其他驱动因素的组合亦具有较高解释力。结论: 近年来大兴安岭雷击火灾发生整体呈波动趋势,建议在夏季(特别是午后14:00时左右)加强对重点林区的防范。12年间雷击火灾在乌玛、永安山、图强和阿木尔地区持续呈显著聚集特征,部分年份(2015和2018年)雷击火灾事件分布较散,呈随机分布特征,无显著聚集。不同类型因子的交互作用存在差异,其中气象因子之间的交互效应较为明显,在雷击火灾的发生机制中占据主导作用。本研究揭示了雷击火灾的时空演化规律及关键驱动机制,为防火决策的精细化和区域化管理提供了科学依据。
中图分类号:
高博洋,徐健楠,李伟克,王明玉,宁吉彬,杨光. 大兴安岭雷击火时空聚集性及其驱动因素[J]. 林业科学, 2026, 62(6): 56-70.
Boyang Gao,Jiannan Xu,Weike Li,Mingyu Wang,Jibin Ning,Guang Yang. Spatiotemporal Clustering of Lightning-Ignited Forest Fires in Daxing’ anling Mountains and Itʼs Driving Factors[J]. Scientia Silvae Sinicae, 2026, 62(6): 56-70.
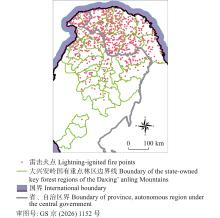
图1
2013—2024年大兴安岭雷击森林火灾空间分布"
表1
雷击火灾驱动因素及其所属类型①"
| 类型Category | 驱动因素Driving factor |
| 地形Topography | 海拔Elevation |
| 坡度Slope* | |
| 坡向Aspect* | |
| 气象Meteorological | 累计降水量Cumulative precipitation 前3日累计降水量Three-day cumulative precipitation before a lightning-ignited fire* |
| 前3日最高气温Three-day maximum temperature before a lightning-ignited fire* 前3日平均气温Three-day mean temperature before a lightning-ignited fire* 露点温度(地表以上2 m处空气达到饱和时所需冷却到的温度)Dewpoint temperature (temperature to which the air, at two meters above the surface of the earth, would have to be cooled to reach saturation) 气温(陆地、海洋或内陆水体表面以上2 m高度的气温)Temperature (temperature of air at two meters above the surface of land, sea or in-land waters.) 月平均气温Monthly mean temperature* 月最高气温Monthly maximum temperature* | |
| 0~7 cm土层土壤湿度0–7 cm soil layer soil moisture 空气相对湿度Relative air humidity*(详见公式1~3 See formula 1–3) | |
| 10 m东向风分量Eastward component of the 10 m wind 10 m北向风分量Northward component of the 10 m wind 风向Wind direction*(详见公式4 See formula 4) 风速Wind speed*(详见公式5 See formula 5) | |
| 可燃物Fuel | 归一化植被指数Normalized difference vegetation index |
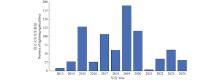
图2
大兴安岭雷击火灾历年发生数量"
图3
按季节和年份统计出的大兴安岭雷击火灾发生数量"
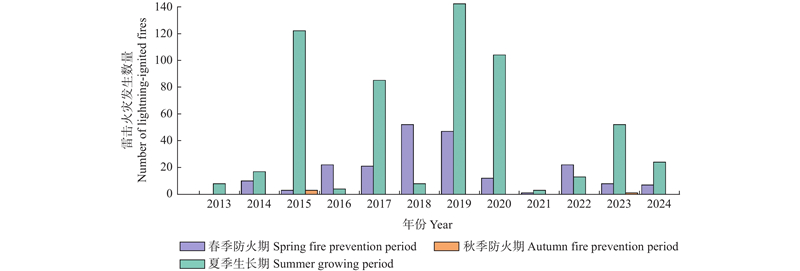
图4
按天和季节统计出的2013—2024年大兴安岭雷击火灾发生数量"
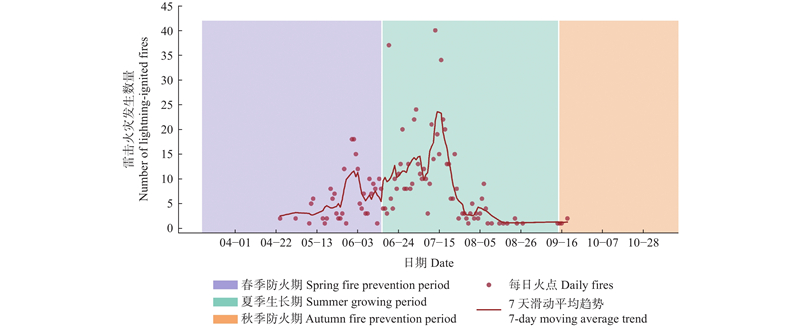
图5
2013—2024年大兴安岭雷击火灾按时段和季节统计发生数量"
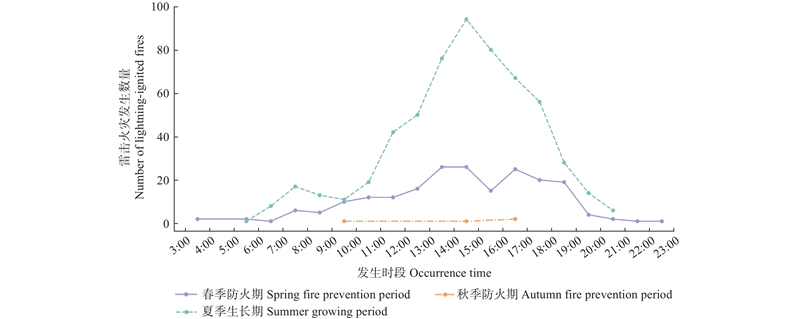
图6
2013—2024年大兴安岭雷击火灾核密度 A:雷击火核密度分布(整体) Overall kernel density distribution of lightning-ignited fires;B:雷击火核密度局部聚集区1 Local cluster area 1 of lightning-ignited fire kernel density;C:雷击火核密度局部聚集区2 Local cluster area 2 of lightning-ignited fire kernel density;D:雷击火核密度局部聚集区3 Local cluster area 3 of lightning-ignited fire kernel density"
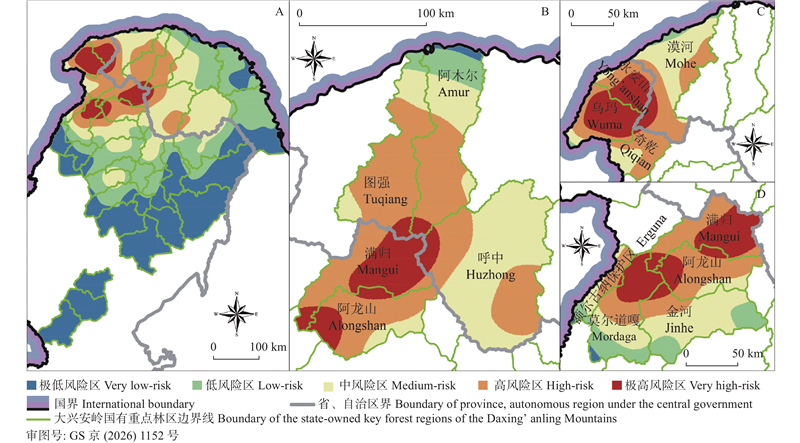
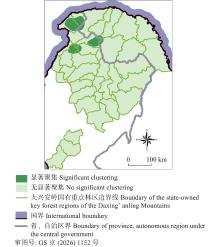
图7
2013—2024年大兴安岭雷击火灾核密度显著性分类"
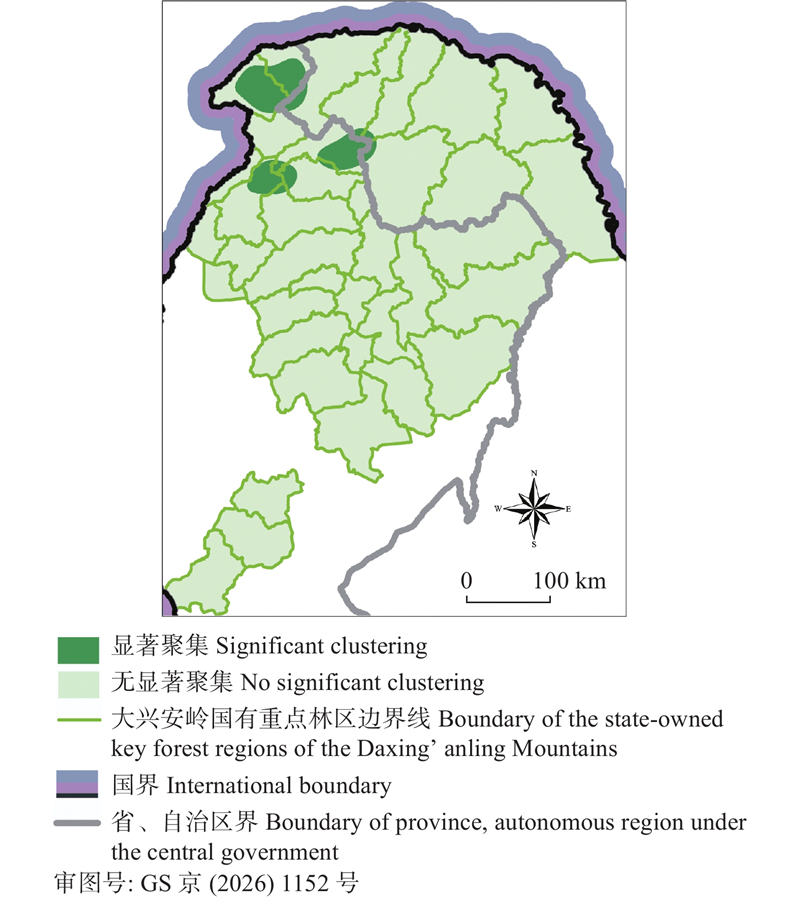
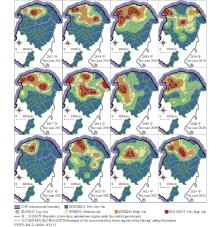
图8
2013—2024逐年大兴安岭雷击火灾核密度"
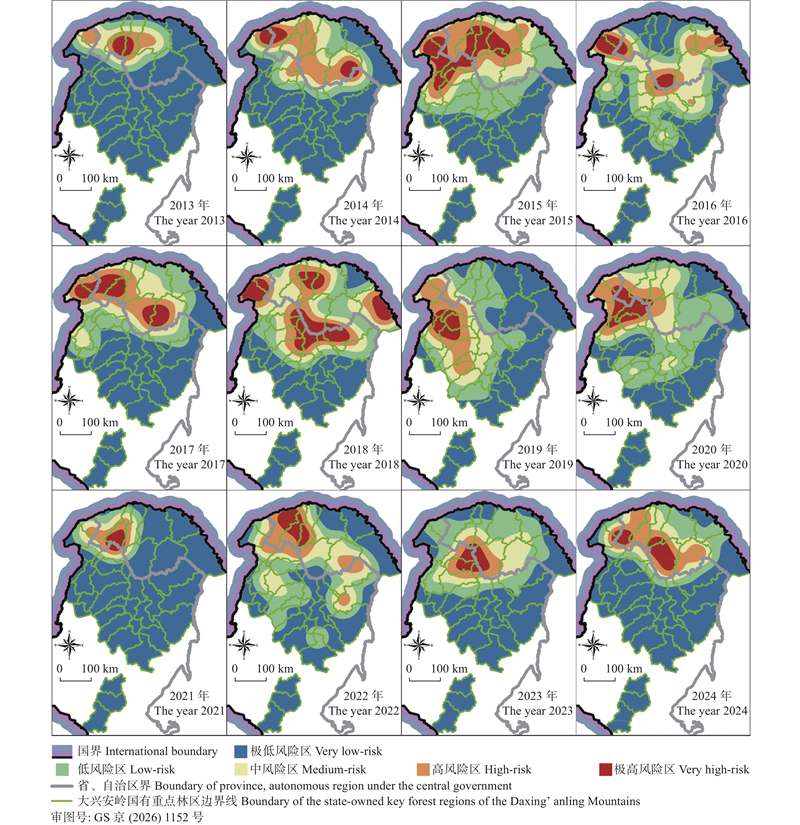
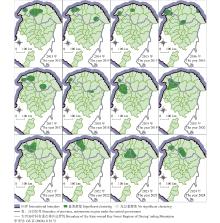
图9
2013—2024逐年大兴安岭雷击火灾核密度显著性分类"
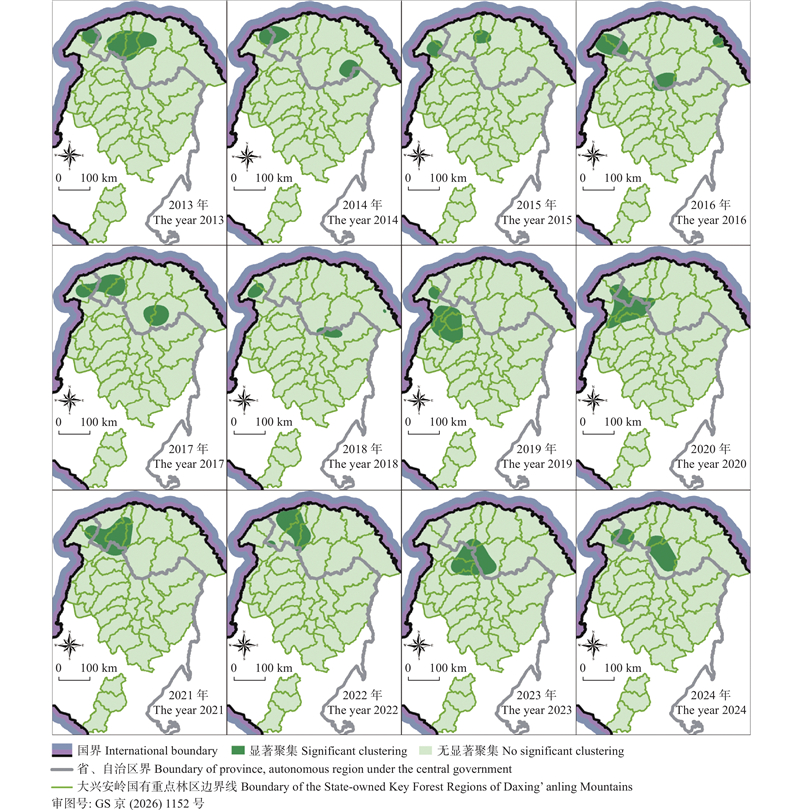
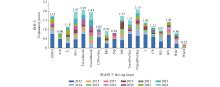
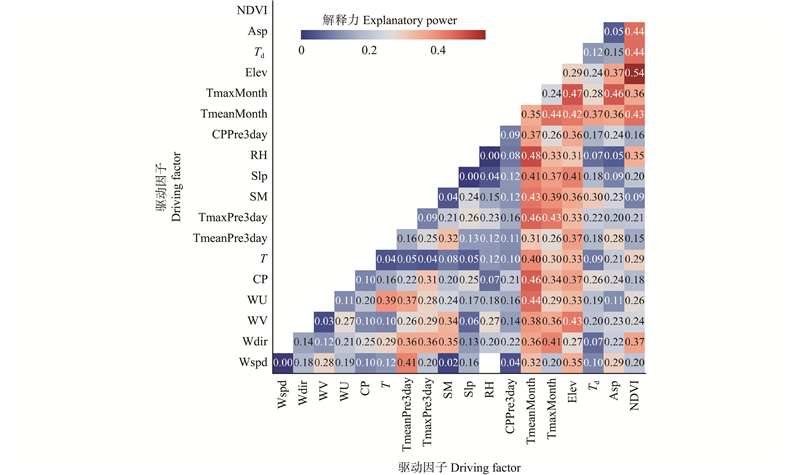
图10
2013—2024年各驱动因子对雷击火灾核密度的解释力 Wspd:风速Wind speed;Wdir:风向Wind direction;WV:10 m北向风分量Northward component of 10 m wind;WU:10 m东向风分量Eastward component of 10 m wind;CP:累计降水量Cumulative precipitation;T:气温Temperature;TmeanPre3day:前3日平均气温Three-day mean temperature before lightning-ignited fire;TmaxPre3day:前3日最高气温Three-day maximum temperature before a lightning-ignited fire;SM:0~7 cm土层土壤湿度0–7 cm soil layer soil moisture;Slp:坡度Slope;RH:空气相对湿度Relative air humidity;CPPre3day:前3日累计降水量Three-day cumulative precipitation before lightning-ignited fire;TmeanMonth:月平均气温Monthly mean temperature;TmaxMonth:月最高气温Monthly maximum temperature;Elev:海拔Elevation;Td:露点温度Dewpoint temperature;Asp:坡向Aspect;NDVI:归一化植被指数Normalized difference vegetation index."
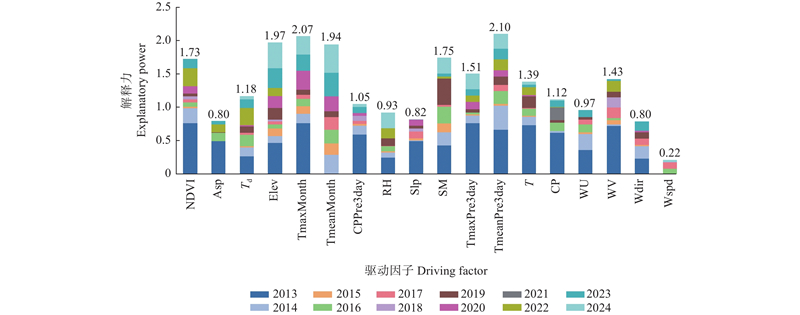

图11
雷击火灾核心驱动因子解释力的年际稳定性 TmeanPre3day:前3日平均气温Three-day mean temperature before a lightning-ignited fire;SM:0~7 cm土层土壤湿度0–7 cm soil layer soil moisture;TmeanMonth:月平均气温Monthly mean temperature;TmaxMonth:月最高气温Monthly maximum temperature;Elev:海拔Elevation;NDVI:归一化植被指数Normalized difference vegetation index."
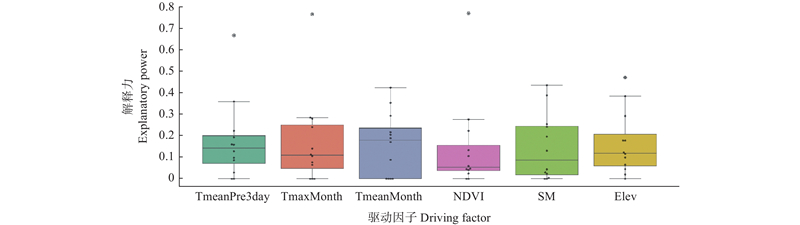
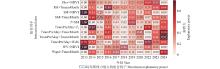
图12
双驱动因子解释力年度变化热力图(部分组合) Elev × NDVI:海拔和归一化植被指数的双因子组合Two-factor combination of elevation and normalized difference vegetation index;RH × TmeanMonth:空气相对湿度和月平均气温的双因子组合Two-factor combination of relative air humidity and monthly mean temperature;SM × NDVI:0~7 cm土层土壤湿度和归一化植被指数的双因子组合Two-factor combination of 0–7 cm soil layer soil moisture and normalized difference vegetation index;SM × TmaxMonth:0~7 cm土层土壤湿度和月最高气温的双因子组合Two-factor combination of 0–7 cm soil layer soil moisture and monthly maximum temperature;T × SM:气温和0~7 cm土层土壤湿度的双因子组合Two-factor combination of temperature and 0–7 cm soil layer soil moisture;TmaxPre3day × Td:前3日最高气温和露点温度的双因子组合Two-factor combination of three-day maximum temperature before a lightning-ignited fire and dewpoint temperature;TmaxPre3day × TmaxMonth:前3日最高气温和月最高气温的双因子组合Two-factor combination of three-day maximum temperature before a lightning-ignited fire and monthly maximum temperature;TmaxPre3day × TmeanMonth:前3日最高气温和月平均气温的双因子组合Two-factor combination of three-day maximum temperature before a lightning-ignited fire and monthly mean temperature;TmaxPre3day × Wdir:前3日最高气温和风向的双因子组合Two-factor combination of three-day maximum temperature before a lightning-ignited fire and wind direction;WV × NDVI:10 m北向风分量和归一化植被指数的双因子组合Two-factor combination of northward component of 10 m wind and normalized difference vegetation index."
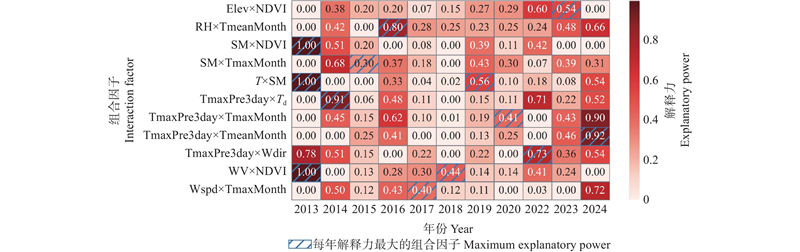
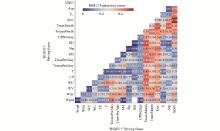
图13
2023年双因子交互解释力矩阵热力图 Wspd:风速Wind speed;Wdir:风向Wind direction;WV:10 m北向风分量Northward component of 10 m wind;WU:10 m东向风分量Eastward component of 10 m wind;CP:累计降水量Cumulative precipitation;T:气温Temperature;TmeanPre3day:前3日平均气温Three-day mean temperature before lightning-ignited fire;TmaxPre3day:前3日最高气温Three-day maximum temperature before a lightning-ignited fire;SM:0~7 cm土层土壤湿度0?7 cm soil layer soil moisture;Slp:坡度Slope;RH:空气相对湿度Relative air humidity;CPPre3day:前3日累计降水量Three-day cumulative precipitation before a lightning-ignited fire;TmeanMonth:月平均气温Monthly mean temperature;TmaxMonth:月最高气温Monthly maximum temperature;Elev:海拔Elevation;Td:露点温度Dewpoint temperature;Asp:坡向Aspect;NDVI:归一化植被指数Normalized difference vegetation index."
| 白 夜, 李 晖, 王 博, 等. 森林雷击火成因与防控对策. 林业资源管理, 2019 (6): 7- 11, 37. | |
| Bai Y, Li H, Wang B, et al. Review on causes to forests struck by lightning and countermeasures. Forest Resources Management, 2019 (6): 7- 11, 37. | |
| 陈乐奇, 徐 鑫, 孔祥宁, 等. 雷击森林火险区划模型及其在泰山林区的应用. 林业调查规划, 2024, 49 (5): 214- 220. | |
| Chen L Q, Xu X, Kong X N, et al. Forest fire risk zoning model of lightning strike and its application in Mount Taishan forest area. Forest Inventory and Planning, 2024, 49 (5): 214- 220. | |
| 冯雨林, 刘爱柱, 郭常来, 等. 大兴安岭林区雷击火成因机理及影响因素研究进展. 地质与资源, 2024, 33 (5): 701- 706. | |
| Feng Y L, Liu A Z, Guo C L, et al. Research progress on the genetic mechanism and influencing factors of lightning fire in Daxing’anling forest area. Geology and Resources, 2024, 33 (5): 701- 706. | |
| 焦强英, 韩宗甫, 王炜烨, 等. 基于多源数据和机器学习方法的大兴安岭地区雷击火驱动因子及火险预测模型. 林业科学, 2023, 59 (6): 74- 87. | |
| Jiao Q Y, Han Z F, Wang W Y, et al. Driving factors and forecasting model of lightning-caused forest fires in the Daxing’anling Mountains based on multi-sources data and machine learning method. Scientia Silvae Sinicae, 2023, 59 (6): 74- 87. | |
| 李 华. 2005. 黑龙江大兴安岭森林雷击火环境及预测预报. 北京: 中国林业科学研究院. | |
| Li H. 2005. The forecast and environment of lightning fire in daxingan mountain in Heilongjiang Province. Beijing: Chinese Academy of Forestry. [in Chinese] | |
| 李 伟, 邓凤东, 孟 珍, 等. 基于GIS加权核密度场模型的闪电热点探测与影响因素分析. 气象科技, 2025, 53 (3): 438- 447. | |
| Li W, Deng F D, Meng Z, et al. Detection and analysis of lightning hotspots and influencing factors based on GIS weighted kernel density field model. Meteorological Science and Technology, 2025, 53 (3): 438- 447. | |
| 李伟克, 舒立福, 王明玉, 等. 黑龙江大兴安岭林区雷击火与人为火发生规律及变化趋势. 林业科学, 2024, 60 (4): 136- 146. | |
| Li W K, Shu L F, Wang M Y, et al. Occurrence pattern and changing trend of lightning induced fires and human-caused fires in Daxing’anling forest region of Heilongjiang Province. Scientia Silvae Sinicae, 2024, 60 (4): 136- 146. | |
| 李 威, 舒立福, 王明玉, 等. 大兴安岭1980—2021年雷击火时空分布特征. 林业科学, 2023, 59 (10): 22- 31. | |
| Li W, Shu L F, Wang M Y, et al. Temporal and spatial distribution and dynamic characteristics of lightning fires in the Daxing’anling Mountains from 1980 to 2021. Scientia Silvae Sinicae, 2023, 59 (10): 22- 31. | |
| 李 威, 王明玉, 舒立福, 等. 2000—2022年阿尔泰山林区雷击火时空分布特征. 林业科学, 2025, 61 (4): 169- 179. | |
| Li W, Wang M Y, Shu L F, et al. Spatiotemporal distribution characteristics of lightning-caused fires in the Altai Mountains forest region from 2000 to 2022. Scientia Silvae Sinicae, 2025, 61 (4): 169- 179. | |
| 钱 勇, 邱贵强, 张华明, 等. 多源气象资料在森林雷击火辨识中的应用. 干旱气象, 2022 (3): 40. | |
| Qian Y, Qiu G Q, Zhang H M, et al. Application of multi-source meteorological data in lightning-attributed forest fire identification. Journal of Arid Meteorology, 2022 (3): 40. | |
| 孙少辉, 南海涛. 林区干雷暴及雷电监测的研究. 森林工程, 2008 (1): 16- 17. | |
| Sun S H, Nan H T. Research on dry thunderstorm and thunder monitoring in a forest area. Forest Engineering, 2008 (1): 16- 17. | |
| 舒 洋, 孙子瑜, 张 恒, 2022. 世界森林雷击火研究现状和展望. 世界林业研究, 35(2): 34−40. | |
| Shu Y, Sun Z Y, Zhang H. 2022. Research on lightning fire in forest: current status and outlook. World Forestry Research, 35(2): 34−40. [ in Chinese] | |
| 苏漳文. 2020. 基于地理信息系统的大兴安岭林火发生驱动因子及预测模型的研究. 哈尔滨: 东北林业大学. | |
| Su Z W. 2020. Study on driving factors and forecasting models of forest fire in the Great Xing’an Mountains based on geographic information System. Harbin: Northeast Forestry University. [in Chinese] | |
| 田晓瑞, 舒立福, 赵凤君, 等. 大兴安岭雷击火发生条件分析. 林业科学, 2012, 48 (7): 98- 103. | |
| Tian X R, Shu L F, Zhao F J, et al. Analysis of the conditions for lightning fire occurrence in Daxing’anling region. Scientia Silvae Sinicae, 2012, 48 (7): 98- 103. | |
| 王明玉, 苑尚博, 李 威, 等. 密集雷电引发大兴安岭群发雷击火过程及其影响因素. 林业科学, 2022, 58 (11): 10- 20. | |
| Wang M Y, Yuan S B, Li W, et al. Process and influencing factors of mass lightning fires caused by dense lightning in the Daxing’anling Mountains. Scientia Silvae Sinicae, 2022, 58 (11): 10- 20. | |
| 辛 悦, 毕力格, 包山虎, 等. 基于CloudSat-CALIPSO数据的大兴安岭地区云宏微观物理量的垂直结构特征分析. 气象, 2023, 49 (4): 427- 438. | |
| Xin Y, Bilig, Bao S H, et al. Vertical structure characteristics of cloud macro and micro physical quantities in the Greater Khingan Mountains based on CloudSat-CALIPSO satellite data. Meteorological Monthly, 2023, 49 (4): 427- 438. | |
| 杨淑香, 吴宏伟, 董 越, 等. 内蒙古大兴安岭森林火险等级预报模型研究. 林业调查规划, 2024, 49 (2): 19- 24. | |
| Yang S X, Wu H W, Dong Y, et al. Prediction model of forest fire risk level in Greater Khingan Mountains of Inner Mongolia. Forest Inventory and Planning, 2024, 49 (2): 19- 24. | |
| 臧桐汝, 舒立福, 王明玉, 等. 黑龙江大兴安岭林区雷击火时空分布及驱动因素分析. 西北农林科技大学学报(自然科学版), 2022, 50 (12): 64- 76. | |
| Zang T R, Shu L F, Wang M Y, et al. Analysis of spatial and temporal distribution and driving factors of lightning-caused fires in Daxing’anling forest region of Heilongjiang. Journal of Northwest A & F University (Natural Science Edition), 2022, 50 (12): 64- 76. | |
| 张 浩, 陈 倩, 刘群山, 等. 木里县境内雅砻江流域林区雷电活动的时空特征分析. 农业灾害研究, 2025, 15 (5): 257- 259. | |
| Zhang H, Chen Q, Liu Q S, et al. Spatiotemporal characteristics of lightning activities in the Yalong River Basin of Muli County. Journal of Agricultural Catastrophology, 2025, 15 (5): 257- 259. | |
| 张念慈, 刘 迪, 刘广菊. 大兴安岭地区森林雷击火灾爆发机理与风险评估研究. 森林防火, 2023, 41 (4): 16- 20. | |
| Zhang N C, Liu D, Liu G J. Study on the mechanism and risk assessment of forest lightning fire outbreak in the Greater Khingan Mountains region. Journal of Wildland Fire Science, 2023, 41 (4): 16- 20. | |
| 张岐岳. 2023. 内蒙古大兴安岭北部林火干扰对冻土和植被的影响. 呼和浩特: 内蒙古农业大学. | |
| Zhang Q Y. 2023. The impact of forest fire disturbance on permafrost and vegetation in the Northern Great Xing’an Mountains of Inner Mongolia. Hohhot: Inner Mongolia Agricultural University [in Chinese] | |
| 张雨桐, 凌成星, 刘 华, 等. 基于RSEI模型的大兴安岭区生态质量动态监测与评价. 遥感技术与应用, 2025, 40 (2): 359- 367. | |
| Zhang Y T, Ling C X, Liu H, et al. Dynamic monitoring and evaluation of ecological quality in Daxing’anling district based on RSEI model. Remote Sensing Technology and Application, 2025, 40 (2): 359- 367. | |
| 周长明, 陈 亮, 陆明明, 等. 高纬度林区干雷暴与雷击火时空分布特征及其相关分析. 广西林业科学, 2022, 51 (4): 520- 526. | |
| Zhou C M, Chen L, Lu M M, et al. Temporal and spatial distribution characteristics of dry thunderstorm and lightning fire and their correlation in high latitude forest area. Guangxi Forestry Science, 2022, 51 (4): 520- 526. | |
| 周 庆. 2023. 内蒙古大兴安岭森林火灾发生空间格局与驱动因素研究. 呼和浩特: 内蒙古农业大学. | |
| Zhou Q. 2023. Spatial patterns and drivers of forest fire occurrence in the Daxing’an mountains of Inner Mongolia. Hohhot: Inner Mongolia Agricultural University. [in Chinese] | |
| 周 庆, 张 恒, 赵鹏武, 等. 内蒙古大兴安岭林火发生概率及驱动因素在1987年森林大火重大历史事件前后的差异. 林业科学, 2024, 60 (7): 81- 94. | |
| Zhou Q, Zhang H, Zhao P W, et al. Differences in the probability and drivers of forest fires in the Daxing’an Mountains of Inner Mongolia before and after the major historical event of the forest fire in 1987. Scientia Silvae Sinicae, 2024, 60 (7): 81- 94. | |
|
Abatzoglou J T, Kolden C A, Cullen A C, et al. Climate change has increased the odds of extreme regional forest fire years globally. Nature Communications, 2025, 16, 6390.
doi: 10.1038/s41467-025-61608-1 |
|
|
Abatzoglou J T, Williams A P. Impact of anthropogenic climate change on wildfire across western US forests. PNAS, 2016, 113 (42): 11770- 11775.
doi: 10.1073/pnas.1607171113 |
|
|
Clarke H, Gibson R, Cirulis B, et al. Developing and testing models of the drivers of anthropogenic and lightning-caused wildfire ignitions in south-eastern Australia. Journal of Environmental Management, 2019, 235, 34- 41.
doi: 10.1016/j.jenvman.2019.01.055 |
|
|
Coogan S C P, Aftergood O, Flannigan M D. Human and lightning-caused wildland fire ignition clusters in British Columbia, Canada. International Journal of Wildland Fire, 2022, 31 (11): 1043- 1055.
doi: 10.1071/WF21177 |
|
|
Ellis T M, Bowman D M J S, Williamson G J. Human activity augments lightning ignitions to reshape fire seasonality across all biomes on Earth. Nature Ecology & Evolution, 2025, 9 (11): 2069- 2079.
doi: 10.1038/s41559-025-02862-w |
|
|
Gallo C, Dieppois B, Quilcaille Y, et al. Future impacts of climate change on global fire weather: insight from weighted CMIP6 multimodel ensembles. Journal of Climate, 2025, 38 (22): 6445- 6462.
doi: 10.1175/JCLI-D-24-0540.1 |
|
|
Gao C, Shi C M, Li J B, et al. Igniting lightning, wildfire occurrence, and precipitation in the boreal forest of Northeast China. Agricultural and Forest Meteorology, 2024, 354, 110081.
doi: 10.1016/j.agrformet.2024.110081 |
|
|
Hu T Y, Zhou G S. Drivers of lightning- and human-caused fire regimes in the Great Xing’an Mountains. Forest Ecology and Management, 2014, 329, 49- 58.
doi: 10.1016/j.foreco.2014.05.047 |
|
|
Johnson S D, Balice R G. Seasons within the wildfire season: marking weather-related fire occurrence regimes. Fire Ecology, 2006, 2 (2): 60- 78.
doi: 10.4996/fireecology.0202060 |
|
|
Kelley D, Burton C, Giuseppe F, et al. State of wildfires 2024—2025. Earth System Science Data, 2025, 17 (10): 5377- 5488.
doi: 10.5194/essd-17-5377-2025 |
|
|
Larjavaara M, Kuuluvainen T, Rita H. Spatial distribution of lightning-ignited forest fires in Finland. Forest Ecology and Management, 2005, 208 (1): 177- 188.
doi: 10.1016/j.foreco.2004.12.005 |
|
|
Li G L, Hai J Y, Qiu J Z, et al. Revealing future changes in China’s forest fire under climate change. Agricultural and Forest Meteorology, 2025, 371, 110609.
doi: 10.1016/j.agrformet.2025.110609 |
|
|
Li M L, Wu Y D, Liu Y L, et al. Study on the driving factors of the spatiotemporal pattern in forest lightning fires and 3D fire simulation based on cellular automata. Forests, 2024, 15 (11): 1857.
doi: 10.3390/f15111857 |
|
|
MacNamara B R, Schultz C J, Fuelberg H E. Flash characteristics and precipitation metrics of western U. S. lightning-initiated wildfires from 2017. Fire, 2020, 3 (1): 5.
doi: 10.3390/fire3010005 |
|
|
Mandal J, Chatterjee C, Das S. An explainable machine learning technique to forecast lightning density over north-eastern India. Journal of Atmospheric and Solar-Terrestrial Physics, 2024, 259, 106255.
doi: 10.1016/j.jastp.2024.106255 |
|
| Mu M, Randerson J T, van der Werf G R, et al. 2011,. Daily and 3-hourly variability in global fire emissions and consequences for atmospheric model predictions of carbon monoxide: daily and hourly global fire emissions. Journal of Geophysical Research: Atmospheres, 116(D24): D24303:1−D24303:19. | |
|
Panagos P, Ballabio C, Meusburger K, et al. Towards estimates of future rainfall erosivity in Europe based on REDES and WorldClim datasets. Journal of Hydrology, 2017, 548, 251- 262.
doi: 10.1016/j.jhydrol.2017.03.006 |
|
|
Podur J, Martell D L, Csillag F. Spatial patterns of lightning-caused forest fires in Ontario, 1976—1998. Ecological Modelling, 2003, 164 (1): 1- 20.
doi: 10.1016/s0304-3800(02)00386-1 |
|
|
Song S D, Zhou X, Yuan S B, et al. Interpretable artificial intelligence models for predicting lightning prone to inducing forest fires. Journal of Atmospheric and Solar-Terrestrial Physics, 2025, 267, 106408.
doi: 10.1016/j.jastp.2024.106408 |
|
|
Wang Z, Huang J G, Ryzhkova N, et al. 352 years long fire history of a Siberian boreal forest and its primary driving factor. Global and Planetary Change, 2021, 207, 103653.
doi: 10.1016/j.gloplacha.2021.103653 |
|
|
Wang Z L, He B B, Chen R, et al. Improving wildfire danger assessment using time series features of weather and fuel in the Great Xing’an Mountain Region, China. Forests, 2023, 14 (5): 986.
doi: 10.3390/f14050986 |
|
| Wendel J. 2014. Lightning strikes predicted to increase as climate warms. Eos, Transactions American Geophysical Union, 95(47): 431. | |
|
Westermayer A T, Groenemeijer P, Pistotnik G, et al. Identification of favorable environments for thunderstorms in reanalysis data. Meteorologische Zeitschrift, 2017, 26 (1): 59- 70.
doi: 10.1127/metz/2016/0754 |
|
|
Zhang Q Y, Homayouni S, Yao H X, et al. Joint analysis of lightning-induced forest fire and surface influence factors in the Great Xing’an range. Forests, 2022, 13 (11): 1867.
doi: 10.3390/f13111867 |
|
|
Zhang Z J, Tian Y, Wang G Y, et al. A forest fire prediction method for lightning stroke based on remote sensing data. Forests, 2024, 15 (4): 647.
doi: 10.3390/f15040647 |
|
|
Zhen S, Zhang J Y, Zhang Z X, et al. Identifying the density of grassland fire points with kernel density estimation based on spatial distribution characteristics. Open Geosciences, 2021, 13 (1): 796- 806.
doi: 10.1515/geo-2020-0265 |
| [1] | 郑群,李亦璞,苏中原,郑永林,王云琦. 酸沉降加剧土地利用变化对三峡库区重庆段土壤保持时空异质性的影响[J]. 林业科学, 2026, 62(5): 40-53. |
| [2] | 宗学政,田晓瑞,崔文彬,舒立福,王明玉. 基于大兴安岭季节性火灾风险动态调整地面临时扑救基地[J]. 林业科学, 2026, 62(4): 154-163. |
| [3] | 王凯波,金光泽,刘志理. 温带阔叶树种不同生活史阶段的资源获取能力和防御能力关系的变化[J]. 林业科学, 2025, 61(8): 219-230. |
| [4] | 徐彩瑶,王朝勇,穆亚丽,孔凡斌,廖文梅. 中国林业经济韧性非均衡性及其影响因素[J]. 林业科学, 2025, 61(4): 196-214. |
| [5] | 周庆,张恒,赵鹏武,周勇,章林,弥宏卓,王嘉夫,赵梦玉,杨泽华. 内蒙古大兴安岭林火发生概率及驱动因素在1987年森林大火重大历史事件前后的差异[J]. 林业科学, 2024, 60(7): 81-94. |
| [6] | 张翱,李文婷,王天祥,武耀星,雷刚,漆良华. 毛竹林土壤易氧化有机碳区域分异及影响因素[J]. 林业科学, 2024, 60(6): 1-12. |
| [7] | 李伟克,舒立福,王明玉,李威,司莉青,赵凤君,李笑笑,周暖阳. 黑龙江大兴安岭林区雷击火与人为火发生规律及变化趋势[J]. 林业科学, 2024, 60(4): 136-146. |
| [8] | 孙忠秋,叶昕. 基于风云四号静止气象卫星数据的大兴安岭林区近地表气温遥感估算[J]. 林业科学, 2024, 60(12): 27-34. |
| [9] | 李威,舒立福,王明玉,李伟克,苑尚博,司莉青,赵凤君,宋佳军,王亚惠. 大兴安岭1980—2021年雷击火时空分布特征[J]. 林业科学, 2023, 59(10): 22-31. |
| [10] | 胡同欣,杨艺璇,孙龙,高传宇. 兴安落叶松林和白桦林下种植大球盖菇对枯落物层燃烧性的影响[J]. 林业科学, 2022, 58(7): 32-42. |
| [11] | 李伟克,舒立福,苑尚博,宋佳军,李威,司莉青,赵凤君,王亚惠,王明玉. 基于VLF/LF三维闪电定位系统的大兴安岭闪电时空分布特征[J]. 林业科学, 2022, 58(11): 21-30. |
| [12] | VuongThi Minh Dien,曾健勇,满秀玲. 樟子松天然林土壤碳氮含量与水解酶活性坡位差异及月动态[J]. 林业科学, 2020, 56(2): 40-47. |
| [13] | 丁令智, 满秀玲, 肖瑞晗, 蔡体久. 寒温带森林根际土壤微生物量碳氮含量生长季内动态变化[J]. 林业科学, 2019, 55(7): 178-186. |
| [14] | 林元震. 林木基因型与环境互作的研究方法及其应用[J]. 林业科学, 2019, 55(5): 142-151. |
| [15] | 张凌宇, 刘兆刚. 基于地理加权回归模型的大兴安岭中部天然次生林更新分布[J]. 林业科学, 2019, 55(11): 105-116. |
| 阅读次数 | ||||||
|
全文 |
|
|||||
|
摘要 |
|
|||||