
林业科学 ›› 2023, Vol. 59 ›› Issue (12): 87-104.doi: 10.11707/j.1001-7488.LYKX20220837
解雅麟1,雷相东2,*,曾伟生3
收稿日期:2022-11-26
出版日期:2023-12-25
发布日期:2024-01-08
通讯作者:
雷相东
基金资助:Yalin Xie1,Xiangdong Lei2,*,Weisheng Zeng3
Received:2022-11-26
Online:2023-12-25
Published:2024-01-08
Contact:
Xiangdong Lei
摘要:
目的: 编制落叶松人工林生长过程表,为落叶松人工林经营管理提供科学依据。方法: 以我国东北华北七省(市、区)——北京市、河北省、山西省、辽宁省、吉林省、黑龙江省和内蒙古自治区落叶松人工林为研究对象,基于第5~8次全国森林资源连续清查552块固定样地数据和气象数据,运用3-PGmix过程模型编制落叶松人工林不同立地等级生长过程表。结果: 通过校验得到4种落叶松人工林3-PGmix过程模型参数,林分各变量模型预测值与实测值一致性较高(R2在0.71~0.96之间),兴安落叶松、长白落叶松、华北落叶松和日本落叶松林分蓄积量的平均误差分别为5.70%、0.95%、4.70%和?4.56%,均方根误差分别为14.88、12.00、16.74和13.11 m3·hm?2。编制的林分生长过程表能够描述林分平均胸径、平均高、株数密度、公顷蓄积量、公顷生物量以及蓄积量和生物量的公顷年均生长量和连年生长量等随林龄增加的动态变化规律,4种落叶松人工林生长过程存在差异,其原因是适生条件、物候期、生长期等生物学特性不同所致,结果具有一定的统计可靠性和生物合理性。结论: 3-PGmix过程模型模拟结果可用于编制落叶松人工林生长过程表,为生长过程表的编制提供一种新的方法。
中图分类号:
解雅麟,雷相东,曾伟生. 基于3-PGmix过程模型的落叶松人工林生长过程表编制[J]. 林业科学, 2023, 59(12): 87-104.
Yalin Xie,Xiangdong Lei,Weisheng Zeng. Compilation of Growth and Yield Table for Larch Plantations Based on 3-PGmix Model[J]. Scientia Silvae Sinicae, 2023, 59(12): 87-104.
表1
各树种落叶松人工林样地林分因子统计量①"
| 林分因子 Stand variables | 统计指标 Indicators | 长白落叶松 Larix olgensis | 兴安落叶松 Larix gmelinii | 华北落叶松 Larix principis-rupprechtii | 日本落叶松 Larix kaempferi |
| 平均胸径 Mean DBH/cm | 区间Range | 5.0~29.1 | 5.0~32.5 | 5.2~26.2 | 5.5~27.3 |
| 平均值Mean | 12.8 (4.7) | 10.6 (4.7) | 11.3 (4.1) | 13.3 (4.8) | |
| 平均树高 Mean height/m | 区间Range | 4.1~24.0 | 3.3~22.8 | 3.2~17.4 | 4.0~23.5 |
| 平均值Mean | 12.0 (4.0) | 11.0 (4.0) | 8.5 (2.7) | 12.7 (4.7) | |
| 株数密度 Stem density/(trees·hm?2) | 区间Range | 217~3267 | 200~3150 | 210~3169 | 288~3122 |
| 平均值Mean | 1116 (607) | 1051 (637) | 1185 (644) | 1217 (700) | |
| 公顷蓄积量 Stand volume/(m3·hm?2) | 区间Range | 10.15~231.81 | 10.15~226.38 | 10.01~222.78 | 10.45~282.25 |
| 平均值Mean | 86.55 (51.37) | 57.56 (42.24) | 60.77 (48.60) | 88.99 (58.81) | |
| 总公顷生物量 Total stand biomass/(t·hm?2) | 区间Range | 8.15~169.30 | 8.04~172.89 | 8.03~177.49 | 8.26~162.13 |
| 平均值Mean | 56.65 (33.21) | 41.66 (30.52) | 47.38 (39.01) | 53.85 (30.95) | |
| 林龄 Stand age/a | 区间Range | 7~52 | 6~52 | 6~60 | 8~41 |
| 平均值Mean | 26 (10) | 25 (9) | 26 (9) | 22 (7) | |
| 净初级生产力 Net primary productivity/(t·hm?2a?1) | 区间Range | 1.74~14.26 | 1.03~12.00 | 1.36~12.66 | 2.23~15.33 |
| 平均值Mean | 7.96 (2.28) | 6.42 (2.40) | 6.33 (2.38) | 8.87 (2.70) |
表2
各落叶松树种立地等级划分及立地指数范围"
| 树种Tree species | 立地等级 Site level | 地位指数范围 Site index(SI) |
| 日本落叶松 Larix kaempferi | Ⅰ | 13.64 ≤ SI < 16.83 |
| Ⅱ | 11.50 ≤ SI < 13.64 | |
| Ⅲ | 8.26 ≤ SI < 11.50 | |
| Ⅳ | 4.40 ≤ SI < 8.26 | |
| 华北落叶松 Larix principis-rupprechtii | Ⅰ | 9.02 ≤ SI < 13.14 |
| Ⅱ | 7.37 ≤ SI < 9.02 | |
| Ⅲ | 6.08 ≤ SI < 7.37 | |
| Ⅳ | 3.15 ≤ SI < 6.08 | |
| 兴安落叶松 Larix gmelinii | Ⅰ | 11.17 ≤ SI < 20.08 |
| Ⅱ | 9.03 ≤ SI < 11.17 | |
| Ⅲ | 7.68 ≤ SI < 9.03 | |
| Ⅳ | 2.49 ≤ SI < 7.68 | |
| 长白落叶松 Larix olgensis | Ⅰ | 12.76 ≤ SI < 18.23 |
| Ⅱ | 10.00 ≤ SI < 12.76 | |
| Ⅲ | 8.21 ≤ SI < 10.00 | |
| Ⅳ | 3.06 ≤ SI < 8.21 |
表3
落叶松人工林3-PGmix模型参数"
| 参数Parameters | 符号Symbol | 单位Unit | 确定方法Methods |
| 当胸径为2 cm时的叶干质量比Foliage∶stem partitioning ratio @ D=2 cm | p2 | — | 拟合Fitted |
| 当胸径为20 cm时的叶干质量比Foliage∶stem partitioning ratio @ D=20 cm | p20 | — | 拟合Fitted |
| 干质量与胸径的关系常数Constant in the stem mass v. diam. relationship | aS | — | 拟合Fitted |
| 干质量与胸径的幂指数Power in the stem mass v. diam. relationship | nS | — | 拟合Fitted |
| NPP分配到根的最大比例Maximum fraction of NPP to roots | ηRx | — | 拟合Fitted |
| NPP分配到根的最小比例Minimum fraction of NPP to roots | ηRn | — | 拟合Fitted |
| 最大叶凋落速率Maximum litterfall rate | γFx | month?1 | 拟合Fitted |
| 叶凋落速率达1/2时林龄Age at which litterfall rate has median value | tγF | month | Xie et al. 2017 |
| 月均根周转率Average monthly root turnover rate | γR | month?1 | 优化Adjust |
| 叶子长出月If deciduous, leaves are produced at end of this month | leafP | month | 王战,1992 |
| 叶子脱落月If deciduous, leaves all fall at start of this month | leafL | month | 王战,1992 |
| 生长最低温度Minimum temperature for growth | Tmin | ℃ | 王战,1992 |
| 生长最适温度Optimum temperature for growth | Topt | ℃ | 王战,1992 |
| 生长最高温度Maximum temperature for growth | Tmax | ℃ | 王战,1992 |
| 最大林龄Maximum stand age used in age modifier | tx | a | Xie et al.2020a; 2020b |
| 林龄最大时死亡率Mortality rate for large age | γNx | %·a?1 | 拟合Fitted |
| 死亡率达到1/2时林龄Age at which mortality rate has median value | tγN | a | 拟合Fitted |
| 死亡率响应指数Shape of mortality response | nγN | — | 拟合Fitted |
| 当林分密度为1 000 株·hm?2时单株最大干质量Max. stem mass per tree @ 1 000 trees·hm?2 | wSx1 000 | kg·tree?1 | 实测Observed |
| 初期比叶面积Specific leaf area at age 0 | σ0 | m2·kg?1 | 实测Observed |
| 冠层量子效率Canopy quantum efficiency | αCx | mol·mol?1 | 优化Adjust |
| 茎高关系常数Constant in the stem height relationship | aH | — | 拟合Fitted |
| 胸径在茎高关系中的幂指数Power of DBH in the stem height relationship | nHB | — | 拟合Fitted |
| 竞争在茎高关系中的幂指数Power of competition in the stem height relationship | nHC | — | 拟合Fitted |
| 材积关系常数Constant in the stem volume relationship | aV | — | 拟合Fitted |
| 胸径在材积关系中的幂指数Power of DBH in the stem volume relationship | nVB | — | 拟合Fitted |
| 胸径的平方及树高在材积关系中的幂指数 Power of DBH2 and height in the stem volume relationship | nVH | — | 拟合Fitted |
| 胸径的平方×树高在材积关系中的幂指数 Power of DBH2×height in the stem volume relationship | nVBH | — | 拟合Fitted |
表4
各林分因子实测值与3-PGmix模型预测值的校准和验证"
| 林分因子 Stand factor | 统计量 Statistic | 校准 Calibration | 验证 Validation | |||||||
| 长白落叶松Larix olgensis | 兴安落叶松Larix gmelinii | 华北落叶松 Larix principis-rupprechtii | 日本落叶松Larix kaempferi | 长白落叶松Larix olgensis | 兴安落叶松Larix gmelinii | 华北落叶松 Larix principis-rupprechtii | 日本落叶松Larix kaempferi | |||
| 林分平均高 Average height | R2 | 0.84 | 0.82 | 0.74 | 0.94 | 0.76 | 0.79 | 0.71 | 0.90 | |
| MAE/m | 1.17 | 1.49 | 1.08 | 1.04 | 1.43 | 1.61 | 1.22 | 1.21 | ||
| MRE(%) | 1.69 | 7.64 | ?2.08 | 3.60 | 0.32 | 0.30 | ?1.93 | ?3.92 | ||
| RMSE/m | 1.60 | 1.91 | 1.34 | 1.24 | 1.93 | 2.03 | 1.46 | 1.51 | ||
| RRMSE(%) | 14.27 | 19.09 | 17.15 | 11.57 | 14.32 | 16.98 | 15.28 | 9.07 | ||
| 林分平均胸径 Average DBH | R2 | 0.84 | 0.89 | 0.78 | 0.93 | 0.79 | 0.88 | 0.73 | 0.90 | |
| MAE/cm | 2.65 | 1.80 | 1.97 | 1.36 | 2.33 | 1.54 | 2.03 | 1.82 | ||
| MRE(%) | 20.85 | 17.25 | 7.25 | 3.18 | 11.91 | 6.90 | ?4.52 | ?7.14 | ||
| RMSE/cm | 3.18 | 2.18 | 2.83 | 1.65 | 2.94 | 1.97 | 3.58 | 2.50 | ||
| RRMSE(%) | 26.90 | 24.69 | 27.62 | 15.73 | 20.52 | 17.85 | 28.17 | 14.76 | ||
| 林分公顷 蓄积量 Stand volume | R2 | 0.93 | 0.93 | 0.92 | 0.96 | 0.94 | 0.91 | 0.91 | 0.95 | |
| MAE/(m3·hm?2) | 12.03 | 7.02 | 7.65 | 8.61 | 7.73 | 9.18 | 10.54 | 10.34 | ||
| MRE(%) | 13.53 | 11.04 | 2.06 | 8.49 | 0.95 | 5.70 | 4.70 | ?4.56 | ||
| RMSE/(m3·hm?2) | 17.07 | 10.62 | 12.43 | 11.44 | 12.00 | 14.88 | 16.74 | 13.11 | ||
| RRMSE(%) | 21.88 | 28.54 | 26.96 | 17.71 | 12.55 | 27.02 | 25.32 | 10.01 | ||
| 叶公顷生物量 Foliage biomass | R2 | 0.85 | 0.78 | 0.78 | 0.91 | 0.77 | 0.84 | 0.70 | 0.90 | |
| MAE/(t·hm?2) | 0.45 | 0.40 | 0.52 | 0.28 | 0.39 | 0.42 | 0.65 | 0.29 | ||
| MRE(%) | ?11.45 | 1.68 | ?5.57 | ?3.74 | ?4.09 | 11.75 | 12.91 | 5.11 | ||
| RMSE/(t·hm?2) | 0.59 | 0.54 | 0.70 | 0.37 | 0.56 | 0.61 | 1.01 | 0.34 | ||
| RRMSE(%) | 23.96 | 28.68 | 32.61 | 13.05 | 17.76 | 31.04 | 40.58 | 11.51 | ||
| 干公顷生物量 Stem biomass | R2 | 0.86 | 0.92 | 0.93 | 0.95 | 0.80 | 0.93 | 0.94 | 0.94 | |
| MAE/(t·hm?2) | 5.92 | 4.03 | 5.67 | 2.82 | 7.13 | 4.17 | 6.58 | 3.54 | ||
| MRE(%) | 23.92 | 15.17 | 15.16 | 10.27 | 20.25 | 13.95 | 15.04 | 5.96 | ||
| RMSE/(t·hm?2) | 7.85 | 6.03 | 8.50 | 3.62 | 10.03 | 6.74 | 10.21 | 5.26 | ||
| RRMSE(%) | 34.78 | 32.84 | 32.23 | 16.64 | 33.45 | 27.29 | 27.41 | 13.82 | ||
| 根公顷生物量 Root biomass | R2 | 0.91 | 0.91 | 0.94 | 0.94 | 0.89 | 0.93 | 0.92 | 0.95 | |
| MAE/(t·hm?2) | 3.57 | 1.90 | 1.54 | 2.28 | 3.83 | 2.24 | 2.05 | 2.29 | ||
| MRE(%) | 10.56 | ?0.78 | ?8.11 | ?9.44 | 6.07 | 11.24 | 9.16 | 1.74 | ||
| RMSE/(t·hm?2) | 5.19 | 2.73 | 2.21 | 2.92 | 5.87 | 3.55 | 3.08 | 2.84 | ||
| RRMSE(%) | 21.82 | 25.44 | 23.42 | 17.44 | 17.79 | 26.40 | 25.08 | 9.76 | ||
| 总公顷生物量 Total biomass | R2 | 0.90 | 0.94 | 0.95 | 0.97 | 0.87 | 0.96 | 0.95 | 0.96 | |
| MAE/(t·hm?2) | 9.74 | 4.62 | 5.73 | 3.86 | 10.85 | 6.04 | 8.54 | 6.24 | ||
| MRE(%) | 19.08 | 8.78 | 8.28 | 4.40 | 15.55 | 12.90 | 13.86 | 6.78 | ||
| RMSE/(t·hm?2) | 13.68 | 7.33 | 9.07 | 5.45 | 15.65 | 9.57 | 13.25 | 7.91 | ||
| RRMSE(%) | 28.02 | 23.69 | 23.88 | 12.76 | 23.65 | 23.86 | 25.39 | 10.96 | ||
| 株数密度 Stem density | R2 | 0.78 | 0.91 | 0.75 | 0.93 | 0.76 | 0.81 | 0.77 | 0.84 | |
| MAE/(trees·hm?2) | 247.02 | 84.77 | 186.02 | 153.54 | 183.11 | 78.73 | 210.26 | 106.62 | ||
| MRE(%) | ?11.00 | 5.55 | 9.82 | ?7.04 | ?7.30 | 5.65 | 19.80 | ?3.20 | ||
| RMSE/(trees·hm?2) | 348.02 | 237.93 | 367.87 | 218.21 | 278.26 | 237.18 | 354.61 | 153.79 | ||
| RRMSE(%) | 29.01 | 20.81 | 29.61 | 15.99 | 29.98 | 32.07 | 36.31 | 19.83 | ||
| 净初级生产力 Net primary productivity | R2 | 0.80 | 0.80 | 0.82 | 0.87 | 0.73 | 0.86 | 0.86 | 0.84 | |
| MAE/(t·hm?2a?1) | 1.11 | 1.69 | 1.64 | 1.24 | 0.93 | 1.40 | 1.19 | 1.02 | ||
| MRE(%) | ?4.12 | ?23.04 | ?23.53 | ?10.28 | ?7.21 | ?19.03 | ?14.59 | ?7.10 | ||
| RMSE/(t·hm?2a?1) | 1.55 | 2.26 | 2.16 | 1.76 | 1.44 | 1.95 | 1.55 | 1.56 | ||
| RRMSE(%) | 20.57 | 37.93 | 35.81 | 19.98 | 16.85 | 32.62 | 24.85 | 17.33 | ||
图1
αCx参数值变化对模型输出的影响"
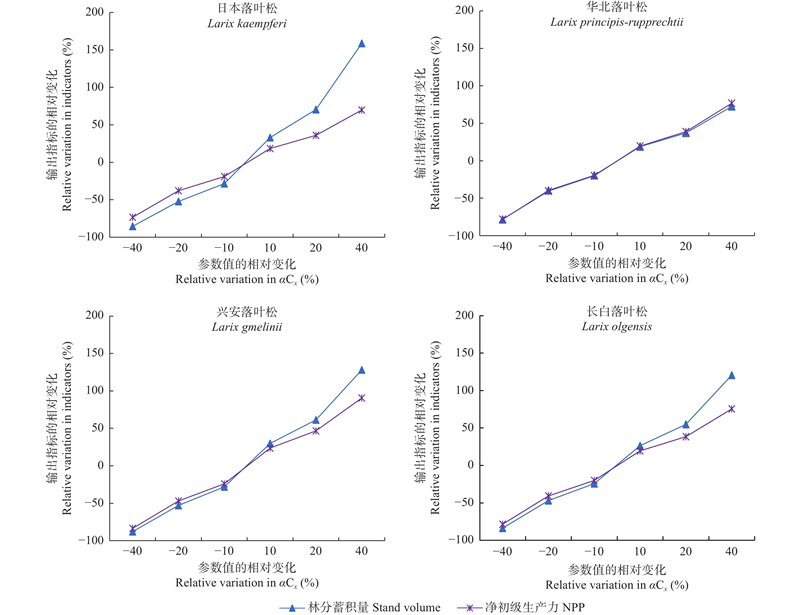

图2
γFx参数值变化对模型输出的影响"
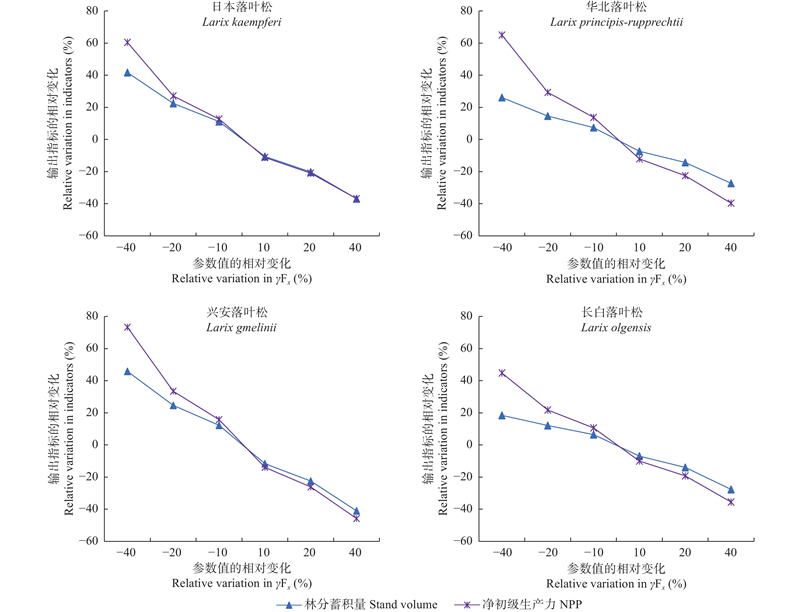
表5
基于3-PGmix过程模型的华北落叶松生长过程表"
| 林龄 Stand age/a | 立地等级Site level | ||||||||||||||||||||||
| Ⅰ(9.02 ≤ SI < 13.51, n=35) | Ⅱ(7.37 ≤ SI < 9.02, n=35) | ||||||||||||||||||||||
| 胸径 Diameter at breast height/cm | 树高 Height/ m | 株数 The number of trees/ (tree·hm?2) | 林分公顷蓄积 Stand volume/ (m3·hm?2) | 年均生长量 Mean annual increment of stand volume/ (m3·hm?2a?1) | 连年生长量 Current annual increment of stand volume/ (m3·hm?2a?1) | 公顷生 物量Biomass/ (t·hm?2) | 年均生长量Mean annual increment of biomass/ (t·hm?2a?1) | 连年生长量Current annual increment of biomass/ (t·hm?2a?1) | 枯死株数Number of dead trees/ (tree·hm?2) | 净初级生产力Net primary productivity/ (t·hm?2a?1) | 胸径 Diameter at breast height/cm | 树高 Height/ m | 株数 The number of trees/ (tree·hm?2) | 林分公顷蓄积 Stand volume/ (m3·hm?2) | 年均生长量 Mean annual increment of stand volume/ (m3·hm?2a?1) | 连年生长量 Current annual increment of stand volume/ (m3·hm?2a?1) | 公顷生 物量Biomass/ (t·hm?2) | 年均生长量Mean annual increment of biomass/ (t·hm?2a?1) | 连年生长量Current annual increment of biomass/ (t·hm?2a?1) | 枯死株数Number of dead trees/ (tree·hm?2) | 净初级生产力Net primary productivity/(t·hm?2a?1) | ||
| 5 | 1.29 | 2.81 | 3 129 | 2.39 | 0.48 | 1.62 | 2.27 | 0.45 | 1.48 | 51 | 2.16 | 0.80 | 2.20 | 3 129 | 0.62 | 0.13 | 0.46 | 0.77 | 0.15 | 0.52 | 51 | 0.43 | |
| 10 | 4.62 | 5.62 | 2 802 | 28.16 | 2.82 | 6.83 | 23.64 | 2.36 | 5.41 | 85 | 11.39 | 3.30 | 4.67 | 2 821 | 12.90 | 1.32 | 4.01 | 11.77 | 1.18 | 3.24 | 66 | 4.79 | |
| 15 | 7.48 | 7.28 | 2 324 | 59.78 | 3.99 | 6.21 | 46.22 | 3.08 | 4.22 | 104 | 13.60 | 5.56 | 6.17 | 2 477 | 35.49 | 2.42 | 4.97 | 27.62 | 1.84 | 3.16 | 69 | 7.61 | |
| 20 | 10.31 | 8.62 | 1 835 | 86.50 | 4.32 | 4.59 | 63.10 | 3.16 | 2.69 | 94 | 12.37 | 7.48 | 7.23 | 2 133 | 58.81 | 3.00 | 4.44 | 41.04 | 2.05 | 2.30 | 71 | 7.98 | |
| 25 | 13.69 | 9.99 | 1 332 | 108.72 | 4.35 | 4.24 | 77.57 | 3.10 | 2.75 | 91 | 12.80 | 9.48 | 8.18 | 1 741 | 79.56 | 3.25 | 3.83 | 52.30 | 2.09 | 1.95 | 85 | 8.26 | |
| 30 | 17.31 | 11.30 | 997 | 128.82 | 4.29 | 3.85 | 90.51 | 3.02 | 2.46 | 57 | 11.86 | 11.73 | 9.14 | 1 357 | 96.60 | 3.28 | 3.21 | 61.25 | 2.04 | 1.61 | 67 | 7.70 | |
| 35 | 21.16 | 12.57 | 763 | 147.93 | 4.23 | 3.77 | 103.01 | 2.94 | 2.45 | 40 | 11.33 | 14.11 | 10.06 | 1 066 | 111.97 | 3.26 | 2.97 | 69.44 | 1.98 | 1.55 | 52 | 8.06 | |
| 40 | 25.08 | 13.74 | 600 | 165.77 | 4.14 | 3.52 | 114.80 | 2.87 | 2.38 | 29 | 10.75 | 16.53 | 10.93 | 853 | 125.96 | 3.20 | 2.80 | 77.04 | 1.93 | 1.56 | 38 | 7.62 | |
| 45 | 28.83 | 14.80 | 487 | 181.67 | 4.04 | 3.12 | 124.90 | 2.78 | 2.00 | 20 | 9.54 | 18.83 | 11.71 | 700 | 138.11 | 3.12 | 2.37 | 83.23 | 1.85 | 1.24 | 27 | 6.73 | |
| 50 | 32.38 | 15.74 | 404 | 195.16 | 3.90 | 2.35 | 133.09 | 2.66 | 1.34 | 15 | 7.83 | 21.03 | 12.42 | 583 | 148.09 | 3.01 | 1.74 | 88.05 | 1.76 | 0.76 | 21 | 5.58 | |
| 55 | 35.88 | 16.63 | 338 | 206.17 | 3.75 | 1.97 | 139.89 | 2.54 | 1.19 | 12 | 7.20 | 23.21 | 13.08 | 487 | 155.81 | 2.88 | 1.35 | 91.85 | 1.67 | 0.62 | 18 | 4.99 | |
| 60 | 39.44 | 17.49 | 282 | 214.32 | 3.57 | 1.37 | 144.82 | 2.41 | 0.81 | 10 | 6.18 | 25.42 | 13.72 | 407 | 161.11 | 2.73 | 0.85 | 94.32 | 1.57 | 0.35 | 15 | 4.12 | |
| 65 | 43.11 | 18.34 | 236 | 220.22 | 3.39 | 1.04 | 148.45 | 2.28 | 0.63 | 9 | 5.52 | 27.69 | 14.36 | 340 | 164.53 | 2.57 | 0.54 | 95.91 | 1.48 | 0.24 | 12 | 3.73 | |
| 70 | 46.92 | 19.19 | 197 | 223.97 | 3.20 | 0.63 | 150.86 | 2.16 | 0.43 | 7 | 4.89 | 30.03 | 14.99 | 284 | 166.24 | 2.41 | 0.25 | 96.70 | 1.38 | 0.14 | 10 | 3.26 | |
| 75 | 50.82 | 20.02 | 164 | 225.25 | 3.00 | 0.14 | 151.58 | 2.02 | 0.08 | 6 | 4.04 | 32.42 | 15.60 | 237 | 166.11 | 2.25 | ?0.13 | 96.40 | 1.29 | ?0.09 | 9 | 2.63 | |
| 80 | 54.81 | 20.85 | 137 | 224.24 | 2.80 | ?0.44 | 150.75 | 1.88 | ?0.35 | 5 | 3.04 | 34.85 | 16.21 | 198 | 164.37 | 2.08 | ?0.51 | 95.22 | 1.19 | ?0.34 | 7 | 1.91 | |
| 85 | 58.90 | 21.67 | 114 | 221.42 | 2.60 | ?0.70 | 148.87 | 1.75 | ?0.47 | 4 | 2.54 | 37.35 | 16.82 | 165 | 161.34 | 1.93 | ?0.71 | 93.45 | 1.10 | ?0.41 | 6 | 1.49 | |
| 90 | 63.13 | 22.48 | 95 | 217.13 | 2.41 | ?0.97 | 146.06 | 1.62 | ?0.64 | 4 | 1.96 | 39.91 | 17.42 | 137 | 157.33 | 1.77 | ?0.89 | 91.18 | 1.01 | ?0.50 | 5 | 1.08 | |
表6
基于3-PGmix过程模型的兴安落叶松生长过程表"
| 林龄 Stand age/a | 立地等级Site level | ||||||||||||||||||||||
| Ⅰ(11.17 ≤ SI < 20.08, n=47) | Ⅱ(9.03 ≤ SI < 11.17, n=47) | ||||||||||||||||||||||
| 胸径 Diameter at breast height/cm | 树高 Height/ m | 株数 The number of trees/ (tree·hm?2) | 林分公顷蓄积 Stand volume/ (m3·hm?2) | 年均生长量 Mean annual increment of stand volume/ (m3·hm?2a?1) | 连年生长量 Current annual increment of stand volume/ (m3·hm?2a?1) | 公顷生 物量Biomass/ (t·hm?2) | 年均生长量Mean annual increment of biomass/ (t·hm?2a?1) | 连年生长量Current annual increment of biomass/ (t·hm?2a?1) | 枯死株数Number of dead trees/ (tree·hm?2) | 净初级生产力Net primary productivity/(t·hm?2a?1) | 胸径 Diameter at breast height/cm | 树高 Height/ m | 株数 The number of trees/ (tree·hm?2) | 林分公顷蓄积 Stand volume/ (m3·hm?2) | 年均生长量 Mean annual increment of stand volume/ (m3·hm?2a?1) | 连年生长量 Current annual increment of stand volume/ (m3·hm?2a?1) | 公顷生 物量Biomass/ (t·hm?2) | 年均生长量Mean annual increment of biomass/ (t·hm?2a?1) | 连年生长量Current annual increment of biomass/ (t·hm?2a?1) | 枯死株数Number of dead trees/ (tree·hm?2) | 净初级生产力Net primary productivity/(t·hm?2a?1) | ||
| 5 | 0.72 | 1.82 | 3 146 | 0.42 | 0.12 | 0.44 | 1.26 | 0.25 | 0.12 | 45 | 1.23 | 0.46 | 1.32 | 3 146 | 0.14 | 0.03 | 0.08 | 0.61 | 0.12 | 0.03 | 45 | 0.68 | |
| 10 | 2.99 | 4.91 | 2 876 | 9.81 | 1.09 | 3.10 | 15.67 | 1.57 | 1.09 | 58 | 8.26 | 2.13 | 3.77 | 2 876 | 5.09 | 0.48 | 1.13 | 9.93 | 0.99 | 0.48 | 58 | 6.61 | |
| 15 | 4.95 | 7.07 | 2 564 | 28.18 | 2.01 | 4.15 | 33.59 | 2.24 | 2.01 | 66 | 11.23 | 3.82 | 5.81 | 2 577 | 17.82 | 1.13 | 1.98 | 23.08 | 1.54 | 1.13 | 60 | 10.29 | |
| 20 | 6.59 | 8.68 | 2 242 | 48.12 | 2.56 | 4.14 | 47.15 | 2.36 | 2.56 | 62 | 10.83 | 5.31 | 7.46 | 2 270 | 33.92 | 1.65 | 2.34 | 33.31 | 1.67 | 1.65 | 60 | 10.64 | |
| 25 | 8.38 | 10.25 | 1 885 | 69.43 | 2.98 | 4.67 | 59.91 | 2.40 | 2.98 | 72 | 11.54 | 6.78 | 9.00 | 1 974 | 52.41 | 2.12 | 2.94 | 42.91 | 1.72 | 2.12 | 58 | 11.53 | |
| 30 | 10.22 | 11.74 | 1 566 | 89.45 | 3.22 | 4.52 | 69.49 | 2.32 | 3.22 | 60 | 10.66 | 8.19 | 10.40 | 1 700 | 70.67 | 2.47 | 3.12 | 49.86 | 1.66 | 2.47 | 54 | 10.75 | |
| 35 | 12.22 | 13.25 | 1 292 | 109.72 | 3.41 | 4.58 | 78.49 | 2.24 | 3.41 | 51 | 10.24 | 9.71 | 11.80 | 1 440 | 89.63 | 2.79 | 3.39 | 56.43 | 1.61 | 2.79 | 49 | 10.27 | |
| 40 | 14.36 | 14.79 | 1 062 | 129.93 | 3.55 | 4.41 | 86.83 | 2.17 | 3.55 | 40 | 9.67 | 11.29 | 13.19 | 1 217 | 108.43 | 3.07 | 3.51 | 62.22 | 1.56 | 3.07 | 41 | 9.69 | |
| 45 | 16.46 | 16.24 | 887 | 149.01 | 3.64 | 4.22 | 93.77 | 2.08 | 3.64 | 31 | 8.88 | 12.80 | 14.50 | 1 040 | 126.28 | 3.30 | 3.59 | 66.78 | 1.48 | 3.30 | 32 | 8.71 | |
| 50 | 18.39 | 17.55 | 756 | 165.96 | 3.67 | 3.58 | 98.79 | 1.98 | 3.67 | 23 | 7.27 | 14.19 | 15.69 | 899 | 142.05 | 3.47 | 3.32 | 69.67 | 1.39 | 3.47 | 26 | 7.02 | |
| 55 | 20.31 | 18.82 | 650 | 182.34 | 3.68 | 3.69 | 104.00 | 1.89 | 3.68 | 20 | 7.00 | 15.54 | 16.84 | 781 | 156.91 | 3.62 | 3.57 | 72.60 | 1.32 | 3.62 | 22 | 6.52 | |
| 60 | 22.11 | 19.99 | 564 | 196.38 | 3.64 | 3.16 | 107.46 | 1.79 | 3.64 | 16 | 5.95 | 16.85 | 17.94 | 678 | 169.39 | 3.72 | 3.36 | 74.06 | 1.23 | 3.72 | 19 | 5.41 | |
| 65 | 23.94 | 21.16 | 489 | 208.96 | 3.59 | 2.82 | 110.32 | 1.70 | 3.59 | 14 | 5.30 | 18.19 | 19.03 | 589 | 180.83 | 3.80 | 3.32 | 75.29 | 1.16 | 3.80 | 17 | 4.67 | |
| 70 | 25.82 | 22.33 | 425 | 220.08 | 3.52 | 2.33 | 112.57 | 1.61 | 3.52 | 12 | 4.68 | 19.54 | 20.12 | 512 | 190.76 | 3.86 | 3.11 | 76.00 | 1.09 | 3.86 | 15 | 4.00 | |
| 75 | 27.71 | 23.48 | 369 | 228.79 | 3.42 | 1.85 | 113.52 | 1.51 | 3.42 | 11 | 3.98 | 20.88 | 21.19 | 444 | 198.74 | 3.89 | 2.89 | 75.88 | 1.01 | 3.89 | 13 | 3.26 | |
| 80 | 29.57 | 24.59 | 320 | 234.62 | 3.30 | 1.13 | 112.95 | 1.41 | 3.30 | 9 | 2.97 | 22.21 | 22.23 | 385 | 204.39 | 3.89 | 2.42 | 74.86 | 0.94 | 3.89 | 11 | 2.34 | |
| 85 | 31.45 | 25.70 | 278 | 238.78 | 3.17 | 0.89 | 112.00 | 1.32 | 3.17 | 8 | 2.55 | 23.55 | 23.27 | 334 | 208.52 | 3.86 | 2.32 | 73.66 | 0.87 | 3.86 | 10 | 1.90 | |
| 90 | 33.33 | 26.79 | 241 | 240.64 | 3.02 | 0.40 | 110.03 | 1.22 | 3.02 | 7 | 1.90 | 24.89 | 24.29 | 290 | 210.82 | 3.81 | 1.98 | 71.95 | 0.80 | 3.81 | 8 | 1.35 | |
表7
基于3-PGmix过程模型的长白落叶松生长过程表"
| 林龄 Stand age/a | 立地等级Site level | ||||||||||||||||||||||
| Ⅰ(12.76 ≤ SI < 18.23, n=47) | Ⅱ(10.00 ≤ SI < 12.76, n=47) | ||||||||||||||||||||||
| 胸径 Diameter at breast height/cm | 树高 Height/ m | 株数 The number of trees/ (tree·hm?2) | 林分公顷蓄积 Stand volume/ (m3·hm?2) | 年均生长量 Mean annual increment of stand volume/ (m3·hm?2a?1) | 连年生长量 Current annual increment of stand volume/ (m3·hm?2a?1) | 公顷生 物量Biomass/ (t·hm?2) | 年均生长量Mean annual increment of biomass/ (t·hm?2a?1) | 连年生长量Current annual increment of biomass/ (t·hm?2a?1) | 枯死株数Number of dead trees/ (tree·hm?2) | 净初级生产力Net primary productivity/ (t·hm?2a?1) | 胸径 Diameter at breast height/cm | 树高 Height/ m | 株数 The number of trees/ (tree·hm?2) | 林分公顷蓄积 Stand volume/ (m3·hm?2) | 年均生长量 Mean annual increment of stand volume/ (m3·hm?2a?1) | 连年生长量 Current annual increment of stand volume/ (m3·hm?2a?1) | 公顷生 物量Biomass/ (t·hm?2) | 年均生长量Mean annual increment of biomass/ (t·hm?2a?1) | 连年生长量Current annual increment of biomass/ (t·hm?2a?1) | 枯死株数Number of dead trees/ (tree·hm?2) | 净初级生产力Net primary productivity/ (t·hm?2a?1) | ||
| 5 | 0.74 | 3.52 | 3 169 | 0.86 | 0.21 | 0.62 | 3.56 | 0.71 | 2.14 | 50 | 3.09 | 0.55 | 2.88 | 3 169 | 0.48 | 0.12 | 0.33 | 2.18 | 0.44 | 1.28 | 50 | 1.94 | |
| 10 | 3.26 | 6.87 | 2 890 | 17.06 | 1.87 | 4.76 | 27.46 | 2.75 | 5.63 | 61 | 11.31 | 2.54 | 5.76 | 2 890 | 10.45 | 1.17 | 3.24 | 19.65 | 1.97 | 4.42 | 61 | 8.86 | |
| 15 | 5.33 | 8.90 | 2 568 | 41.65 | 2.97 | 4.71 | 53.21 | 3.55 | 5.09 | 68 | 13.61 | 4.37 | 7.63 | 2 580 | 28.75 | 2.10 | 3.80 | 41.41 | 2.76 | 4.45 | 62 | 11.75 | |
| 20 | 7.18 | 10.58 | 2 206 | 65.20 | 3.45 | 4.46 | 73.82 | 3.69 | 3.57 | 80 | 12.27 | 5.92 | 9.00 | 2 276 | 47.71 | 2.58 | 3.78 | 59.68 | 2.98 | 3.17 | 59 | 10.95 | |
| 25 | 9.26 | 12.44 | 1 797 | 86.87 | 3.67 | 4.46 | 93.40 | 3.74 | 3.79 | 81 | 13.16 | 7.38 | 10.27 | 1 986 | 66.07 | 2.85 | 4.03 | 77.66 | 3.11 | 3.53 | 58 | 11.88 | |
| 30 | 11.68 | 14.38 | 1 437 | 106.85 | 3.76 | 4.18 | 110.70 | 3.69 | 3.58 | 65 | 12.72 | 8.96 | 11.57 | 1 691 | 83.78 | 3.01 | 3.86 | 93.24 | 3.11 | 3.15 | 62 | 11.56 | |
| 35 | 14.34 | 16.35 | 1 156 | 126.20 | 3.81 | 4.13 | 126.81 | 3.62 | 3.37 | 48 | 12.34 | 10.77 | 12.97 | 1 392 | 100.28 | 3.10 | 3.63 | 106.82 | 3.05 | 2.85 | 53 | 11.35 | |
| 40 | 17.34 | 18.44 | 933 | 146.06 | 3.87 | 4.16 | 142.96 | 3.57 | 3.10 | 37 | 11.71 | 12.83 | 14.47 | 1 142 | 116.86 | 3.18 | 3.55 | 120.09 | 3.00 | 2.46 | 44 | 10.85 | |
| 45 | 20.39 | 20.46 | 767 | 164.69 | 3.89 | 3.77 | 157.47 | 3.50 | 2.97 | 29 | 11.37 | 14.98 | 15.95 | 940 | 131.76 | 3.20 | 3.19 | 131.46 | 2.92 | 2.34 | 35 | 10.57 | |
| 50 | 23.41 | 22.32 | 642 | 182.09 | 3.88 | 3.56 | 169.57 | 3.39 | 2.13 | 20 | 9.43 | 17.12 | 17.31 | 787 | 145.61 | 3.20 | 3.00 | 140.57 | 2.81 | 1.51 | 25 | 8.71 | |
| 55 | 26.38 | 24.16 | 545 | 198.13 | 3.85 | 3.67 | 181.61 | 3.30 | 2.39 | 17 | 9.40 | 19.23 | 18.65 | 669 | 158.43 | 3.18 | 3.08 | 149.64 | 2.72 | 1.80 | 21 | 8.74 | |
| 60 | 29.39 | 25.93 | 466 | 213.29 | 3.81 | 3.38 | 192.28 | 3.20 | 2.19 | 14 | 8.67 | 21.36 | 19.94 | 574 | 170.59 | 3.15 | 2.84 | 157.46 | 2.62 | 1.62 | 18 | 8.02 | |
| 65 | 32.43 | 27.68 | 401 | 227.09 | 3.76 | 3.02 | 201.39 | 3.10 | 1.87 | 12 | 8.05 | 23.54 | 21.22 | 493 | 181.72 | 3.11 | 2.56 | 164.03 | 2.52 | 1.37 | 15 | 7.47 | |
| 70 | 35.64 | 29.48 | 345 | 240.16 | 3.70 | 2.79 | 209.79 | 3.00 | 1.49 | 10 | 7.34 | 25.86 | 22.55 | 424 | 192.35 | 3.07 | 2.37 | 170.09 | 2.43 | 1.05 | 13 | 6.82 | |
| 75 | 38.92 | 31.27 | 296 | 250.74 | 3.62 | 2.13 | 215.88 | 2.88 | 1.17 | 9 | 6.79 | 28.22 | 23.87 | 365 | 201.11 | 3.01 | 1.86 | 174.28 | 2.32 | 0.82 | 11 | 6.31 | |
| 80 | 42.27 | 33.05 | 255 | 258.82 | 3.52 | 1.63 | 219.07 | 2.74 | 0.33 | 8 | 5.31 | 30.65 | 25.18 | 314 | 207.92 | 2.92 | 1.43 | 176.08 | 2.20 | 0.07 | 9 | 4.91 | |
| 85 | 45.69 | 34.85 | 219 | 264.37 | 3.39 | 1.39 | 221.01 | 2.60 | 0.30 | 7 | 4.91 | 33.12 | 26.50 | 270 | 212.78 | 2.82 | 1.22 | 177.00 | 2.08 | 0.11 | 8 | 4.57 | |
| 90 | 49.22 | 36.67 | 188 | 268.08 | 3.26 | 0.90 | 221.15 | 2.46 | ?0.02 | 6 | 4.16 | 35.67 | 27.83 | 232 | 216.19 | 2.72 | 0.83 | 176.48 | 1.96 | ?0.13 | 7 | 3.86 | |
表8
基于3-PGmix过程模型的日本落叶松生长过程表"
| 林龄 Stand age/a | 立地等级Site level | ||||||||||||||||||||||
| I(13.64 ≤ SI < 16.83, n=10) | Ⅱ(11.50 ≤ SI < 13.64, n=9) | ||||||||||||||||||||||
| 胸径 Diameter at breast height/cm | 树高 Height/ m | 株数 The number of trees/ (tree·hm?2) | 林分公顷蓄积 Stand volume/ (m3·hm?2) | 年均生长量 Mean annual increment of stand volume/ (m3·hm?2a?1) | 连年生长量 Current annual increment of stand volume/ (m3·hm?2a?1) | 公顷生 物量Biomass/ (t·hm?2) | 年均生长量Mean annual increment of biomass/ (t·hm?2a?1) | 连年生长量Current annual increment of biomass/ (t·hm?2a?1) | 枯死株数Number of dead trees/ (tree·hm?2) | 净初级生产力Net primary productivity/ (t·hm?2a?1) | 胸径 Diameter at breast height/cm | 树高 Height/ m | 株数 The number of trees/ (tree·hm?2) | 林分公顷蓄积 Stand volume/ (m3·hm?2) | 年均生长量 Mean annual increment of stand volume/ (m3·hm?2a?1) | 连年生长量 Current annual increment of stand volume/ (m3·hm?2a?1) | 公顷生物量Biomass/ (t·hm?2) | 年均生长量Mean annual increment of biomass/ (t·hm?2a?1) | 连年生长量Current annual increment of biomass/ (t·hm?2a?1) | 枯死株数Number of dead trees/ (tree·hm?2) | 净初级生产力Net primary productivity/ (t·hm?2a?1) | ||
| 5 | 1.08 | 1.62 | 3 110 | 0.73 | 0.35 | 1.10 | 3.45 | 0.87 | 2.35 | 55 | 4.43 | 0.99 | 1.52 | 3 110 | 1.23 | 0.19 | 1.09 | 3.60 | 0.52 | 2.49 | 55 | 2.75 | |
| 10 | 4.99 | 5.75 | 2 784 | 21.12 | 3.38 | 8.02 | 32.08 | 3.80 | 6.53 | 70 | 16.02 | 3.87 | 4.66 | 2 784 | 23.47 | 2.49 | 8.30 | 34.90 | 2.84 | 7.13 | 70 | 12.98 | |
| 15 | 8.18 | 8.67 | 2 183 | 58.55 | 5.73 | 10.70 | 60.29 | 4.62 | 5.51 | 157 | 18.03 | 6.49 | 7.12 | 2 421 | 59.06 | 4.49 | 10.83 | 65.21 | 3.68 | 5.56 | 79 | 15.37 | |
| 20 | 11.42 | 11.40 | 1 599 | 99.20 | 7.22 | 9.94 | 80.70 | 4.57 | 3.24 | 87 | 15.01 | 9.67 | 9.83 | 1 922 | 99.20 | 5.71 | 10.49 | 85.96 | 3.70 | 3.33 | 93 | 13.19 | |
| 25 | 15.33 | 14.49 | 1 189 | 147.55 | 8.62 | 13.13 | 100.75 | 4.53 | 3.78 | 78 | 15.82 | 13.55 | 12.92 | 1 491 | 148.15 | 6.80 | 13.79 | 105.99 | 3.68 | 3.69 | 81 | 13.83 | |
| 30 | 19.80 | 17.84 | 835 | 201.22 | 9.85 | 14.98 | 118.72 | 4.44 | 3.48 | 59 | 14.66 | 18.12 | 16.43 | 1 151 | 202.82 | 7.72 | 15.44 | 122.85 | 3.56 | 3.33 | 69 | 12.91 | |
| 35 | 24.68 | 21.37 | 624 | 256.84 | 10.81 | 15.51 | 133.64 | 4.27 | 3.06 | 36 | 13.75 | 22.83 | 19.89 | 876 | 259.85 | 8.45 | 16.00 | 137.20 | 3.42 | 2.94 | 48 | 12.07 | |
| 40 | 29.96 | 25.05 | 483 | 317.84 | 11.69 | 15.44 | 148.22 | 4.14 | 2.62 | 23 | 12.23 | 27.79 | 23.42 | 686 | 320.81 | 9.13 | 15.73 | 150.92 | 3.29 | 2.41 | 32 | 10.80 | |
| 45 | 35.02 | 28.47 | 392 | 376.41 | 12.28 | 15.52 | 160.04 | 3.96 | 2.37 | 16 | 11.12 | 32.44 | 26.63 | 558 | 378.43 | 9.59 | 15.47 | 161.48 | 3.14 | 2.10 | 23 | 9.83 | |
| 50 | 39.78 | 31.62 | 326 | 427.82 | 12.54 | 11.56 | 167.77 | 3.73 | 0.90 | 12 | 8.22 | 36.76 | 29.54 | 464 | 428.60 | 9.79 | 11.47 | 167.78 | 2.94 | 0.61 | 17 | 7.30 | |
| 55 | 44.73 | 34.83 | 272 | 476.17 | 12.64 | 11.96 | 173.64 | 3.50 | 0.97 | 10 | 7.65 | 41.23 | 32.48 | 387 | 474.28 | 9.87 | 11.59 | 172.10 | 2.75 | 0.66 | 14 | 6.81 | |
| 60 | 49.91 | 38.13 | 226 | 519.98 | 12.60 | 10.91 | 177.11 | 3.26 | 0.58 | 8 | 6.42 | 45.87 | 35.49 | 322 | 514.25 | 9.84 | 10.35 | 174.04 | 2.56 | 0.26 | 12 | 5.74 | |
| 65 | 55.28 | 41.48 | 189 | 557.02 | 12.41 | 9.12 | 177.90 | 3.02 | 0.10 | 7 | 5.43 | 50.66 | 38.53 | 268 | 547.08 | 9.69 | 8.53 | 173.36 | 2.36 | ?0.18 | 10 | 4.84 | |
| 70 | 60.97 | 44.97 | 157 | 590.42 | 12.15 | 7.37 | 177.47 | 2.78 | ?0.31 | 6 | 4.37 | 55.69 | 41.68 | 223 | 575.36 | 9.49 | 6.72 | 171.57 | 2.17 | ?0.56 | 8 | 3.91 | |
| 75 | 66.84 | 48.50 | 130 | 616.24 | 11.79 | 5.94 | 174.85 | 2.55 | ?0.59 | 5 | 3.53 | 60.88 | 44.88 | 186 | 596.34 | 9.21 | 5.20 | 167.79 | 1.99 | ?0.81 | 7 | 3.16 | |
| 80 | 72.84 | 52.07 | 108 | 633.72 | 11.33 | 3.17 | 170.14 | 2.32 | ?1.17 | 4 | 2.28 | 66.19 | 48.11 | 154 | 609.98 | 8.85 | 2.60 | 162.24 | 1.81 | ?1.30 | 6 | 2.04 | |
| 85 | 79.10 | 55.72 | 90 | 645.82 | 10.84 | 2.43 | 164.58 | 2.11 | ?1.18 | 3 | 1.80 | 71.74 | 51.44 | 128 | 618.64 | 8.46 | 1.84 | 156.09 | 1.64 | ?1.27 | 5 | 1.61 | |
| 90 | 85.63 | 59.49 | 75 | 653.12 | 10.33 | 1.37 | 158.35 | 1.91 | ?1.27 | 3 | 1.26 | 77.53 | 54.86 | 107 | 623.03 | 8.06 | 0.84 | 149.56 | 1.49 | ?1.31 | 4 | 1.13 | |
| 迟 健, 李桂英, 王伟雄, 等. 浙江省马尾松人工林多形地位指数表及林分生长过程表的编制. 林业科学研究, 1996, 9 (1): 68- 74. | |
| Chi J, Li G Y, Wang W X, et al. The establishment of multi-formed site index and growth processing tables for plantation of Pinus massoniana in Zhejiang Province. Forest Research, 1996, 9 (1): 68- 74. | |
| 国家林业和草原局. 2019. 中国森林资源报告(2014—2018). 北京: 中国林业出版社. | |
| National Forestry and Grassland Administration. 2019. China forestry resource report (2014—2018). Beijing: China Forestry Publishing House. [in Chinese] | |
| 胡 萍. 2007. 日本落叶松林分生长预测及收获预估. 兰州: 甘肃农业大学. | |
| Hu P. 2007. The stand growth and yield prediction of Larix kaempferi. Lanhou: Gansu Agricultural University. [in Chinese] | |
| 黄家荣. 贵州马尾松人工林经营密度模型初探. 北京林业大学学报, 1993, 15 (4): 32- 37. | |
| Huang J R. Preliminary study on management density of Masson pine plantation in Guizhou Province. Journal of Beijing Forestry University, 1993, 15 (4): 32- 37. | |
|
亢新刚, 崔相慧, 王 虹. 冀北次生林3个树种林分生长过程表的编制. 北京林业大学学报, 2001a, 23 (3): 39- 42.
doi: 10.13332/j.1000-1522.2001.03.009 |
|
|
Kang X G, Cui X H, Wang H. Compilation of stand growth table for 3 tree species of secondary forest in north Hebei Province. Journal of Beijing Forestry University, 2001a, 23 (3): 39- 42.
doi: 10.13332/j.1000-1522.2001.03.009 |
|
| 亢新刚, 崔相慧. 华北落叶松人工林生长过程表的编制. 河北林业科技, 2001b, (3): 21- 23. | |
| Kang X G, Cui X H. Compilation of the growth table for Larix principis-rupprechtii Mayr man: made forest. The Journal of Hebei Forestry Science and Technology, 2001b, (3): 21- 23. | |
| 李 梦, 李长胜, 徐 起, 等. 长白落叶松人工林自然稀疏模型及生长过程表的编制. 林业勘查设计, 1995, (2): 30- 33. | |
| Li M, Li C S, Xu Q, et al. Compilation of natural sparse model and growth process table of Larix olgensis plantation. Forest Investigation Design, 1995, (2): 30- 33. | |
| 李凤日. 兴安落叶松天然林直径分布及产量预测模型的研究. 东北林业大学学报, 1987, 15 (4): 8- 16. | |
| Li F R. Study on diameter distribution and models predicting yields for natural Dahurian larch stands. Journal of Northeast Forestry University, 1987, 15 (4): 8- 16. | |
| 梁瑞龙, 杨章旗, 蒙福祥. 广西马尾松人工林生长过程表的编制. 广西林业科学, 1996, 25 (1): 57- 59. | |
| Liang R L, Yang Z Q, Meng F X. Establishment of growth table of Pinus massoniana plantation in Guangxi. Guanxi Forestry Science, 1996, 25 (1): 57- 59. | |
| 刘景芳, 童书振. 杉木人工林生长过程表编制的研究. 林业科学研究, 1995, 8 (2): 164- 169. | |
| Liu J F, Tong S Z. Establishment of stand growth tables for the national Chinese fir plantations. Forest Research, 1995, 8 (2): 164- 169. | |
| 刘君然. 落叶松人工林林分密度标准表及生长过程表编制的研究. 内蒙古林业调查设计, 1995, 18 (3): 12- 15. | |
| Liu J R. Study on establishment of stand density standard table and growth table of larch plantation. Inner Mongolia Forestry Investigation and Design, 1995, 18 (3): 12- 15. | |
| 陆海望. 2021. 安徽省湿地松生长收获模型的构建及生长过程表的编制. 合肥: 安徽农业大学. | |
| Lu H W. 2021. Establishment of growth and yield model and compilation of growth table for Pinus elliottii in Anhui Province. Hefei: Anhui Agricultural University. [in Chinese] | |
| 史大林. 2008. 碳汇林经营数表编制的探索. 北京: 北京林业大学. | |
| Shi D L. 2008. The research on organization of management statistics and tables of carbon sequestration forest. Beijing: Beijing Forestry University. [in Chinese] | |
| 司洪生, 何美成. 兴安落叶松生长过程表的研究. 东北林学院学报, 1985, 13 (2): 48- 55. | |
| Si H S, He M C. Study of yield table of Dahurian larch. Journal of North-Eastern Forestry College, 1985, 13 (2): 48- 55. | |
| 王 战. 1992. 中国落叶松林. 北京: 中国林业出版社. | |
| Wang Z. 1992. Larch forests in China. Beijing: China Forestry Publishing House. [in Chinese] | |
|
解雅麟, 王海燕, 雷相东. 基于过程模型的气候变化对长白落叶松人工林净初级生产力的影响. 植物生态学报, 2017, 41 (8): 826- 839.
doi: 10.17521/cjpe.2016.0382 |
|
|
Xie Y L, Wang H Y, Lei X D. Effects of climate change on net primary productivity in Larix olgensis plantations based on process modeling. Chinese Journal of Plant Ecology, 2017, 41 (8): 826- 839.
doi: 10.17521/cjpe.2016.0382 |
|
| 解雅麟, 王海燕, 雷相东. 基于3-PG模型的长白落叶松人工林生长和生物量模拟. 南京林业大学学报(自然科学版), 2018, 42 (1): 141- 148. | |
| Xie Y L, Wang H Y, Lei X D. Growth and biomass simulation of Larix olgensis plantations based on 3-PG model. Journal of Nanjing Forestry University (Natural Science Edition), 2018, 42 (1): 141- 148. | |
| 叶要妹, 庄尔奇, 凌远云. 湖北省马尾松人工林林分生长过程表的编制. 华中农业大学学报, 1996, 15 (5): 84- 89. | |
| Ye Y M, Zhuang E Q, Ling Y Y. Studies on the relationship between the early-rice annual yield of Hubei Province and southern oscillation index(soi) and atmospheric circulation. Journal of Huazhong Agricultural University, 1996, 15 (5): 84- 89. | |
| 臧 颢. 2016. 区域尺度气候敏感的落叶松人工林林分生长模型. 北京: 中国林业科学研究院. | |
| Zang H. 2016. Regional-scale climate-sensitive stand growth models for larch plantations. Beijing: Chinese Academy of Forestry. [in Chinese] | |
|
Amichev B Y, Hangs R D, van Rees K C J. A novel approach to simulate growth of multi-stem willow in bioenergy production systems with a simple process-based model (3-PG). Biomass and Bioenergy, 2011, 35 (1): 473- 488.
doi: 10.1016/j.biombioe.2010.09.007 |
|
| Coops N C, Waring R H, Landsberg J J. Assessing forest productivity in Australia and New Zealand using a physiologically-based model driven with averaged monthly weather data and satellite-derived estimates of canopy photosynthetic capacity. Forest Ecology and Management, 1998, 104 (1/2/3): 113- 127. | |
|
Forrester D I. A stand-level light interception model for horizontally and vertically heterogeneous canopies. Ecological Modelling, 2014, 276, 14- 22.
doi: 10.1016/j.ecolmodel.2013.12.021 |
|
|
Forrester D I, Tang X. Analysing the spatial and temporal dynamics of species interactions in mixed-species forests and the effects of stand density using the 3-PG model. Ecological Modelling, 2016, 319, 233- 254.
doi: 10.1016/j.ecolmodel.2015.07.010 |
|
|
Gupta R, Sharma L K. The process-based forest growth model 3-PG for use in forest management: a review. Ecological Modelling, 2019, 397, 55- 73.
doi: 10.1016/j.ecolmodel.2019.01.007 |
|
|
Landsberg J J, Waring R H. A generalised model of forest productivity using simplified concepts of radiation-use efficiency, carbon balance and partitioning. Forest Ecology and Management, 1997, 95 (3): 209- 228.
doi: 10.1016/S0378-1127(97)00026-1 |
|
| Landsberg J J, Waring R H, Coops N C. Performance of the forest productivity model 3-PG applied to a wide range of forest types. Forest Ecology and Management, 2003, 172 (2/3): 199- 214. | |
| Oliveira C M M D, Delgado R C, Araújo E J G D, et al. Influence of climate variables in forest production via 3-PG model in the northern of Minas Gerais State. Scientia Forestalis, 2017, 45 (114): 15. | |
|
Susaeta A, Adams D, Gonzalez-Benecke C, et al. Economic feasibility of managing loblolly pine forests for water production under climate change in the southeastern United States. Forests, 2017, 8 (3): 83.
doi: 10.3390/f8030083 |
|
|
Thomas R Q, Brooks E B, Jersild A L, et al. Leveraging 35 years of Pinus taeda research in the southeastern US to constrain forest carbon cycle predictions: regional data assimilation using ecosystem experiments. Biogeosciences, 2017, 14 (14): 3525- 3547.
doi: 10.5194/bg-14-3525-2017 |
|
|
Wang T L, Wang G Y, Innes J L, et al. ClimateAP: an application for dynamic local downscaling of historical and future climate data in Asia Pacific. Frontiers of Agricultural Science and Engineering, 2017, 4 (4): 448.
doi: 10.15302/J-FASE-2017172 |
|
|
Xie Y, Wang H, Lei X. Application of the 3-PG model to predict growth of Larix olgensis plantations in northeastern China. Forest Ecology and Management, 2017, 406, 208- 218.
doi: 10.1016/j.foreco.2017.10.018 |
|
|
Xie Y, Lei X, Shi J. Impacts of climate change on biological rotation of Larix olgensis plantations for timber production and carbon storage in northeast China using the 3-PGmix model. Ecological Modelling, 2020a, 435, 109267.
doi: 10.1016/j.ecolmodel.2020.109267 |
|
|
Xie Y, Wang H, Lei X. Simulation of climate change and thinning effects on productivity of Larix olgensis plantations in northeast China using 3-PGmix model. Journal of Environmental Management, 2020b, 261, 110249.
doi: 10.1016/j.jenvman.2020.110249 |
|
| Zhou G, Wang Y, Jiang Y, et al. Estimating biomass and net primary production from forest inventory data: a case study of China’s Larix forests. Forest Ecology and Management, 2002, 169 (1/2): 149- 157. |
| [1] | 王彦辉,于澎涛,田奥,韩新生,郝佳,刘泽彬,王晓. 黄土高原和六盘山区的林水协调多功能管理[J]. 林业科学, 2023, 59(4): 1-17. |
| [2] | 张紫优,王彦辉,田奥,刘泽彬,郭建斌,于澎涛,王晓,于艺鹏. 宁夏六盘山华北落叶松人工林植被碳密度时空特征及其环境响应[J]. 林业科学, 2023, 59(4): 32-45. |
| [3] | 张晓红,周超凡,张状,冯林艳,王利华,符利勇,谭炳香. 崇礼冬奥核心区华北落叶松人工林结构特征与优化模拟[J]. 林业科学, 2022, 58(10): 79-88. |
| [4] | 马婷,李崇贵,汤伏全,吕杰. 基于多分类器集成的落叶松人工林提取[J]. 林业科学, 2021, 57(11): 105-118. |
| [5] | 何潇,雷相东. 东北地区落叶松人工林生物量转换与扩展因子空间自回归模型[J]. 林业科学, 2021, 57(10): 49-58. |
| [6] | 韩新生, 王彦辉, 李振华, 王艳兵, 于澎涛, 熊伟. 六盘山半干旱区华北落叶松人工林林下日蒸散特征及其影响因子[J]. 林业科学, 2019, 55(9): 11-21. |
| [7] | 陈东升, 李凤日, 孙晓梅, 张守攻. 基于节子分析技术构建落叶松人工林树冠基部高动态模型[J]. 林业科学, 2019, 55(9): 103-110. |
| [8] | 扈梦梅,田龙,吴亚楠,杨晋宇,吕小翠,黄选瑞. 塞罕坝华北落叶松人工林间伐和混交改造对大型土壤动物群落结构的影响[J]. 林业科学, 2019, 55(11): 153-162. |
| [9] | 顾伟, 马玲, 孙虎, 王利东, 张子龙. 不同土壤环境下落叶松人工林昆虫群落结构及动态的差异[J]. 林业科学, 2017, 53(5): 97-106. |
| [10] | 高敏, 马香丽, 杨晋宇, 黄选瑞, 吴亚楠. 冀北山地华北落叶松人工林与白桦混交改造模式对土壤动物群落的影响[J]. 林业科学, 2017, 53(1): 70-81. |
| [11] | 刘伟玮, 刘某承, 李文华, 曾凡顺, 曲艺. 落叶松-人参复合系统的植物多样性和碳储量特征[J]. 林业科学, 2016, 52(9): 124-132. |
| [12] | 殷鸣放;周立君;殷炜达. 长白落叶松人工林带状间伐方式对土壤有机碳含量的影响[J]. 林业科学, 2012, 48(7): 170-173. |
| [13] | 陈东升;李凤日;孙晓梅;贾炜玮. 基于线性混合模型的落叶松人工林节子大小预测模型[J]. 林业科学, 2011, 47(11): 121-128. |
| [14] | 罗云建;王效科 张小全;朱建华 张治军 侯振宏. 华北落叶松人工林的生物量估算参数[J]. 林业科学, 2010, 46(2): 6-11. |
| [15] | 董希斌 王立海. 落叶松人工林采集作业模式的优选[J]. 林业科学, 2007, 43(9): 48-52. |
| 阅读次数 | ||||||
|
全文 |
|
|||||
|
摘要 |
|
|||||