
Scientia Silvae Sinicae ›› 2019, Vol. 55 ›› Issue (12): 74-83.doi: 10.11707/j.1001-7488.20191208
• Articles • Previous Articles Next Articles
Zhulin Chen,Xuefeng Wang*
Received:2017-07-31
Online:2019-12-25
Published:2020-01-02
Contact:
Xuefeng Wang
Supported by:CLC Number:
Zhulin Chen,Xuefeng Wang. Segmentation and Soil Available Nitrogen Diagnosis of Young Stage Sandalwood Based on Image[J]. Scientia Silvae Sinicae, 2019, 55(12): 74-83.
Table 1
Difference examination of available nitrogen content under six kinds of nitrogen application levels"
| 施氮水平 Nitrogen application level/ (kg·hm-2) | 差异性检验 Difference examination | |||
| R | G | B | N/(mg·kg-1) | |
| 0 | 168.74±4.22a | 186.24±4.38a | 94.14±4.51a | 2.34±1.39a |
| 50 | 168.02±4.13a | 185.43±4.27a | 93.87±4.62a | 5.77±2.16a |
| 100 | 152.88±5.62b | 172.42±4.51b | 79.74±2.76b | 17.39±6.02b |
| 150 | 150.13±5.76b | 168.57±6.08b | 77.84±2.69b | 19.43±7.00b |
| 200 | 133.58±5.48c | 159.41±5.36c | 65.91±2.72c | 43.93+14.39c |
| 250 | 130.39±5.19c | 157.89±5.72c | 63.83±2.51c | 49.76±16.91c |
Table 2
Statistical information of available nitrogen and RGB channel value in different levels"
| 施氮水平 Nitrogen application level | 速效氮含量Available nitrogen content/ (g·kg-1) | R通道R channel | G通道G channel | B通道B channel | |||||||||||||||
| 最小值 | 最大值 | 均值 | 标准差 | 最小值 | 最大值 | 均值 | 标准差 | 最小值 | 最大值 | 均值 | 标准差 | 最小值 | 最大值 | 均值 | 标准差 | ||||
| Min. | Max. | Mean | SD | Min. | Max. | Mean | SD | Min. | Max. | Mean | SD | Min. | Max. | Mean | SD | ||||
| 水平1 Level 1 | 1.20 | 8.40 | 4.06 | 0.67 | 129.37 | 184.78 | 168.38 | 15.21 | 152.46 | 202.61 | 185.84 | 15.78 | 59.68 | 113.99 | 94.01 | 16.27 | |||
| 水平2 Level 2 | 6.80 | 28.60 | 18.41 | 4.26 | 120.48 | 180.85 | 151.51 | 20.83 | 141.51 | 199.31 | 170.50 | 16.89 | 63.41 | 92.07 | 78.79 | 10.11 | |||
| 水平3 Level 3 | 22.00 | 75.10 | 46.85 | 17.16 | 102.28 | 173.59 | 131.99 | 22.11 | 126.16 | 183.20 | 158.65 | 20.21 | 58.05 | 97.60 | 64.87 | 11.33 | |||
| 全水平All levels | 1.20 | 75.10 | 24.21 | 20.47 | 102.28 | 184.78 | 150.63 | 21.97 | 113.99 | 202.61 | 171.66 | 19.09 | 58.05 | 113.99 | 79.22 | 13.26 | |||
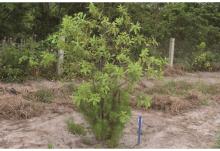
Fig.1
Original image of sandalwood"

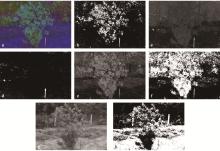
Fig.2
Sandalwood images segmentation results using different color channels"

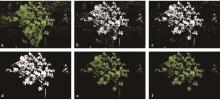
Fig.3
Segmentation process and result of sandalwood image in complex background"
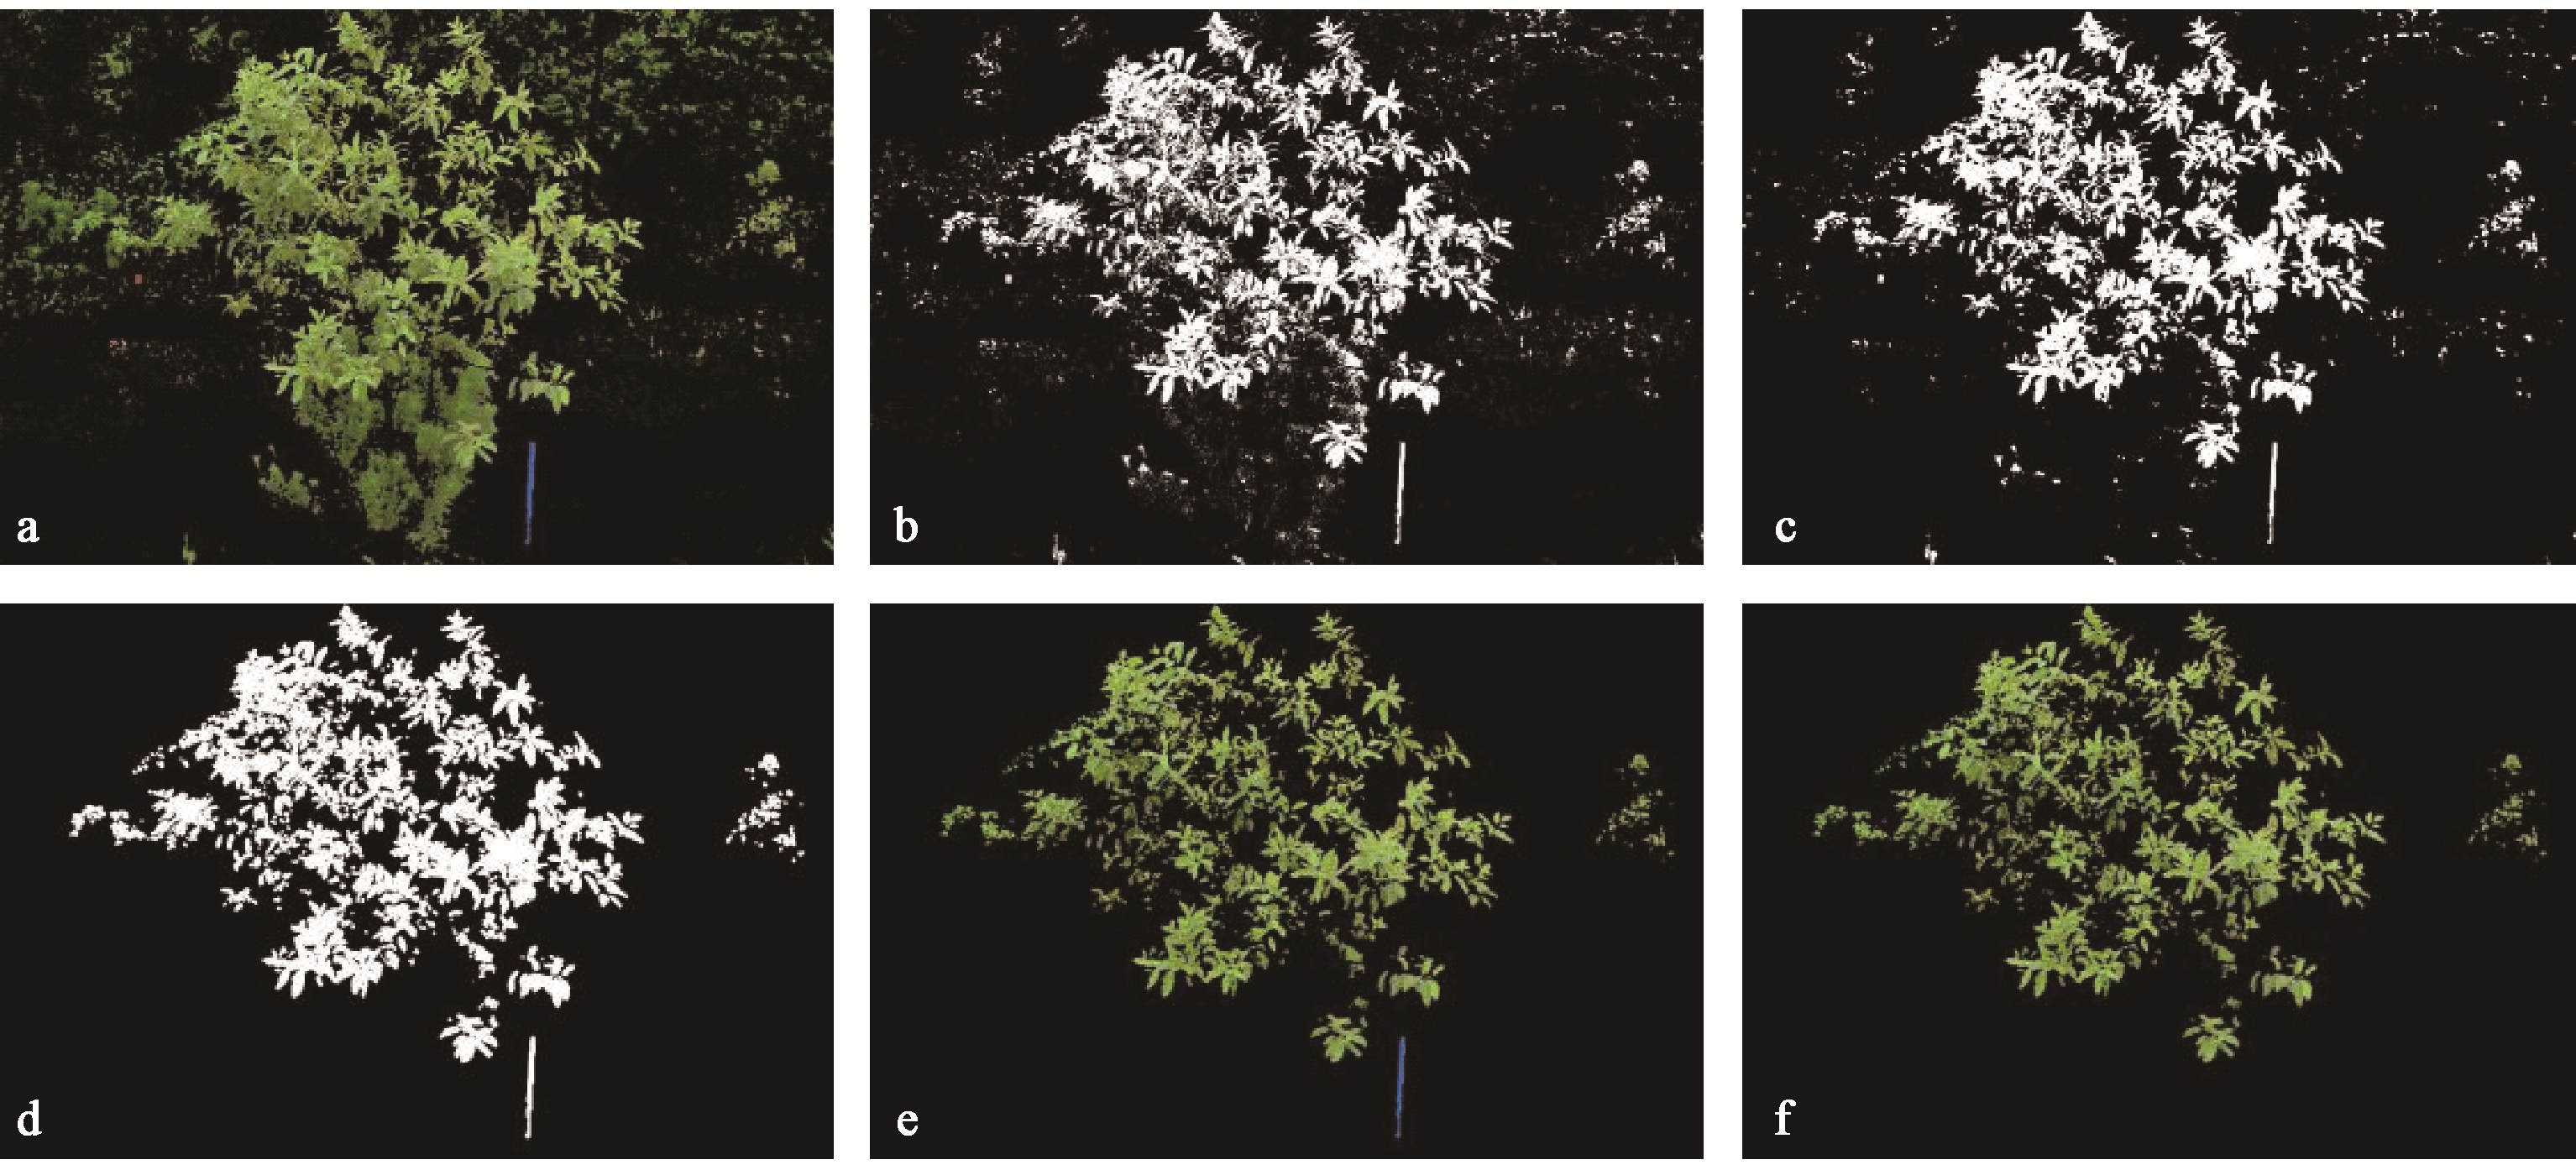
Table 3
Segmentation method evaluation proposed in this paper"
| 处理方法 Method | 像素数误差 Pixel number error (%) | R均值 R mean value | 误差 Error (%) | G均值 G mean value | 误差 Error (%) | B均值 B mean value | 误差 Error (%) |
| M | 2.16 | 143.87 | 0.23 | 157.88 | 0.56 | 67.75 | 0.70 |
| PS | 143.54 | 157.00 | 67.27 | ||||
| M | 2.98 | 163.70 | 1.67 | 183.02 | 0.36 | 77.05 | 1.03 |
| PS | 163.14 | 183.68 | 77.85 | ||||
| M | 3.67 | 165.86 | 0.47 | 186.16 | 0.41 | 79.19 | 0.94 |
| PS | 166.64 | 185.39 | 79.94 | ||||
| M | 2.73 | 184.78 | 0.66 | 202.62 | 0.82 | 106.48 | 1.11 |
| PS | 185.99 | 204.28 | 105.29 | ||||
| M | 4.28 | 160.92 | 1.64 | 193.40 | 0.47 | 99.49 | 1.97 |
| PS | 158.28 | 192.48 | 101.45 |
Table 4
Prediction models of soil available nitrogen and fitting effect of modeling data in sandalwood in different levels (n=50)"
| 施氮水平 Nitrogen application level | 颜色系统 Color system | 预测模型 Prediction model | 决定系数 R2 | 残差方差 δ2 | 均方根误差 RMSE |
| 水平1 Level 1 | RGB | y=C1R2+C2R+C3G2+C4G+C5B2+C6B+C0 | 0.73 | 2.48 | 1.94 |
| HSI | y=C1H2+C2H+C3S2+C4S+C5I2+C6I+C0 | 0.72 | 3.95 | 2.80 | |
| Lab | y=C1L2+C2L+C3a2+C4a+C5b2+C6b+C0 | 0.80 | 0.60 | 0.76 | |
| 水平2 Level 2 | RGB | y=C1R2+C2R+C3G2+C4G+C5B2+C6B+C0 | 0.78 | 8.94 | 2.88 |
| HSI | y=C1H2+C2H+C3S2+C4S+C5I2+C6I+C0 | 0.72 | 10.93 | 4.19 | |
| Lab | y=C1L2+C2L+C3a2+C4a+C5b2+C6b+C0 | 0.81 | 6.49 | 2.99 | |
| 水平3 Level 3 | RGB | y=C1R2+C2R+C3G2+C4G+C5B2+C6B+C0 | 0.80 | 85.29 | 9.02 |
| HSI | y=C1H2+C2H+C3S2+C4S+C5I2+C6I+C0 | 0.73 | 119.38 | 15.38 | |
| Lab | y=C1L2+C2L+C3a2+C4a+C5b2+C6b+C0 | 0.79 | 57.93 | 4.98 |
Table 5
Independent sample test results of validation data under different levels (n=30)"
| 施氮水平 Nitrogen application level | 颜色系统 Color system | 平均误差 ME | 平均绝对误差 MAE | 平均百分比误差 M%E(%) | 平均绝对百分比误差 MA%E(%) | 排名 Rank |
| 水平1 Level 1 | RGB | 0.42 | 0.69 | 12.89 | 16.96 | 2 |
| HSI | 0.83 | 1.20 | 14.05 | 17.88 | 3 | |
| Lab | 0.47 | 0.58 | 12.93 | 15.46 | 1 | |
| 水平2 Level 2 | RGB | 0.97 | 2.48 | 6.91 | 11.25 | 2 |
| HSI | 1.46 | 2.99 | 7.77 | 13.64 | 3 | |
| Lab | 0.51 | 1.81 | 7.24 | 10.89 | 1 | |
| 水平3 Level 3 | RGB | 6.82 | 10.50 | 14.48 | 22.49 | 2 |
| HSI | 13.83 | 15.38 | 16.49 | 25.93 | 3 | |
| Lab | 3.29 | 7.62 | 12.96 | 19.12 | 1 |
Table 6
Prediction model of available nitrogen in soil for sandalwood soil in the form of dumb variable"
| 颜色系统 Color system | 预测模型 Prediction model | 拟合数据 Modeling data (n=160) | 验证数据 Validation data (n=80) | ||||||
| R2 | δ2 | RMSE | ME | MAE | M%E(%) | MA%E(%) | |||
| Lab | y=(C1K1+C2K2)L2+(C3K1+C4K2)L+(C5K1+C6K2)a2+(C7K1+C8K2)a+(C9K1+C10K2)b2+(C11K1+C12K2)b+c0 | 0.78 | 6.54 | 2.13 | 1.63 | 4.18 | 7.03 | 17.33 | |
Table 7
Parameter estimation of the best prediction model under different nitrogen application levels"
| 施氮水平 Nitrogen application level | 参数估计 Parameter estimation | 参数 Parameters | |||||||||||||
| C1 | C2 | C3 | C4 | C5 | C6 | C7 | C8 | C9 | C10 | C11 | C12 | C0 | — | ||
| 全水平(哑变量方法) All levels (dumb variable method) | 估计值Estimated value | 0.04 | 0.10 | -1.95 | -43.75 | 0.60 | -0.95 | -121.17 | 190.85 | -0.22 | 0.17 | 74.70 | -56.17 | -2.57 | — |
| 标准误Standard error | 0.08 | 0.09 | 33.41 | 37.46 | 0.50 | 0.55 | 99.59 | 108.77 | 0.11 | 0.11 | 36.91 | 38.92 | 16.34 | — | |
| P | < 0.001 | < 0.001 | 0.004 | 0.007 | < 0.001 | < 0.001 | 0.014 | 0.016 | < 0.001 | < 0.001 | 0.003 | 0.002 | < 0.001 | — | |
Table 8
Prediction model of soil available nitrogen in sandalwood in all levels"
| 颜色系统 Color system | 预测模型 Prediction model | 拟合数据 Modeling data (n=160) | 验证数据 Validation data (n=80) | 排名 Rank | ||||||
| R2 | δ2 | RMSE | ME | MAE | M%E(%) | MA%E(%) | ||||
| RGB | y=a1R2+a2R+a3G2+a4G+a5B2+a6B+a0 | 0.74 | 17.70 | 3.39 | 1.94 | 3.93 | 9.87 | 20.48 | 2 | |
| HSI | y=a1H2+a2H+a3S2+a4S+a5I2+a6I+a0 | 0.75 | 15.07 | 3.73 | 1.97 | 5.04 | 9.38 | 20.24 | 3 | |
| Lab | y=a1L2+a2L+a3a2+a4a+a5b2+a6b+a0 | 0.76 | 9.65 | 2.96 | 1.79 | 4.50 | 8.84 | 18.39 | 1 | |
Table 9
Parameter estimation of the best prediction model under all nitrogen application levels"
| 施氮水平 Nitrogen application level | 参数估计 Parameter estimation | 参数 Parameters | ||||||
| C1 | C2 | C3 | C4 | C5 | C6 | C0 | ||
| 全水平All levels | 估计值Estimated value | 0.07 | -30.38 | 0.76 | -146.99 | 0.11 | -38.11 | 13 687.96 |
| 标准误Standard error | 0.05 | -23.93 | -1.09 | -95.32 | 0.63 | 1.04 | 9 658.18 | |
| P | < 0.001 | < 0.001 | < 0.001 | 0.007 | < 0.001 | < 0.001 | 0.039 | |

Fig.4
Residual plot of models"

|
白金顺, 曹卫东, 熊静, 等. 应用数码相机进行绿肥翻压后春玉米氮素营养诊断和产量预测. 光谱学与光谱分析, 2013. 33 (12): 3334- 3338.
doi: 10.3964/j.issn.1000-0593(2013)12-3334-05 |
|
|
Bai J S , Cao W D , Xiong J , et al. Nitrogen status diagnosis and yield prediction of spring maize after green manure incorporation by using a digital camera. Spectroscopy and Spectral Analysis, 2013. 33 (12): 3334- 3338.
doi: 10.3964/j.issn.1000-0593(2013)12-3334-05 |
|
| 陈佳悦, 姚霞, 黄芬, 等. 基于图像处理的冬小麦氮素监测模型. 农业工程学报, 2016. 32 (4): 163- 170. | |
| Chen J Y , Yao X , Huang F , et al. N status monitoring model in winter wheat based on image processing. Transactions of the Chinese Society of Agricultural Engineering, 2016. 32 (4): 163- 170. | |
| 崔日鲜, 刘亚东, 付金东. 基于机器学习和可见光光谱的冬小麦叶片氮积累量估算. 光谱学与光谱分析, 2016. 36 (6): 1837- 1842. | |
| Cui R X , Liu Y D , Fu J D . Estimation of winter wheat leaf nitrogen accumulation using machine learning algorithm and visible spectral. Spectroscopy and Spectral Analysis, 2016. 36 (6): 1837- 1842. | |
| 戴天虹, 王玉珏, 赵贝贝. 基于HSI三分量独立性木材缺陷图像分割. 机电产品开发与创新, 2009. 22 (6): 110- 112. | |
| Dai T H , Wang Y J , Zhao B B . Wood defect image segmentation based on HSI three independent characters. Development & Innovation of Machinery & Electrical Products, 2009. 22 (6): 110- 112. | |
| 刁智华, 王欢, 宋寅卯, 等. 复杂背景下棉花病叶害螨图像分割方法. 农业工程学报, 2013. 29 (5): 148- 152. | |
| Diao Z H , Wang H , Song Y M , et al. Segmentation method for cotton mite disease image under complex background. Transactions of the Chinese Society of Agricultural Engineering, 2013. 29 (5): 148- 152. | |
|
顾清, 邓劲松, 陆超, 等. 基于光谱和形状特征的水稻扫描叶片氮素营养诊断. 农业机械学报, 2012. 43 (8): 170- 174.
doi: 10.6041/j.issn.1000-1298.2012.08.031 |
|
|
Gu Q , Deng J S , Lu C , et al. Diagnosis of rice nitrogen nutrition based on spectral and shape characteristics of scanning leaves. Transactions of the Chinese Society for Agricultural Machinery, 2012. 43 (8): 170- 174.
doi: 10.6041/j.issn.1000-1298.2012.08.031 |
|
|
郭威, 张彦娥, 朱景福, 等. 玉米冠层叶片氮素营养估测研究——基于近地多光谱图像. 农机化研究, 2011. (10): 31- 34.
doi: 10.3969/j.issn.1003-188X.2011.10.008 |
|
|
Guo W , Zhang Y E , Zhu J F , et al. The research of estimating the maize canopy's nitrogen content-based on near-ground multi-spectral image. Journal of Agricultural Mechanization Research, 2011. (10): 31- 34.
doi: 10.3969/j.issn.1003-188X.2011.10.008 |
|
| 黄巧义, 张木, 黄旭, 等. 基于可见光谱色彩指标Otsu法的水稻冠层图像分割. 广东农业科学, 2018. 45 (1): 120- 125. | |
| Huang Q Y , Zhang M , Huang X , et al. Segmentation of rice canopy image using the Otsu method based on visual spectral image color related indices. Guangdong Agricultural Sciences, 2018. 45 (1): 120- 125. | |
|
贾良良, 范明生, 张福锁, 等. 应用数码相机进行水稻氮素营养诊断. 光谱学与光谱分析, 2009. 29 (8): 2176- 2179.
doi: 10.3964/j.issn.1000-0593(2009)08-2176-04 |
|
|
Jia L L , Fan M S , Zhang F S , et al. Nitrogen status diagnosis of rice by using a digital camera. Spectroscopy and Spectral Analysis, 2009. 29 (8): 2176- 2179.
doi: 10.3964/j.issn.1000-0593(2009)08-2176-04 |
|
| 李存军, 王纪华, 刘良云, 等. 基于数字照片特征的小麦覆盖度自动提取研究. 浙江大学学报:农业与生命科学版, 2004. 30 (6): 650- 656. | |
| Li C J , Wang J H , Liu L Y , et al. Automated digital image analyses estimating percent ground cover of winter wheat based on object features. Journal of Zhejiang University:Agricuture & Life Science, 2004. 30 (6): 650- 656. | |
|
李凤日. 长白落叶松人工林树冠形状的模拟. 林业科学, 2004. 40 (5): 16- 24.
doi: 10.3321/j.issn:1001-7488.2004.05.003 |
|
|
Li F R . Modeling crown profile of Larix olgensis trees. Scientia Silvae Sinicae, 2004. 40 (5): 16- 24.
doi: 10.3321/j.issn:1001-7488.2004.05.003 |
|
| 李红军, 张立周, 陈曦鸣, 等. 应用数字图像进行小麦氮素营养诊断中图像分析方法的研究. 中国生态农业学报, 2011. 19 (1): 155- 159. | |
| Li H J , Zhang L Z , Chen X M , et al. Image analysis method in application of digital image on diagnosing wheat nitrogen status. Chinese Journal of Eco-Agriculture, 2011. 19 (1): 155- 159. | |
| 李岚涛, 张萌, 任涛, 等. 应用数字图像技术进行水稻氮素营养诊断. 植物营养与肥料学报, 2015. 21 (1): 259- 268. | |
| Li L T , Zhang M , Ren T , et al. Diagnosis of N nutrition of rice using digital image processing technique. Journal of Plant Nutrition and Fertilizer, 2015. 21 (1): 259- 268. | |
| 李朝东, 崔国贤, 谢宁, 等. 应用数字图像技术诊断苎麻氮素营养的研究简报. 植物营养与肥料学报, 2011. 17 (3): 767- 772. | |
| Li Z D , Cui G X , Xie N , et al. Research notes on N status diagnosis of ramie by using digitial image technology. Plant Nutrition and Fertilizer Science, 2011. 17 (3): 767- 772. | |
| 刘小金, 徐大平, 杨曾奖, 等. 几种生长调节剂对幼龄檀香生长、心材形成和精油成分的影响. 林业科学, 2013. 49 (7): 143- 149. | |
| Liu X J , Xu D P , Yang Z J , et al. Effects of plant growth regulators on growth, heartwood formation and oil composition of young Santalum album. Scientia Silvae Sinicae, 2013. 49 (7): 143- 149. | |
| 庞晓敏, 闵子建, 阚江明. 基于HIS和LAB颜色空间的彩色图像分割. 广西大学学报:自然科学版, 2011. 36 (6): 976- 980. | |
| Pang X M , Min Z J , Kan J M . Color image segmentation based on HIS and LAB color space. Journal of Guangxi University:Natural Science Edition, 2011. 36 (6): 976- 980. | |
| 屈卫群, 王绍华, 陈兵林, 等. 棉花主茎叶SPAD值与氮素营养诊断研究. 作物学报, 2007. 33 (6): 1010- 1017. | |
| Qu W Q , Wang S H , Chen B L , et al. SPAD value of cotton leaves on main stem and nitrogen diagnosis for cotton growth. Acta Agronomica Sinica, 2007. 33 (6): 1010- 1017. | |
|
孙红, 文瑶, 赵毅, 等. 基于图像颜色特征的密植冬小麦覆盖指数反演. 农业机械学报, 2015. 46 (s1): 240- 245.
doi: 10.6041/j.issn.1000-1298.2015.S0.039 |
|
|
Sun H , Wen Y , Zhao Y , et al. Retrieving vegetation coverage index of winter wheat based on image colour characteristic. Chinese Society for Agricultural Machinery, 2015. 46 (s1): 240- 245.
doi: 10.6041/j.issn.1000-1298.2015.S0.039 |
|
|
孙慧贤, 张玉华, 罗飞路. 基于HIS颜色空间的彩色边缘检验方法研究. 光学技术, 2009. 35 (2): 221- 228.
doi: 10.3321/j.issn:1002-1582.2009.02.005 |
|
|
Sun H X , Zhang Y H , Luo F L . Color edge detection based on HSI color space. Optical Technique, 2009. 35 (2): 221- 228.
doi: 10.3321/j.issn:1002-1582.2009.02.005 |
|
|
王可, 陆长德, 乐万德, 等. 基于Lab均匀色彩空间的色彩调和系统. 西北工业大学学报, 2004. 22 (6): 695- 699.
doi: 10.3969/j.issn.1000-2758.2004.06.004 |
|
|
Wang K , Lu C D , Le W D , et al. Color harmony system based on lab perceptual uniform color space. Journal of Northwestern Polytechnical University, 2004. 22 (6): 695- 699.
doi: 10.3969/j.issn.1000-2758.2004.06.004 |
|
|
王远, 王德建, 张刚, 等. 基于数码相机的水稻冠层图像分割及氮素营养诊断. 农业工程学报, 2012. 28 (17): 131- 136.
doi: 10.3969/j.issn.1002-6819.2012.17.019 |
|
|
Wang Y , Wang D J , Zhang G , et al. Digital camera-based image segmentation of rice canopy and diagnosis of nitrogen nutrition. Transactions of the Chinese Society of Agricultural Engineering, 2012. 28 (17): 131- 136.
doi: 10.3969/j.issn.1002-6819.2012.17.019 |
|
|
杨转. 基于HSI颜色模型的杂草与土壤背景分割方法研究. 河北农业大学学报, 2011. 34 (4): 124- 127.
doi: 10.3969/j.issn.1000-1573.2011.04.026 |
|
|
Yang Z . Research on the segmentation method for identifying weed from soil background based on HSI color-space. Journal of Agricultural University of Hebei, 2011. 34 (4): 124- 127.
doi: 10.3969/j.issn.1000-1573.2011.04.026 |
|
|
袁媛, 李淼, 陈晟, 等. 复杂背景黄瓜叶部病害图像分割方法. 农业机械学报, 2013. 44 (10): 233- 237.
doi: 10.6041/j.issn.1000-1298.2013.10.037 |
|
|
Yuan Y , Li M , Chen S , et al. Segmentation of cucumber leaf disease images with complex background. Transactions of the Chinese Society for Agricultural Machinery, 2013. 44 (10): 233- 237.
doi: 10.6041/j.issn.1000-1298.2013.10.037 |
|
|
张培松, 孙毅明, 郭彭涛, 等. 基于数字图像分析技术的橡胶树叶片氮含量预测. 热带作物学报, 2015. 36 (12): 2120- 2124.
doi: 10.3969/j.issn.1000-2561.2015.12.002 |
|
|
Zhang P S , Sun Y M , Guo P T , et al. Study on predicting nitrogen content of rubber tree leaf by digital image analysis. Chinese Journal of Tropical Crops, 2015. 36 (12): 2120- 2124.
doi: 10.3969/j.issn.1000-2561.2015.12.002 |
|
|
张振升, 朱名日. 基于HIS颜色空间的蔗糖结晶图像分割方法. 计算机工程与应用, 2011. 47 (11): 190- 193.
doi: 10.3778/j.issn.1002-8331.2011.11.054 |
|
|
Zhang Z S , Zhu M R . Image segmentation method for sucrose-crystallizing based on HIS color space. Computer Engineering and Applications, 2011. 47 (11): 190- 193.
doi: 10.3778/j.issn.1002-8331.2011.11.054 |
|
|
祝锦霞, 邓劲松, 石媛媛, 等. 基于水稻扫面叶片图像特征的氮素营养诊断研究. 光谱学与光谱分析, 2009. 29 (8): 2171- 2175.
doi: 10.3964/j.issn.1000-0593(2009)08-2171-05 |
|
|
Zhu J X , Deng J S , Shi Y Y , et al. Diagnoses of rice nitrogen status based on characteristics of scanning leaf. Spectroscopy and Spectral Analysis, 2009. 29 (8): 2171- 2175.
doi: 10.3964/j.issn.1000-0593(2009)08-2171-05 |
|
|
Burdock G A , Carabin I G . Safety assessment of sandalwood oil (Santalum album L.). Food and Chemical Toxicology, 2008. 46 (2): 421- 432.
doi: 10.1016/j.fct.2007.09.092 |
|
|
Huang T , Ju X , Yang H . Nitrate leaching in a winter wheat-summer maize rotation on a calcareous soil as affected by nitrogen and straw management. Scientific Reports, 2017. 7, 42247.
doi: 10.1038/srep42247 |
|
| Lin F F , Qiu L F , Deng J S , et al. Investigation of SPAD meter-based indices for estimating rice nitrogen status. Computers and Electronics in Agriculture, 2010. 71 (suppl.1): 60- 65. | |
| Pagola M , Ortiz R , Irigoyen I , et al. New method to assess barley nitrogen nutrition status based on image colour analysis:comparison with SPAD-502. Computers & Electronics in Agriculture, 2009. 65 (2): 213- 218. | |
|
Ratnaningurm Y W N , Indrioko S . Response of flowering and seed production of sandalwood (Santalum album Linn., Santalaceae) to climate changes. Procedia Environmental Sciences, 2015. 28, 665- 576.
doi: 10.1016/j.proenv.2015.07.078 |
| Viewed | ||||||
|
Full text |
|
|||||
|
Abstract |
|
|||||