
Scientia Silvae Sinicae ›› 2023, Vol. 59 ›› Issue (10): 57-65.doi: 10.11707/j.1001-7488.LYKX20210872
• Research papers • Previous Articles Next Articles
Shuai Yu1,Tijiu Cai1,Pide Zhang2,Minglei Ren2,Haiyu Zhang2,Cunyong Ju1,*
Received:2021-11-30
Online:2023-10-25
Published:2023-11-01
Contact:
Cunyong Ju
CLC Number:
Shuai Yu,Tijiu Cai,Pide Zhang,Minglei Ren,Haiyu Zhang,Cunyong Ju. Scaling Effects of Edge Correction Methods on Spatial Structure Parameters[J]. Scientia Silvae Sinicae, 2023, 59(10): 57-65.
Table 1
Characteristics of species in the mixed hardwood/Korean pine plot"
| 树种 Species | 株数 Number of trees | 相对丰富度 Relative abundance(%) | 平均胸径 Mean DBH/cm | 平均树高 Mean height /m | 胸高断面积 Basal area of breast height/ (m2·hm?2) | 蓄积 Volume/ (m3·hm?2) | 树种组成系数 Coefficient of species composition |
| 白桦Betula platyphylla | 228 | 20.94 | 21.04 | 0.34 | 8.86 | 18.00 | 0.27 |
| 红松Pinus koraiensis | 94 | 8.63 | 17.96 | 0.54 | 3.08 | 6.35 | 0.10 |
| 冷杉Abies fabri | 202 | 18.55 | 19.56 | 0.55 | 7.88 | 18.14 | 0.28 |
| 鱼鳞云杉Picea jezoensis var. microsperma | 49 | 4.50 | 22.59 | 0.57 | 2.59 | 6.21 | 0.09 |
| 紫椴Tilia amurensis | 156 | 14.33 | 14.07 | 0.64 | 3.41 | 6.17 | 0.09 |
| 全样地Total plots | 1 089 | — | 16.60 | 12.60 | 31.69 | 65.63 | 1.00 |
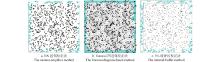
Fig.1
Edge correction results for the same survey plot (100 m×100 m) by three methods The black dots in all three images are tree locations, and the green parts are points removed by different correction methods."
Table 2
Judgment of the horizontal distribution pattern of forest stands at different scales"
| 校正方法 Correction method | 尺度 Scale | 株数 Number of trees | | | 下限 Low limit | 上限 Upper limits | 分布格局 Distribution patterns |
| 未校正 Uncorrected | 20 m×20 m | 43 | 0.549 | 0.034 | 0.434 | 0.566 | 随机Random |
| 30 m×30 m | 92 | 0.531 | 0.023 | 0.455 | 0.545 | 随机Random | |
| 40 m×40 m | 157 | 0.534 | 0.018 | 0.465 | 0.535 | 随机Random | |
| 60 m×60 m | 418 | 0.524 | 0.011 | 0.478 | 0.522 | 团状Clumped | |
| 80 m×80 m | 716 | 0.525 | 0.008 | 0.483 | 0.517 | 团状Clumped | |
| 100 m×100 m | 1 089 | 0.521 | 0.007 | 0.486 | 0.514 | 团状Clumped | |
| NN最近邻校正法 The nearest- neighbor method | 20 m×20 m | 18 | 0.570 | 0.051 | 0.401 | 0.599 | 随机Random |
| 30 m×30 m | 56 | 0.549 | 0.029 | 0.442 | 0.558 | 随机Random | |
| 40 m×40 m | 109 | 0.547 | 0.021 | 0.458 | 0.542 | 团状Clumped | |
| 60 m×60 m | 345 | 0.526 | 0.012 | 0.476 | 0.524 | 团状Clumped | |
| 80 m×80 m | 598 | 0.524 | 0.009 | 0.482 | 0.518 | 团状Clumped | |
| 100 m×100 m | 953 | 0.526 | 0.007 | 0.486 | 0.514 | 团状Clumped | |
| Voronoi图 近邻校正法 The Voronoi diagram-based method | 20 m×20 m | 18 | 0.592 | 0.051 | 0.400 | 0.600 | 随机Random |
| 30 m×30 m | 59 | 0.537 | 0.029 | 0.444 | 0.556 | 随机Random | |
| 40 m×40 m | 103 | 0.557 | 0.022 | 0.457 | 0.543 | 团状Clumped | |
| 60 m×60 m | 342 | 0.522 | 0.012 | 0.476 | 0.524 | 随机Random | |
| 80 m×80 m | 614 | 0.520 | 0.009 | 0.482 | 0.518 | 团状Clumped | |
| 100 m×100 m | 963 | 0.523 | 0.007 | 0.486 | 0.514 | 团状Clumped | |
| 5%缓冲区校正法 The internal buffer method | 20 m×20 m | 32 | 0.553 | 0.039 | 0.424 | 0.576 | 随机Random |
| 30 m×30 m | 72 | 0.547 | 0.026 | 0.449 | 0.551 | 随机Random | |
| 40 m×40 m | 127 | 0.541 | 0.020 | 0.461 | 0.539 | 团状Clumped | |
| 60 m×60 m | 337 | 0.527 | 0.012 | 0.476 | 0.524 | 团状Clumped | |
| 80 m×80 m | 579 | 0.523 | 0.009 | 0.482 | 0.518 | 团状Clumped | |
| 100 m×100 m | 903 | 0.526 | 0.008 | 0.485 | 0.515 | 团状Clumped |

Fig.2
Effect of edge correction on uniform angle index"
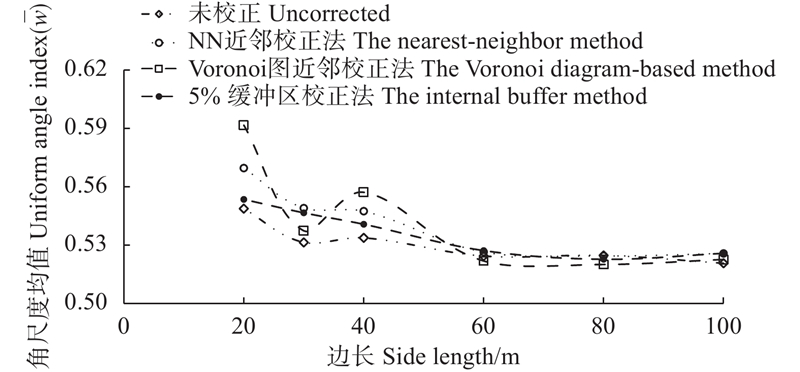

Fig.3
Effect of edge correction on size differentiation index"
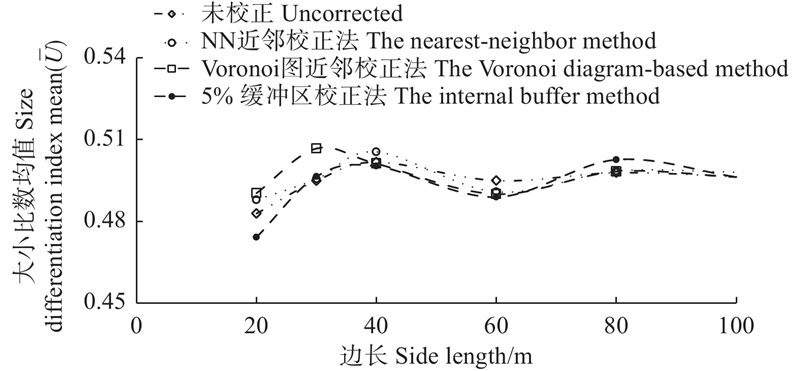
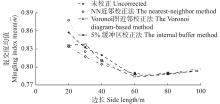
Fig.4
Effect of edge correction on mingling index"

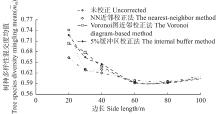
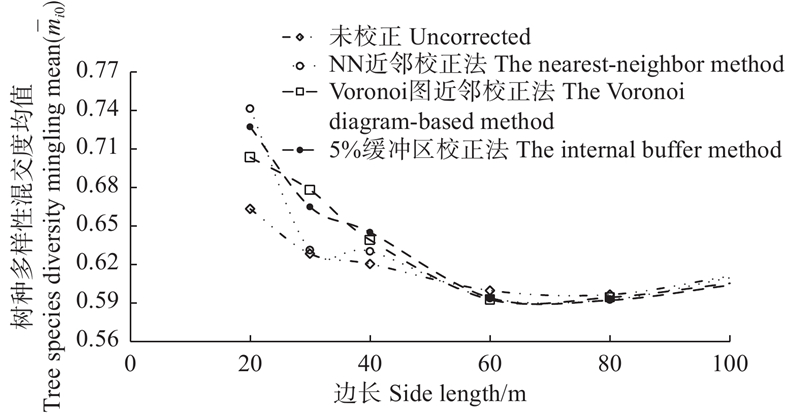
Fig.5
Effect of edge correction on tree species diversity mingling"
| 安慧君, 张 韬. 聚集指数边界效应的校正方法与应用. 南京林业大学学报(自然科学版), 2005, 29 (3): 57- 60. | |
| An H J, Zhang T. Studies on adjustment approach and its application of bounder effect on aggregation index. Journal of Nanjing Forestry University (Natural Sciences Edition), 2005, 29 (3): 57- 60. | |
| 曹小玉, 李际平. 林分空间结构指标研究进展. 林业资源管理, 2016, (4): 65- 73. | |
| Cao X Y, Li J P. Research progress on indicators of the stand spatial structure. Forest Resources Management, 2016, (4): 65- 73. | |
| 陈 军, 赵仁亮, 乔朝飞. 基于Voronoi图的GIS空间分析研究. 武汉大学学报(信息科学版), 2003, 28 (S1): 32- 37. | |
| Chen J, Zhao R L, Qiao C F. Voronoi diagram-based GIS spatial analysis. Geomatics and Information Science of Wuhan University, 2003, 28 (S1): 32- 37. | |
| 杜秀芳, 汤孟平, 郦 青, 等. 临安不同森林类型混交度的对比研究. 西南林业大学学报, 2019, 39 (3): 101- 108. | |
| Du X F, Tang M P, Li Q, et al. Comparative study on the mixed degree of different forest types in Lin’an. Journal of Southwest Forestry University, 2019, 39 (3): 101- 108. | |
| 高 伟, 黄雍容, 林建丽, 等. 濒危树种闽桦天然林优势种群种间相关性. 林业科学, 2021, 57 (10): 1- 14. | |
| Gao W, Huang Y R, Lin J L, et al. Interspecific correlations among dominant populations of natural forest of endangered species Betula fujianensis . Scientia Silvae Sinicae, 2021, 57 (10): 1- 14. | |
| 郝月兰, 张会儒, 唐守正. Voronoi图方法确定云冷杉林最近邻木的适用性研究. 林业资源管理, 2011, (6): 59- 64. | |
| Hao Y L, Zhang H R, Tang S Z. Study on the adaptability of Voronoi diagram on determining the nearest neighboring trees of natural mixed spruce-fir forests. Forest Resources Management, 2011, (6): 59- 64. | |
| 和敬渊, 王新杰, 郭韦韦, 等. 金沟岭林场两种天然起源的杨桦次生林空间结构特征. 东北林业大学学报, 2020, 48 (9): 1- 7. | |
| He J Y, Wang X J, Guo W W, et al. Spatial structure of two natural origin poplar-birch secondary forests in Jingouling forest farm. Journal of Northeast Forestry University, 2020, 48 (9): 1- 7. | |
| 胡艳波, 惠刚盈, 戚继忠, 等. 吉林蛟河天然红松阔叶林的空间结构分析. 林业科学研究, 2003, 16 (5): 523- 530. | |
| Hu Y B, Hui G Y, Qi J Z, et al. Analysis of the spatial structure of natural Korean pine broad leaved forest. Forest Research, 2003, 16 (5): 523- 530. | |
| 胡艳波, 惠刚盈, 王宏翔, 等. 随机分布的角尺度置信区间及其应用. 林业科学研究, 2014, 27 (3): 302- 308. | |
| Hu Y B, Hui G Y, Wang H X, et al. Uniform angle index (w) confidence interval of the random distribution and its application . Forest Research, 2014, 27 (3): 302- 308. | |
| 胡艳波, 惠刚盈. 一种新的基于混交度的林木种群分布格局测度方法. 北京林业大学学报, 2015, 37 (1): 9- 14. | |
| Hu Y B, Hui G Y. A new method for measuring population distribution patterns of forest trees based on the mingling degree. Journal of Beijing Forestry University, 2015, 37 (1): 9- 14. | |
|
惠刚盈, Von Gadow K, Albert M. 角尺度—一个描述林木个体分布格局的结构参数. 林业科学, 1999, 35 (1): 37- 42.
doi: 10.3321/j.issn:1001-7488.1999.01.006 |
|
|
Hui G Y, Von Gadow K, Albert M. The neighbourhood pattern: a new structure parameter for describing distribution of forest tree position. Scientia Silvae Sinicae, 1999, 35 (1): 37- 42.
doi: 10.3321/j.issn:1001-7488.1999.01.006 |
|
| 惠刚盈, 胡艳波, 陈伯望. 林木分布格局类型的角尺度均值分析方法. 生态学报, 2004, 24 (6): 1225- 1229. | |
| Hui G Y, Hu Y B, Chen B W. Characterizing forest spatial distribution pattern with the mean value of uniform angle index. Acta Ecologica Sinica, 2004, 24 (6): 1225- 1229. | |
| 惠刚盈, Von Gadow K, 赵中华, 等. 2016a. 结构化森林经营原理. 北京: 中国林业出版社, 3-5 | |
| Hui G Y, Von Gadow K, Zhao Z H, et al. 2016a. Principles of structurebased forest management. Beijing: China Forestry Publishing House, 3-5.[in Chinese] | |
| 惠刚盈, 胡艳波. 角尺度在林分空间结构调整中的应用. 林业资源管理, 2016b, (3): 1- 35. | |
| Hui G Y, Hu Y B. Application of neighborhood pattern in forest spatial structure regulation. Forest Resources Management, 2016b, (3): 1- 35. | |
|
惠刚盈, 赵中华, 张弓乔, 等. 基于角尺度的随机体在森林稳定性维持中的作用. 林业科学, 2021, 57 (2): 22- 30.
doi: 10.11707/j.1001-7488.20210203 |
|
|
Hui G Y, Zhao Z H, Zhang G Q, et al. The role of random structural pattern based on uniform angle index in maintaining forest stability. Scientia Silvae Sinicae, 2021, 57 (2): 22- 30.
doi: 10.11707/j.1001-7488.20210203 |
|
| 霍艳玲, 金 辉, 李永宁, 等. 冀北山地白桦典型大小比数与直径生长关系研究. 林业资源管理, 2014, (3): 71- 76. | |
| Huo Y L, Jin H, Li Y N, et al. Relationship between neighborhood comparison and diameter growth of secondary poplar-birch forest in the Mountains of north Hebei. Forest Resources Management, 2014, (3): 71- 76. | |
| 李际平, 封 尧, 赵春燕, 等. 基于Voronoi图的杉木生态公益林空间结构量化分析. 北京林业大学学报, 2014, 36 (4): 1- 7. | |
| Li J P, Feng Y, Zhao C Y, et al. Quantitative analysis of stand spatial structure of Cunninghamia lanceolata non-commercial forest based on Voronoi diagram . Journal of Beijing Forestry University, 2014, 36 (4): 1- 7. | |
| 李晓婷, 李 彤, 仇宽彪, 等. 城市森林林木斑块特征与降温效应的关系——以北京市城区为例. 林业科学, 2021, 57 (4): 32- 42. | |
| Li X T, Li T, Qiu K B, et al. Relationship between patterns of urban forest patches and their cooling effects: a case study of Beijing urban area. Scientia Silvae Sinicae, 2021, 57 (4): 32- 42. | |
|
刘 帅, 张 江, 李建军, 等. 森林空间结构分析中基于Voronoi图的样地边缘校正. 林业科学, 2017, 53 (1): 28- 37.
doi: 10.11707/j.1001-7488.20170104 |
|
|
Liu S, Zhang J, Li J J, et al. Edge correction of Voronoi diagram in forest spatial structure analysis. Scientia Silvae Sinicae, 2017, 53 (1): 28- 37.
doi: 10.11707/j.1001-7488.20170104 |
|
| 刘 月, 王 君, 杨雨春, 等. 不同林分密度胡桃楸胸径、树高、材积与冠幅关系. 森林工程, 2021, 37 (3): 28- 35. | |
| Liu Y, Wang J, Yang Y C, et al. Relationship between crown width and DBH, tree height or volume of Juglans mandshurica in stands of different density . Forest Engineering, 2021, 37 (3): 28- 35. | |
| 刘忠玲, 刘建明, 胡 伟, 等. 不同密度胡桃楸次生林枯落物和土壤持水特性的研究. 森林工程, 2021, 37 (3): 52- 59,66. | |
| Liu Z L, Liu J M, Hu W, et al. Water-holding characteristics of litter and soil of Juglans mandshurica natural secondary forest with different densities . Forest Engineering, 2021, 37 (3): 52- 59,66. | |
| 孟宪宇. 2007. 测树学. 北京: 中国林业出版社, 59 | |
| Meng X Y. 2007. Forest mensuration. Beijing: China Forestry Publishing House, 59[in Chinese] | |
| 邵国凡, 赵士洞, 舒噶特. 1995. 森林动态模拟: 兼论红松林的优化经营. 北京: 中国林业出版社, 47−49. | |
| Shao G F, Zhao S D, Shu G T. 1995. Forest dynamics simulation: optimal management of red pine forests. Beijing: China Forestry Publishing House, 47−49.[in Chinese] | |
|
宋语涵, 张 晨, 蔡体久, 等. 基于Voronoi图的阔叶红松林空间结构特征分析. 北京林业大学学报, 2021, 43 (1): 20- 26.
doi: 10.12171/j.1000-1522.20200056 |
|
|
Song Y H, Zhang C, Cai T J, et al. Quantitative analysis of spatial structural characteristics of broadleaved Korean pine forest based on Voronoi diagram. Journal of Beijing Forestry University, 2021, 43 (1): 20- 26.
doi: 10.12171/j.1000-1522.20200056 |
|
| 汤孟平, 唐守正, 雷相东, 等. Ripley's K(d)函数分析种群空间分布格局的边缘校正. 生态学报, 2003, 23 (8): 1533- 1538. | |
| Tang M P, Tang S Z, Lei X D, et al. Edge correction of Ripley's K(d) function on population spatial pattern analysis. Acta Ecologica Sinica, 2003, 23 (8): 1533- 1538. | |
| 汤孟平. 2003. 森林空间结构分析与优化经营模型研究. 北京: 北京林业大学. | |
| Tang M P. 2003. Analysis of forest spatial structure and study on optimal management model. Beijing: Beijing Forestry University.[in Chinese] | |
| 汤孟平, 唐守正, 雷相东, 等. 两种混交度的比较分析. 林业资源管理, 2004, (8): 25- 27. | |
| Tang M P, Tang S Z, Lei X D, et al. Comparison analysis on two minglings. Forest Resource Management, 2004, (8): 25- 27. | |
| 汤孟平. 森林空间结构研究现状与发展趋势. 林业科学, 2010, 46 (1): 117- 122. | |
| Tang M P. Advances in study of forest spatial structure. Scientia Silvae Sinicae, 2010, 46 (1): 117- 122. | |
| 万 盼, 刘文桢, 刘瑞红, 等. 结构化经营对栎松混交林林分空间结构及稳定性的影响. 林业科学, 2020, 56 (4): 35- 45. | |
| Wan P, Liu W Z, Liu R H, et al. Effects of structure-based forest management on stand space structure and its stability of mixed oak-pine forest. Scientia Silvae Sinicae, 2020, 56 (4): 35- 45. | |
| 魏红洋, 董灵波, 刘兆刚. 大兴安岭主要森林类型林分空间结构优化模拟. 应用生态学报, 2019, 30 (11): 3824- 3832. | |
| Wei H Y, Dong L B, Liu Z G. Spatial structure optimization simulation of main forest types in Great Xing’an Mountains, Northeast China. Chinese Journal of Applied Ecology, 2019, 30 (11): 3824- 3832. | |
| 夏富才, 姚大地, 赵秀海, 等. 长白山北坡阔叶红松林空间结构. 东北林业大学学报, 2009, 37 (10): 5- 7. | |
| Xia F C, Yao D D, Zhao X H, et al. Horizontal spatial structure of Korean pine broad-leaved forest in northern slope of Changbai Mountains. Journal of Northeast Forestry University, 2009, 37 (10): 5- 7. | |
| 辛 力. 2011. 森林抚育对不同林分类型结构及健康的影响研究. 杨凌: 西北农林科技大学. | |
| Xin L. 2011. Stuying the effects of thinning on the structure and health of different forest stand types. Yangling: Northwest Agriculture and Forestry University.[in Chinese] | |
|
张金屯. 植物种群空间分布的点格局分析. 植物生态学报, 1998, 22 (4): 344- 349.
doi: 10.3321/j.issn:1005-264X.1998.04.008 |
|
|
Zhang J T. An analysis of spatial point pattern for plant species. Acta Phytoecologica Sinica, 1998, 22 (4): 344- 349.
doi: 10.3321/j.issn:1005-264X.1998.04.008 |
|
|
赵中华, 惠刚盈, 胡艳波, 等. 结构化森林经营方法在阔叶红松林中的应用. 林业科学研究, 2013, 26 (4): 467- 472.
doi: 10.3969/j.issn.1001-1498.2013.04.012 |
|
|
Zhao Z H, Hui G Y, Hu Y B, et al. Application of structure-based forest management in broadleaved Korean pine mixed forest. Forest Research, 2013, 26 (4): 467- 472.
doi: 10.3969/j.issn.1001-1498.2013.04.012 |
|
| 周红敏, 惠刚盈, 赵中华, 等. 林分空间结构分析中样地边界木的处理方法. 林业科学, 2009, 45 (2): 1- 5. | |
| Zhou H M, Hui G Y, Zhao Z H, et al. Treatment methods of plot boundary trees in spatial forest structure analysis. Scientia Silvae Sinicae, 2009, 45 (2): 1- 5. | |
|
朱万才, 吴 瑶, 李亚洲, 等. 不同保留密度对落叶松水曲柳混交林的影响. 森林工程, 2021, 37 (2): 50- 56,94.
doi: 10.3969/j.issn.1006-8023.2021.02.008 |
|
|
Zhu W C, Wu Y, Li Y Z, et al. Effect of different reserve density on Larix gmelinii-Fraxinus mandshurica mixed forest . Forest Engineering, 2021, 37 (2): 50- 56,94.
doi: 10.3969/j.issn.1006-8023.2021.02.008 |
|
| Ali A. Forest stand structure and functioning: current knowledge and future challenges. Ecological Indicators, 2018, 98, 665- 677. | |
| Diggle P J. 2003. Statistical analysis of spatial point patterns. 2nd ed. New York: Oxford University Press Inc, 1−65. | |
|
Dong L B, Wei H Y, Liu Z G. Optimizing forest spatial structure with neighborhood-based indices: four case studies from northeast China. Forests, 2020, 11 (4): 413.
doi: 10.3390/f11040413 |
|
|
Ghalandarayeshi S, Nord-Larsen T, Johannsen V K, et al. Spatial patterns of tree species in Suserup Skov - a semi-natural forest in Denmark. Forest Ecology and Management, 2017, 406, 391- 401.
doi: 10.1016/j.foreco.2017.10.020 |
|
|
Lilleleht A, Sims A, Pommerening A. Spatial forest structure reconstruction as a strategy for mitigating edge-bias in circular monitoring plots. Forest Ecology and Management, 2014, 316, 47- 53.
doi: 10.1016/j.foreco.2013.08.039 |
|
| Nguyen H H. Erfanifard Y, Petritan I C. Nearest neighborhood characteristics of a tropical mixed broadleaved forest stand. Forests, 2018, 9 (33): 1- 14. | |
|
Põldveer E, Korjus H, Kiviste A, et al. Assessment of spatial stand structure of hemiboreal conifer dominated forests according to different levels of naturalness. Ecological Indicators, 2020, 110, 105944.
doi: 10.1016/j.ecolind.2019.105944 |
|
|
Pommerening A, Stoyan D. Edge-correction needs in estimating indices of spatial forest structure. Canadian Journal of Forest Research, 2006, 36 (7): 1723- 1739.
doi: 10.1139/x06-060 |
|
|
Pommerening A. Approaches to quantifying forest structures. Forestry:an International Journal of Forest Research, 2002, 75 (3): 305- 324.
doi: 10.1093/forestry/75.3.305 |
|
|
Radtke P J, Burkhart H E. A comparison of methods for edge-bias compensation. Canadian Journal of Forest Research, 1998, 28 (6): 942- 945.
doi: 10.1139/x98-062 |
|
| Von Gadow K, Hui G Y. 2001. Characterizing forest spatial structure and diversity. Proceedings of the SUROR International Workshop “Sustainable Forestry in Temperate Regions”, Sweden: Lund University, 20−30. |
| [1] | Chen Bing, Zhao Fengjun, Fan Taiyun, Wu Lijuan, Jiang Zhiquan, Zhao Shuang, Ye Jiangxia. Spatial Distribution of Forest Fire Prevention Comprehensive Obstructing Network in Xichang City [J]. Scientia Silvae Sinicae, 2023, 59(9): 127-138. |
| [2] | Rui Chen,Mengping Tang. Comparison of Spatial Structure between Coniferous and Broad-Leaved Mixed Forest and Evergreen Broad-Leaved Forest in Tianmu Mountains [J]. Scientia Silvae Sinicae, 2023, 59(5): 21-31. |
| [3] | Difei Chen,Mingyu Wang,Liqing Si,Fengjun Zhao,Wei Li,Weike Li,Lifu Shu. Temporal and Spatial Distribution Characteristics and the Influencing Factors of Lightning Fires in Sichuan [J]. Scientia Silvae Sinicae, 2023, 59(10): 32-40. |
| [4] | Weibin You,Ying Li,Yan Zhou,Dongjin He. Edge Effect of Pinus massoniana Forest Converted into Tea Plantation on Topsoil Carbon Content in Wuyishan National Park [J]. Scientia Silvae Sinicae, 2023, 59(10): 41-49. |
| [5] | Lin Li,Shiguang Wei,Wanhui Ye,Juyu Lian,Zhifeng Wen,Jinggang Zhou. Spatial Distribution Pattern and Spatial Association of Dominant Species Groups in a Subtropical Evergreen Broad-Leaved Forest [J]. Scientia Silvae Sinicae, 2022, 58(9): 16-24. |
| [6] | Jialin Su,Juan Wang,Chunyu Fan,Chunyu Zhang,Xiuhai Zhao. Neighborhood Competition Effect in Mixed Broadleaved-Conifer Forest in Jiaohe, Jilin Province [J]. Scientia Silvae Sinicae, 2022, 58(5): 187-194. |
| [7] | Cheng Wang,Haibo Li,Zhaohui Yang,Xing Bi,Han Fan,Haijun Su,Canshi Hu,Mingming Zhang. Temporal and Spatial Distribution Patterns of Rhinopithecus brelichi and Macaca thibetana in the Same Region of the Northeast Fanjingshan [J]. Scientia Silvae Sinicae, 2022, 58(3): 117-128. |
| [8] | Hong Xia,Chunyan Xia,Haiyan Song,Yu Du,Jianping Tao. Seed Rain, Soil Seed Bank, and Seedling Regeneration of Woody Plants in Three Karst Forest Communities on Jinfo Mountain, Chongqing [J]. Scientia Silvae Sinicae, 2022, 58(1): 1-11. |
| [9] | Xuan Hu,Ruijing Xu,Ze'an Shang,Qi Shu,Lianghua Qi. Spatial Distribution Characteristics of Dinochloa orenuda and Bonia levigata in Ganshiling, Hainan Island [J]. Scientia Silvae Sinicae, 2021, 57(8): 189-194. |
| [10] | Zhonghua Zhao,Gangying Hui. Advances in Structural Diversity of Stand Structure [J]. Scientia Silvae Sinicae, 2020, 56(9): 143-152. |
| [11] | Tao Sun,Zhiqing Jia,Hujun Liu,Wen Shang,Jiang Liu,Liheng Zhang. Spatial Pattern of Points Distribution of Sandpiles of Nitraria tangutorum Nebkhas at Different Developmental Stages in Desert-Oasis Ecotone of Minqin [J]. Scientia Silvae Sinicae, 2020, 56(7): 12-21. |
| [12] | Xiujin Yuan, Wenfa Xiao, Jingpin Lei, Lei Pan, Xiaorong Wang, Hongxia Cui, Wenjie Hu. Spatial Variability of Throughfall and Stemflow in Pinus massoniana Plantation in Three Gorges Reservoir Area [J]. Scientia Silvae Sinicae, 2020, 56(1): 10-19. |
| [13] | Liu Shuai, Li Jianjun, Li Dan, Zhu Kaiwen, Guo Rui, Wen Yijun, Ma Zhenyan. Comparison and Adaptability of Analytical Methods for Spatial Distribution Patterns in Forst [J]. Scientia Silvae Sinicae, 2019, 55(11): 73-84. |
| [14] | Qiu Ni, Xu Songjun, Qiu Penghua, Yang Wenhuai, Yang Xiu, Yang Qian. Community Distribution and Landscape Pattern of the Mangrove on the Qi'ao Island, Zhuhai [J]. Scientia Silvae Sinicae, 2019, 55(1): 1-10. |
| [15] | Zhou Wei, Wang Wenjie, He Xingyuan, Zhang Bo, Xiao Lu, Wang Qiong, Lü Hailiang, Wei Chenhui. Soil Fertility and Spatial Variability of Urban Green Land in Harbin [J]. Scientia Silvae Sinicae, 2018, 54(9): 9-17. |
| Viewed | ||||||
|
Full text |
|
|||||
|
Abstract |
|
|||||