
林业科学 ›› 2026, Vol. 62 ›› Issue (3): 48-60.doi: 10.11707/j.1001-7488.LYKX20250478
邓敏1,何怀江2,吴相菊3,张新娜1,张春雨1,赵秀海1,*( )
)
收稿日期:2025-07-27
修回日期:2026-01-15
出版日期:2026-03-15
发布日期:2026-03-12
通讯作者:
赵秀海
E-mail:zhaoxh@bjfu.edu.cn
基金资助:
Min Deng1,Huaijiang He2,Xiangju Wu3,Xinna Zhang1,Chunyu Zhang1,Xiuhai Zhao1,*()
Received:2025-07-27
Revised:2026-01-15
Online:2026-03-15
Published:2026-03-12
Contact:
Xiuhai Zhao
E-mail:zhaoxh@bjfu.edu.cn
摘要:
目的: 探究东北温带森林幼苗生物量分配权衡对生长的影响及其对邻体竞争和环境因子的响应,比较生物量分配性状和器官水平性状与幼苗生长的相关性,加深对幼苗生物量分配的认识和理解,为东北温带森林的群落调控机制和动态变化规律提供理论依据。方法: 基于吉林蛟河针阔混交林130个幼苗样方个体数据,采用主成分分析确定幼苗生物量分配的权衡关系,通过线性混合效应模型构建生物量分配权衡模型、幼苗生长模型以及生物量分配性状和器官水平性状的比较模型,分析生物量分配权衡、生物量分配性状和器官水平性状对幼苗生长的影响。结果: 1) 东北温带森林幼苗生物量分配权衡主要表现为2类:一是牺牲叶生物量的根生物量投资权衡,二是牺牲叶生物量和根生物量的茎生物量投资权衡。具体而言,随着土壤有机质含量减少,幼苗对根生物量的分配降低;随着林冠开阔度下降,幼苗对叶生物量的分配增加;在同种竞争和异种竞争共同作用下,幼苗会将生物量更多地分配给根或叶。2) 牺牲叶生物量的根生物量投资权衡对幼苗生长具有促进作用,而林冠开阔度及土壤全磷含量和土壤全钾含量则对幼苗生长产生负向影响。3) 与器官水平性状相比,生物量分配性状与幼苗生长的相关性更强,但幼苗生长率与比茎长、比叶面积、比根长等资源获取性状呈负相关。结论: 苗木生物量分配权衡对幼苗生长具有促进作用,相较于器官水平性状,生物量分配性状与幼苗生长的相关性更强,生物量分配在决定植物群落增长动态和资源吸收策略中发挥关键作用。
中图分类号:
邓敏,何怀江,吴相菊,张新娜,张春雨,赵秀海. 东北温带森林幼苗生长受生物量分配权衡和性状影响[J]. 林业科学, 2026, 62(3): 48-60.
Min Deng,Huaijiang He,Xiangju Wu,Xinna Zhang,Chunyu Zhang,Xiuhai Zhao. Effects of Biomass Allocation Trade-Offs and Traits of Temperate Forests in Northeast China on Seedling Growth[J]. Scientia Silvae Sinicae, 2026, 62(3): 48-60.
表1
吉林蛟河温带森林13种乔木幼苗的物种组成和平均高度"
| 树种 Tree species | 科 Family | 平均高 Mean height/cm |
| 白牛槭 Acer mandshuricum | 槭树科Aceraceae | 9.2 |
| 春榆Ulmus davidiana | 榆科Ulmaceae | 6.5 |
| 大果榆Ulmus macrocarpa | 榆科Ulmaceae | 12.3 |
| 红松Pinus koraiensis | 松科Pinaceae | 7.8 |
| 糠椴Tilia mandshurica | 锦葵科Malvaceae | 6.4 |
| 蒙古栎Quercus mongolica | 壳斗科Fagaceae | 12.7 |
| 拧筋槭Acer triflorum | 无患子科Sapindaceae | 12.1 |
| 千金榆Carpinus cordata | 桦木科Betulaceae | 5.5 |
| 青楷槭Acer tegmentosum | 无患子科Sapindaceae | 6.9 |
| 色木槭Acer pictum | 无患子科Sapindaceae | 9.3 |
| 水曲柳Fraxinus mandschurica | 木樨科Oleaceae | 8.0 |
| 杉松Abies holophylla | 松科Pinaceae | 7.0 |
| 紫椴Tilia amurensis | 锦葵科Malvaceae | 6.3 |
表2
功能性状的缩写、定义和单位"
| 性状类型 Trait types | 功能性状 Functional traits | 缩写 Abbreviation | 定义 Definition | |
| 生物量分配性状 | 叶质量分数 | LMF | 叶干质量与总干质量的比值 | g·g?1 |
| Biomass allocation traits | Leaf mass fraction | The ratio of leaf dry mass to total dry mass | ||
| 茎质量分数 | SMF | 茎干质量与总干质量的比值 | g·g?1 | |
| Stem mass fraction | The ratio of stem dry mass to total dry mass | |||
| 根质量分数 | RMF | 根干质量与总干质量的比值 | g·g?1 | |
| Root mass fraction | The ratio of root dry mass to total dry mass | |||
| 比茎长 | SSL | 茎长与茎干质量的比值 | cm·g?1 | |
| Specific stem length | The ratio of stem length to stem dry mass | |||
| 器官水平性状(叶) | 叶面积 | LA | 单叶叶片表面积 | cm2 |
| Organ-level traits (leaf) | Leaf area | Single leaf surface area | ||
| 比叶面积 | SLA | 单位干质量的叶面积 | cm2·g?1 | |
| Specific leaf area | Leaf surface area per dry mass | |||
| 叶片厚度 | LT | 单叶叶片厚度 | mm | |
| Leaf thickness | Single leaf thickness | |||
| 叶碳含量 | LCC | 单位叶片质量的碳含量 | % | |
| Leaf carbon content | Carbon content per leaf mass | |||
| 叶氮含量 | LNC | 单位叶片质量的氮含量 | % | |
| Leaf nitrogen content | Nitrogen content per leaf mass | |||
| 器官水平性状(根) | 比根长 | SRL | 根长与根干质量的比值 | cm·g?1 |
| Organ-level traits (root) | Specific root length | The ratio of root length to root dry mass | ||
| 比根面积 | SRA | 单位干质量的根表面积 | cm2·g?1 | |
| Specific root area | Root surface area per dry mass | |||
| 根平均直径 | RAD | 根的平均直径 | mm | |
| Root average diameter | Root mean diameter | |||
| 根组织密度 | RTD | 根干质量与根体积的比值 | g·cm?3 | |
| Root tissue density | The ratio of root dry mass to root volume |
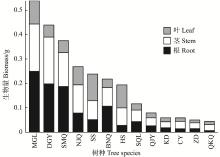
图1
吉林蛟河温带森林13个树种的幼苗生物量分配 MGL:蒙古栎Quercus mongolica;DGY:大果榆Ulmus macrocarpa;SMQ:色木槭Acer pictum;NJQ:拧筋槭Acer triflorum;SS:杉松Abies holophylla;BNQ:白牛槭Acer mandshuricum;HS:红松Pinus koraiensis;SQL:水曲柳Fraxinus mandschurica;QJY:千金榆Carpinus cordata;KD:糠椴Tilia mandshurica;CY:春榆Ulmus davidiana;ZD:紫椴Tilia amurensis;QKQ:青楷槭 Acer tegmentosum."
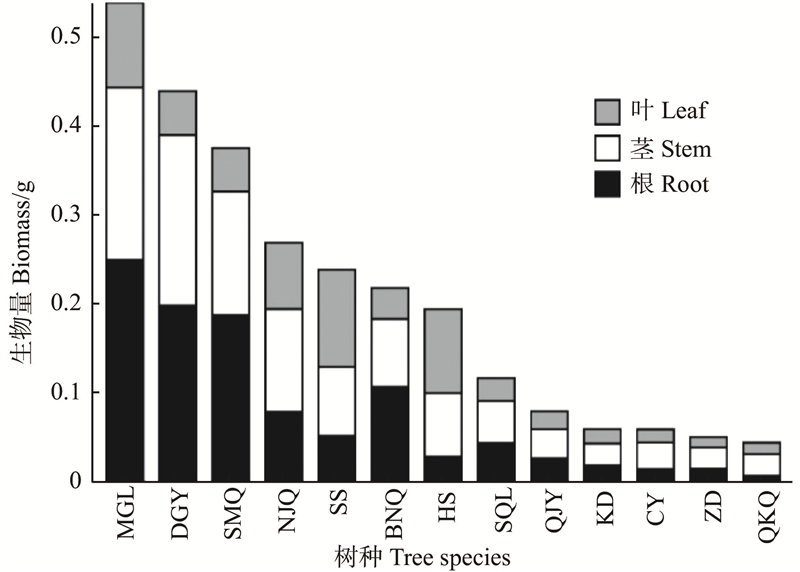
图2
吉林蛟河温带森林幼苗生物量分配性状的主成分分析"
表3
生物量分配权衡模型的AIC和决定系数"
| 模型 Models | 赤池信息准则 Akaike information criterion (AIC) | 边际R2 Marginal R2 | 条件R2 Conditional R2 |
| 无交互作用的PC1模型PC1 model without interaction | 0.058 | 0.591 | |
| 有交互作用的PC1模型PC1 model with interaction | 0.078 | 0.590 | |
| 无交互作用的PC2模型 PC2 model without interaction | 0.026 | 0.146 | |
| 有交互作用的PC2模型PC2 model with interaction | 0.067 | 0.161 |
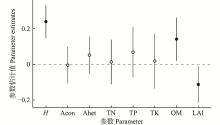
图3
PC1模型各参数估计值和95%置信区间 实心圆表示显著(P<0.05),空心圆表示不显著(P>0.05)。 Solid circles indicate significant (P<0.05), and hollow circles indicate insignificant (P>0.05). H:幼苗高度Seedling heigh;Acon:同种邻域指数Conspecific neighborhood index;Ahet:异种邻域指数Heterospecific neighborhood index;TN:土壤全氮含量Soil total nitrogen content;TP:土壤全磷含量Soil total phosphorus content;TK:土壤全钾含量Soil total potassium content;OM:土壤有机质含量Soil organic matter content;LAI:叶面积指数Leaf area index."
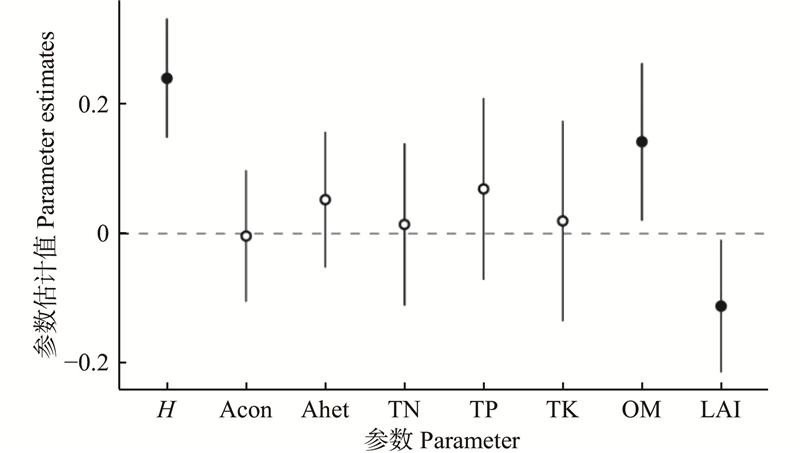
表4
包含交互作用的生物量分配权衡第二主成分轴(PC2)模型结果①"
| 变量Variables | 估计值Estimates | 标准误Standard error (SE) | t值t value | P值P value |
| 截距Intercept | 0.005 | 0.192 | 0.025 | 0.980 |
| 高度Height | –0.126 | 0.059 | –2.148 | 0.032* |
| 同种邻域指数Conspecific neighborhood index | –0.078 | 0.083 | –0.940 | 0.348 |
| 异种邻域指数Heterospecific neighborhood index | –0.066 | 0.063 | –1.055 | 0.294 |
| 土壤全氮含量Soil total nitrogen content | 0.122 | 0.080 | 1.533 | 0.132 |
| 土壤全磷含量Soil total phosphorus content | –0.105 | 0.160 | –0.658 | 0.513 |
| 土壤全钾含量Soil total potassium content | 0.048 | 0.193 | 0.249 | 0.804 |
| 土壤有机质含量Soil organic matter content | –0.057 | 0.079 | –0.723 | 0.473 |
| 叶面积指数Leaf area index | 0.070 | 0.062 | 1.144 | 0.257 |
| 同种邻域指数和异种邻域指数交互作用 Interaction between conspecific and heterospecific neighborhood indices | –0.137 | 0.076 | –1.803 | 0.072 |
| 土壤全氮含量和土壤全磷含量交互作用 Interaction between soil total nitrogen content and soil total phosphorus content | 0.023 | 0.091 | 0.247 | 0.805 |
| 土壤全氮含量和土壤全钾含量交互作用 Interaction between soil total nitrogen content and soil total potassium content | 0.293 | 0.116 | 2.518 | 0.017* |
| 土壤全氮含量和土壤有机质含量交互作用 Interaction between soil total nitrogen content and soil organic matter content | 0.033 | 0.063 | 0.522 | 0.603 |
| 土壤全氮含量和叶面积指数交互作用 Interaction between soil total nitrogen content and leaf area index | –0.057 | 0.075 | –0.764 | 0.447 |
| 土壤全磷含量和土壤全钾含量交互作用 Interaction between soil total phosphorus content and soil total potassium content | –0.030 | 0.199 | –0.148 | 0.883 |
| 土壤全磷含量和土壤有机质含量交互作用 Interaction between soil total phosphorus content and soil organic matter content | 0.111 | 0.100 | 1.106 | 0.272 |
| 土壤全磷含量和叶面积指数交互作用 Interaction between soil total phosphorus content and leaf area index | –0.043 | 0.095 | –0.455 | 0.650 |
| 土壤全钾含量和土壤有机质含量交互作用 Interaction between soil total potassium content and soil organic matter content | –0.028 | 0.125 | –0.226 | 0.823 |
| 土壤全钾含量和叶面积指数交互作用 Interaction between soil total potassium content and leaf area index | –0.006 | 0.103 | –0.056 | 0.955 |
| 土壤有机质含量和叶面积指数交互作用 Interaction between soil organic matter content and leaf area index | –0.050 | 0.064 | –0.782 | 0.436 |
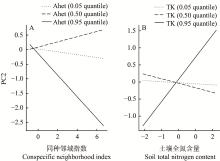
图4
交互作用对生物量分配权衡第二主成分轴(PC2)的影响 A:在异种邻域指数的不同分位数下,PC2随同种邻域指数的变化;B:在土壤全钾的不同分位数下,PC2随土壤全氮的变化。A: Variation in PC2 with conspecific neighbor index across quantiles of heterospecific neighbor index; B: Variation in PC2 with soil total nitrogen across quantiles of soil total potassium. Ahet (0.05 quantile):异种邻域指数5%分位数Heterospecific neighborhood index at the 0.05 quantile;Ahet (0.50 quantile):异种邻域指数50%分位数Heterospecific neighborhood index at the 0.50 quantile;Ahet (0.95 quantile):异种邻域指数95%分位数Heterospecific neighborhood index at the 0.95 quantile。TK (0.05 quantile):土壤全钾5%分位数Soil total potassium at the 0.05 quantile;TK (0.50 quantile):土壤全钾50%分位数Soil total potassium at the 0.50 quantile;TK (0.95 quantile):土壤全钾95%分位数Soil total potassium at the 0.95 quantile."
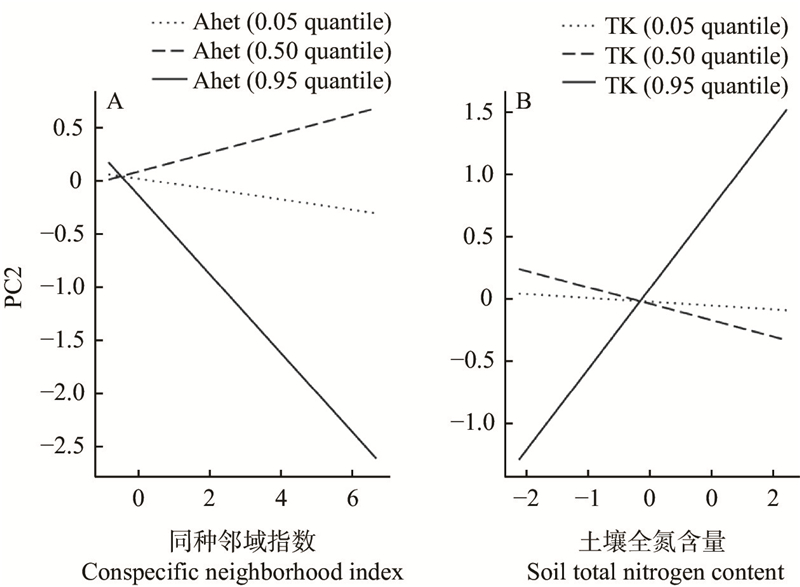
表5
幼苗生长模型的AIC和决定系数"
| 模型 Models | 赤池信息准则Akaike information criterion (AIC) | 边际R2 Marginal R2 | 条件R2 Conditional R2 |
| 无交互作用的生长模型 Growth model without interaction | 1 040.058 | 0.470 | 0.577 |
| 有交互作用的生长模型 Growth model with interaction | 1 036.887 | 0.501 | 0.569 |
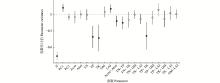
图5
生长模型各参数估计值和95%置信区间 实心圆表示显著(P<0.05),空心圆表示不显著(P>0.05)。 Solid circles indicate significant (P<0.05), and hollow circles indicate insignificant (P>0.05). PC1:生物量分配权衡第一主成分轴The first principal component axis of biomass allocation trade-offs;PC2:生物量分配权衡第二主成分轴The second principal component axis of biomass allocation trade-offs;H:幼苗高度Seedling height;Acon:同种邻域指数Conspecific neighborhood index;Ahet:异种邻域指数Heterospecific neighborhood index;TN:土壤全氮含量Soil total nitrogen content;TP:土壤全磷含量Soil total phosphorus content;TK:土壤全钾含量Soil total potassium content;OM:土壤有机质含量Soil organic matter content;LAI:叶面积指数Leaf area index;Acon×Ahet:同种邻域指数与异种邻域指数交互作用Interaction between conspecific and heterospecific neighborhood indices;TN×TP:土壤全氮含量与土壤全磷含量交互作用 Interaction between soil total nitrogen content and soil total phosphorus content;TN×TK:土壤全氮含量与土壤全钾含量交互作用Interaction between soil total nitrogen content and soil total potassium content;TN×OM:土壤全氮含量与土壤有机质含量交互作用Interaction between soil total nitrogen content and soil organic matter content;TN×LAI:土壤全氮含量与叶面积指数交互作用Interaction between soil total nitrogen content and leaf area index;TP×TK:土壤全磷含量与土壤全钾含量交互作用Interaction between soil total phosphorus content and soil total potassium content;TP×OM:土壤全磷含量与土壤有机质含量交互作用Interaction between soil total phosphorus content and soil organic matter content;TP×LAI:土壤全磷含量与叶面积指数交互作用Interaction between soil total phosphorus content and leaf area index;TK×OM:土壤全钾含量与土壤有机质含量交互作用Interaction between soil total potassium content and soil organic matter content;TK×LAI:土壤全钾含量与叶面积指数交互作用Interaction between soil total potassium content and leaf area index;OM×LAI:土壤有机质含量与叶面积指数交互作用Interaction between soil organic matter content and leaf area index."
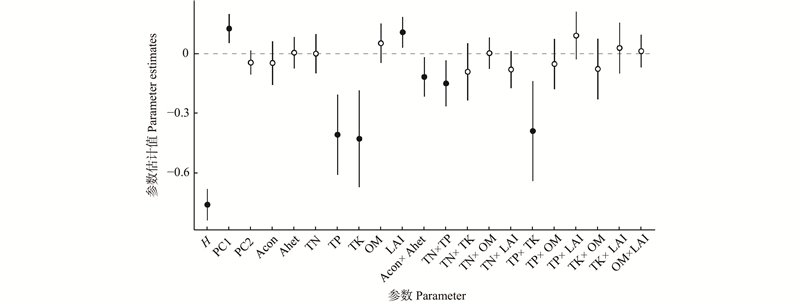
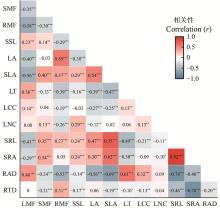
图6
幼苗功能性状之间的相关性和显著性 *:P<0.05;**:P<0.01;***:P<0.001. LMF:叶质量分数Leaf mass fraction;SMF:茎质量分数Stem mass fraction;RMF:根质量分数Root mass fraction;SSL:比茎长Specific stem length; LA:叶面积Leaf area;SLA:比叶面积Specific leaf area;LT:叶片厚度Leaf thickness;LCC:叶碳含量Leaf carbon content;LNC:叶氮含量Leaf nitrogen content;SRL:比根长Specific root length;SRA:比根面积Specific root area;RAD:根平均直径Root average diameter;RTD:根组织密度Root tissue density."


图7
比较模型中各功能性状参数估计值和95%置信区间 •: P<0.1;*:P<0.05;**:P<0.01;***:P<0.001. LMF:叶质量分数Leaf mass fraction;SMF:茎质量分数Stem mass fraction;RMF:根质量分数Root mass fraction;SSL:比茎长Specific stem length; LA:叶面积Leaf area;SLA:比叶面积Specific leaf area;LT:叶片厚度Leaf thickness;LCC:叶碳含量Leaf carbon content;LNC:叶氮含量Leaf nitrogen content;SRL:比根长Specific root length;SRA:比根面积Specific root area;RAD:根平均直径Root average diameter;RTD:根组织密度Root tissue density."
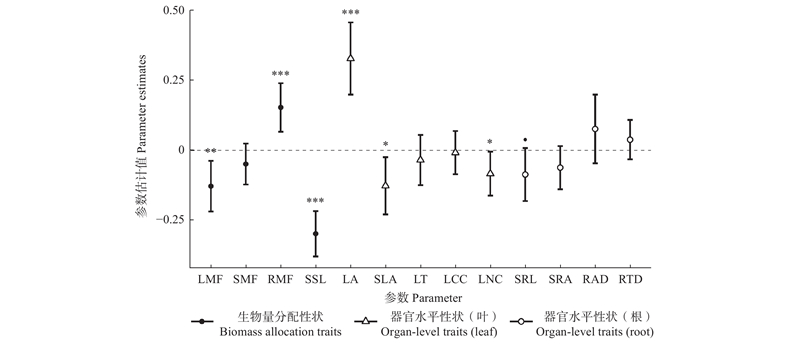
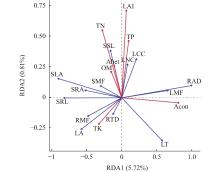
图8
邻体竞争和环境因子与功能性状的冗余分析 红色箭头表示解释变量,蓝色箭头表示响应变量。矢量线之间的夹角表示相应变量之间的相关性:锐角表示正相关,锐角越小代表正相关性越强;钝角表示负相关,钝角越大代表负相关性越强;直角表示无相关性。The red arrows represent explanatory variables, and the blue arrows represent response variables. The angle between vector lines indicates the correlation between the corresponding variables: an acute angle represents a positive correlation, with a smaller acute angle indicating a stronger positive correlation; an obtuse angle represents a negative correlation, with a larger obtuse angle indicating a stronger negative correlation; a right angle indicates no correlation. Acon:同种邻域指数Conspecific neighborhood index;Ahet:异种邻域指数Heterospecific neighborhood index;TN:土壤全氮含量Soil total nitrogen content;TP:土壤全磷含量Soil total phosphorus content;TK:土壤全钾含量Soil total potassium content;OM:土壤有机质含量Soil organic matter content;LAI:叶面积指数Leaf area index. LMF:叶质量分数Leaf mass fraction;SMF:茎质量分数Stem mass fraction;RMF:根质量分数Root mass fraction;SSL:比茎长Specific stem length;LA:叶面积Leaf area;SLA:比叶面积Specific leaf area;LT:叶片厚度Leaf thickness;LCC:叶碳含量Leaf carbon content;LNC:叶氮含量Leaf nitrogen content;SRL:比根长Specific root length;SRA:比根面积Specific root area;RAD:根平均直径Root average diameter;RTD:根组织密度Root tissue density."
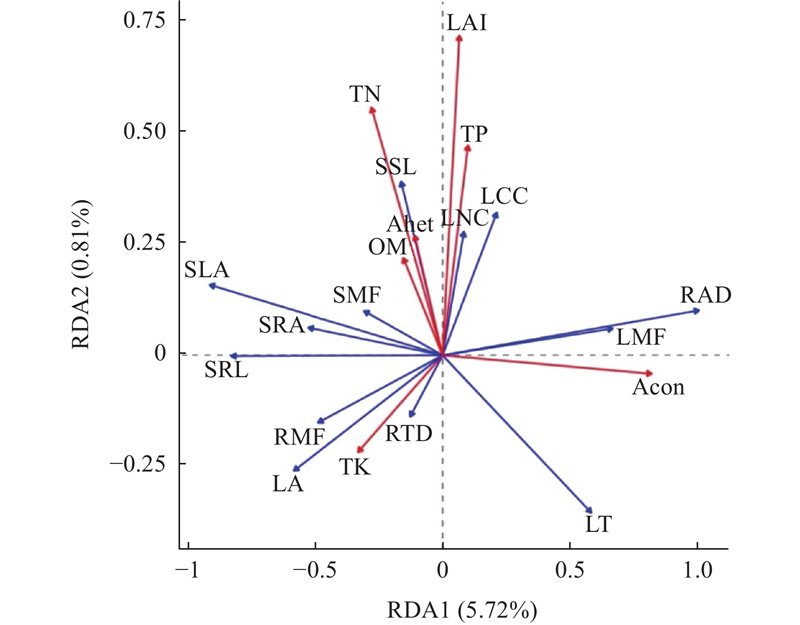
表6
RDA 排序轴上各变量的载荷值、贡献率、F值和P值①"
| 变量Variables | RDA1 | RDA2 | 贡献 Contributions (%) | F | P |
| 同种邻域指数Conspecific neighborhood index | 0.823 | 0.041 | 36.99 | 19.104 | <0.001*** |
| 异种邻域指数Heterospecific neighborhood index | –0.110 | –0.270 | 3.64 | 1.912 | 0.092 |
| 土壤全氮含量Soil total nitrogen content | –0.280 | –0.557 | 16.99 | 2.817 | 0.027* |
| 土壤全磷含量Soil total phosphorus content | 0.100 | –0.472 | 9.68 | 3.597 | 0.008** |
| 土壤全钾含量Soil total potassium content | –0.333 | 0.218 | 7.99 | 5.412 | <0.001*** |
| 土壤有机质含量Soil organic matter content | –0.155 | –0.219 | 3.28 | 0.403 | 0.871 |
| 叶面积指数Leaf area index | 0.066 | –0.719 | 21.43 | 2.254 | 0.046* |
|
李宇婷, 马爱云, 苗 铮, 等. 邻域竞争对长白落叶松生物量及其分配的影响. 北京林业大学学报, 2025, 47 (4): 92- 102.
doi: 10.12171/j.1000-1522.20230322 |
|
|
Li Y T, Ma A Y, Miao Z, et al. Effects of neighborhood competition on biomass and its allocation of Larix olgensis. Journal of Beijing Forestry University, 2025, 47 (4): 92- 102.
doi: 10.12171/j.1000-1522.20230322 |
|
| 鲁如坤. 2000. 土壤农业化学分析方法. 北京: 中国农业科技出版社. | |
| Lu R K. 2000. Soil and agro-chemistry analytical methods. Beijing: China Agricultural Science and Technology Press. [in Chinese] | |
| 马莉薇. 2011. 不同生境栓皮栎种群种子库及幼苗定居过程研究. 杨凌: 西北农林科技大学. | |
| Ma L W. 2011. Study on seed bank and ecesis process of seedling and sprout of Quercus variabilis in different habitats. Yangling: Northwest A & F University. [in Chinese] | |
|
齐红岩, 李天来, 富宏丹, 等. 不同氮钾施用水平对番茄营养吸收和土壤养分变化的影响. 土壤通报, 2006, 37 (2): 2268- 2272.
doi: 10.3321/j.issn:0564-3945.2006.02.013 |
|
|
Qi H Y, Li T L, Fu H D, et al. Effects of different rates of nitrogen and potassium on nutrient levels in tomato and soil. Chinese Journal of Soil Science, 2006, 37 (2): 2268- 2272.
doi: 10.3321/j.issn:0564-3945.2006.02.013 |
|
|
强亚琪, 张新娜, 王 娟, 等. 东北天然次生林同种和异种密度制约效应随生活史阶段变化规律. 植物生态学报, 2024, 48 (12): 1612- 1622.
doi: 10.17521/cjpe.2023.0293 |
|
|
Qiang Y Q, Zhang X N, Wang J, et al. Variation of conspecific and heterospecific density-dependent survival along life stages in natural secondary forests in northeast China. Chinese Journal of Plant Ecology, 2024, 48 (12): 1612- 1622.
doi: 10.17521/cjpe.2023.0293 |
|
| 王荣辉, 王朝辉, 李生秀, 等. 施磷量对旱地小麦氮磷钾和干物质积累及产量的影响. 干旱地区农业研究, 2011, 29 (1): 115- 121. | |
| Wang R H, Wang Z H, Li S X, et al. Effects of P rates on N P K and dry matter accumulation and grain yield of winter wheat. Agricultural Research in the Arid Areas, 2011, 29 (1): 115- 121. | |
| 中国林业科学研究院林业研究所. 1986. 中国森林土壤. 北京: 科学出版社. | |
| Research Institute of Forestry, Chinese Academy of Forestry. 1986. Forest soils of China. Beijing: Science Press. [in Chinese] | |
|
Adler P B, Salguero-Gómez R, Compagnoni A, et al. Functional traits explain variation in plant life history strategies. Proceedings of the National Academy of Sciences of the United States of America, 2014, 111, 740- 745.
doi: 10.1073/pnas.1410430111 |
|
| Arnold S J. Morphology, performance and fitness. American Zoology, 1983, 361, 347- 361. | |
|
Bloom A J, Chapin F S, Mooney H A. Resource limitation in plants: an economic analogy. Annual Review of Ecology and Systematics, 1985, 16, 363- 392.
doi: 10.1146/annurev.es.16.110185.002051 |
|
| Brouwer R. Some aspects of the equilibrium between overground and underground plant parts. Jaarboek van het Instituut voor Biologisch en Scheikundig onderzoek aan Landbouwgewassen, 1963, 31- 39. | |
|
Comita L S, Hubbell S P. Local neighborhood and species’ shade tolerance influence survival in a diverse seedling bank. Ecology, 2009, 90, 328- 334.
doi: 10.1890/08-0451.1 |
|
| Connell J H. 1971. On the role of natural enemies in preventing competitive exclusion in some marine animals and in rain forest trees//Boer P J, Gradwell G R. Dynamics of populations. Wageningen: Centre for Agricultural Publishing and Documentation, 298–312. | |
|
de la Riva E G, Pérez-Ramos I M, Tosto A, et al. Disentangling the relative importance of species occurrence, abundance and intraspecific variability in community assembly: a trait-based approach at the whole-plant level in Mediterranean forests. Oikos, 2016, 125 (3): 354- 363.
doi: 10.1111/oik.01875 |
|
| Enquist B J, Niklas K J. Global allocation rules for patterns of biomass partitioning in seed plants. Science, 2002, 295, 1517- 1520. | |
| Garnier E. Resource capture, biomass allocation and growth in herbaceous plants. Trends in Ecology & Evolution, 1991, 6 (4): 126- 131. | |
| Grime J. 1994. Exploitation of environmental heterogeneity by plants: ecophysiological processes above-and belowground. New York: Academic Press, 1–19. | |
| Grime J P. 1979. Plant strategies and vegetation processes. New York: John Wiley and Sons, 1–222. | |
| Grime J P. 2006. Plant strategies, vegetation processes, and ecosystem properties. 2rd ed. New York: John Wiley & Sons. | |
| He W C, Wang Y, Wang X, et al. 2022. Stand structure adjustment influences the biomass allocation in naturally generated Pinus massoniana seedlings through environmental factors. Frontiers in Plant Science, 13. | |
|
Hong M G, Park H J, Kim J G. Nutrient effects on seedling survival and growth performance of Typha angustifolia in a mesocosm experiment. Journal of Plant Biology, 2020, 63, 43- 49.
doi: 10.1007/s12374-020-09228-8 |
|
|
Huang Z J, Liu Q Q, Tigabu M, et al. Plastic responses in growth, morphology, and biomass allocation of five subtropical tree species to different degrees of shading. Forests, 2022, 13 (7): 996.
doi: 10.3390/f13070996 |
|
|
Iida Y, Swenson N G. Towards linking species traits to demography and assembly in diverse tree communities: revisiting the importance of size and allocation. Ecological Research, 2020, 35, 947- 966.
doi: 10.1111/1440-1703.12175 |
|
| Janzen D H. Herbivores and the number of tree species intropical forests. American Naturalist, 1970, 104, 501- 528. | |
|
Kamel M S. A physiological study of shading and density effects on the growth and the efficiency of solar energy conversion in some field crops. Mededelingen van de Landbouwhogeschool Wageningen, 1959, 59 (5): 1- 101.
doi: 10.18174/182310 |
|
|
Kobe R K, Vriesendorp C F. Conspecific density dependence in seedlings varies with species shade tolerance in a wet tropical forest. Ecology Letters, 2011, 14, 503- 510.
doi: 10.1111/j.1461-0248.2011.01612.x |
|
|
Loehle C. Tree life history strategies: the role of defenses. Canadian Journal of Forest Research, 1988, 18, 209- 222.
doi: 10.1139/x88-032 |
|
|
Marks C O, Lechowicz M J. Alternative designs and the evolution of functional diversity. The American Naturalist, 2006, 167, 55- 66.
doi: 10.1086/498276 |
|
|
McCormack M L, Dickie I A, Eissenstat D M, et al. Redefining fine roots improves understanding of below-ground contributions to terrestrial biosphere processes. New Phytologist, 2015, 207 (3): 505- 518.
doi: 10.1111/nph.13363 |
|
|
Niinemets Ü. Global-scale climatic controls of leaf dry mass per area, density, and thickness in trees and shrubs. Ecology, 2001, 82, 453- 469.
doi: 10.1890/0012-9658(2001)082[0453:GSCCOL]2.0.CO;2 |
|
|
O'Brien E E, Gersani M, Brown J S. Root proliferation and seed yield in response to spatial heterogeneity of below-ground competition. New Phytologist, 2005, 168, 401- 412.
doi: 10.1111/j.1469-8137.2005.01520.x |
|
| Olson E C, Miller R L. 1958. Morphological integration. Chicago: The University of Chicago Press. | |
|
Poorter H, Niklas K J, Reich P B, et al. Biomass allocation to leaves, stems and roots: meta-analyses of interspecific variation and environmental control. New Phytologist, 2012, 193, 30- 50.
doi: 10.1111/j.1469-8137.2011.03952.x |
|
|
Poorter L. Growth responses of 15 rain-forest tree species to a light gradient: the relative importance of morphological and physiological traits. Functional Ecology, 1999, 13 (3): 396- 410.
doi: 10.1046/j.1365-2435.1999.00332.x |
|
|
Rehling F, Sandner T M, Matthies D. Biomass partitioning in response to intraspecific competition depends on nutrients and species characteristics: a study of 43 plant species. Journal of Ecology, 2021, 109, 2219- 2233.
doi: 10.1111/1365-2745.13635 |
|
| Reich P B. The world-wide “fast-slow” plant economics spectrum: a traits manifesto. Journal of Ecology, 2014, 102, 275- 301. | |
|
Reich P B, Tjoelker M G, Walters M B, et al. Close association of RGR, leaf and root morphology, seed mass and shade tolerance in seedlings of nine boreal tree species grown in high and low light. Functional Ecology, 1998, 12 (3): 327- 338.
doi: 10.1046/j.1365-2435.1998.00208.x |
|
|
Saito W, Kawamura K, Takeda H. Relative importance of overstory canopy openness and seedling density on crown morphology and growth of Acer nipponicum seedlings. Botany, 2012, 90 (11): 1152- 1160.
doi: 10.1139/b2012-079 |
|
|
Shipley B, Meziane D. The balanced-growth hypothesis and the allometry of leaf and root biomass allocation. Functional Ecology, 2002, 16 (3): 326- 331.
doi: 10.1046/j.1365-2435.2002.00626.x |
|
| Tilman D. 1988. Plant strategies and the dynamics and structure of plant communities. New Jersey: Princeton University Press. | |
| Umaña M N, Cao M, Lin L X, et al. Trade-offs in above- and below-ground biomass allocation influencing seedling growth in a tropical forest. Journal of Ecology, 2021a, 109, 1184- 1193. | |
|
Umaña M N, Swenson N G, Marchand P, et al. Relating leaf traits to seedling performance in a tropical forest: building a hierarchical functional framework. Ecology, 2021b, 102, e03385.
doi: 10.1002/ecy.3385 |
|
|
Umaña M N, Zhang C C, Cao M, et al. Quantifying the role of intra-specific trait variation for allocation and organ-level traits in tropical seedling communities. Journal of Vegetation Science, 2018, 29, 276- 284.
doi: 10.1111/jvs.12613 |
|
| Valladares F, Niinemets Ü. 2008. Shade tolerance, a key plant feature of complex nature and consequences. Annual Review of Ecology, Evolution, and Systematics, 39: 237–257. | |
| Violle C, Navas M L, Vile D, et al. 2007. Let the concept of trait be functional! Oikos, 116: 882–892. | |
| Wright S J, Kitajima K, Kraft N J B, et al. Functional traits and the growth-mortality trade-off in tropical trees. Ecology, 2010, 91, 3664- 3674. | |
|
Wright S J, Muller-Landau H C, Calderon O, et al. Annual and spatial variation in seedfall and seedling recruitment in a neotropical forest. Ecology, 2005, 86 (4): 848- 860.
doi: 10.1890/03-0750 |
|
| Wu J J, Swenson N G, Brown C, et al. 2016. How does habitat filtering affect the detection of conspecific and phylogenetic density dependence? Ecology, 97: 1182–1193. | |
|
Yang J, Cao M, Swenson N G. Why functional traits do not predict tree demographic rates. Trends in Ecology & Evolution, 2018, 33 (5): 326- 336.
doi: 10.1016/j.tree.2018.03.003 |
|
|
Yin J, Lin F, De Lombaerde E, et al. The effects of light, conspecific density and soil fungi on seedling growth of temperate tree species. Forest Ecology and Management, 2023, 529, 120683.
doi: 10.1016/j.foreco.2022.120683 |
|
|
Zhang C C, Gu R, Lin L X, et al. Functional traits and ecological niches as correlates of the interspecific growth-mortality trade-off among seedlings of 14 tropical tree species. Functional Ecology, 2024, 38, 1888- 1901.
doi: 10.1111/1365-2435.14624 |
| [1] | 刘世荣,陈远其,聂秀青,明安刚,王晖. 树种多样性对森林生态系统多功能性和韧性的影响[J]. 林业科学, 2026, 62(1): 1-18. |
| [2] | 郭文俊,李鑫豪,田赟,孙艳丽,房新民,代远萌,陈文婧,李廷山,刘鹏,贾昕,查天山. 北京东北部山区不同生活型木本植物叶功能性状特征及其权衡关系[J]. 林业科学, 2025, 61(9): 70-80. |
| [3] | 杨智慧,韦柳端,于淼,董天心,张星宇,张新娜,马冰倩,徐程扬. 4种树苗生长的干旱胁迫响应取决于低序级根性状[J]. 林业科学, 2025, 61(9): 81-89. |
| [4] | 白涵,郝珉辉,何怀江,张新娜,张春雨,赵秀海. 东北主要树种幼树叶片功能性状对模拟氮沉降的响应[J]. 林业科学, 2025, 61(5): 23-32. |
| [5] | 许可儿,汤璐瑶,张博纳,叶琳峰,王忠媛,谢江波. 国槐功能性状沿降水梯度带的变异规律[J]. 林业科学, 2025, 61(4): 81-91. |
| [6] | 杨乐梅,张宝刚,陈有超,蔡延江. 毛竹林林下植物叶片功能性状的模拟氮沉降响应[J]. 林业科学, 2025, 61(12): 61-71. |
| [7] | 笪明慧,冉松松,傅彦榕,邹秉章,王思荣,万晓华,余再鹏,黄志群. 邻体树种多样性对杉木叶片氮与钾、钙、镁计量比的影响[J]. 林业科学, 2024, 60(6): 37-43. |
| [8] | 杭宇杰,陈志成,王林,牛保亮,刘松松,于博,王晓,刘世荣. 宝天曼8种阔叶树木材密度的解剖学决定因素及其与叶性状的协同与权衡[J]. 林业科学, 2024, 60(4): 62-70. |
| [9] | 赵洪贤,苏同,王瑞福,孙艳丽,高永龙,隗骥超,李鑫豪,田赟,贾昕,查天山. 北京密云油松林下灌木小叶鼠李叶片资源利用效率季节变异及环境调控[J]. 林业科学, 2023, 59(7): 1-11. |
| [10] | 顾泽,刘晓东,陈锋. 不同火烈度条件下油松枝功能性状的响应[J]. 林业科学, 2022, 58(8): 99-108. |
| [11] | 徐瑞晶,胡璇,刘广路,郭雯,梁昌强,孔祥河. 海南岛热带低地雨林2种攀缘竹的叶片功能性状差异[J]. 林业科学, 2021, 57(12): 155-166. |
| [12] | 刘辉,牟长城,吴彬,张悦,井立杰. 黑龙江帽儿山温带森林类型土壤非生长季温室气体排放特征[J]. 林业科学, 2020, 56(10): 11-25. |
| [13] | 蒋铮, 于倩楠, 乔明锋, 肖娟, 张子良, 尹华军. 云杉幼树根系分泌物对2种草本植物种子萌发和幼苗生长的影响[J]. 林业科学, 2019, 55(6): 160-166. |
| [14] | 郝珉辉, 李晓宇, 夏梦洁, 何怀江, 张春雨, 赵秀海. 抚育采伐对蛟河次生针阔混交林功能结构和谱系结构的影响[J]. 林业科学, 2018, 54(5): 1-9. |
| [15] | 张俊杰, 柴胜丰, 韦霄, 吕仕洪, 吴少华. 珍稀濒危植物金丝李种子的萌发特性[J]. 林业科学, 2018, 54(4): 174-185. |
| 阅读次数 | ||||||
|
全文 |
|
|||||
|
摘要 |
|
|||||