
林业科学 ›› 2026, Vol. 62 ›› Issue (2): 111-125.doi: 10.11707/j.1001-7488.LYKX20240779
• 研究论文 • 上一篇
钟慧奇1,2,柴静瑜1,王开良1,3,滕建华4,毕文玉5,王安妮1,6,林萍1,3,*( )
)
收稿日期:2024-12-18
修回日期:2025-11-05
出版日期:2026-02-25
发布日期:2026-03-04
通讯作者:
林萍
E-mail:linping80@126.com
基金资助:
Huiqi Zhong1,2,Jingyu Chai1,Kailiang Wang1,3,Jianhua Teng4,Wenyu Bi5,Anni Wang1,6,Ping Lin1,3,*()
Received:2024-12-18
Revised:2025-11-05
Online:2026-02-25
Published:2026-03-04
Contact:
Ping Lin
E-mail:linping80@126.com
摘要:
目的: 开发一种低成本、无损、精准且可批量检测油茶种仁油脂含量和脂肪酸成分含量的方法,以提高油茶油脂性状的评估效率。方法: 以220份油茶无性系种仁为材料,采用索氏抽提法测定种仁油脂含量、气相色谱法测定油茶籽油脂肪酸成分含量,采集种仁在波长1 000~2 500 nm间的近红外光谱,应用9种方法对光谱数据进行预处理后,分别通过随机抽样法(RS)和光谱?理化值共生距离算法(SPXY)按4∶1将样本划分为校准集和预测集,运用竞争性自适应重加权算法(CARS)从光谱数据中选择与各油茶油脂性状显著相关的关键波长,并建立油茶种仁油脂含量和脂肪酸成分含量的偏最小二乘回归(PLSR)预测模型。结果: 油茶种仁油脂含量以及7种脂肪酸(棕榈酸、棕榈烯酸、硬脂酸、油酸、亚油酸、亚麻酸、顺-11-二十碳烯酸)含量的变化范围均符合或接近正态分布。2种方法划分样本集所建油脂含量预测模型均具有良好的精度和稳定性,采用RS法划分样本集下,以标准正态变换(SNV)预处理方法最优,选择14个关键波长,相对分析误差(RPD)为5.205 5,预测集决定系数(
中图分类号:
钟慧奇,柴静瑜,王开良,滕建华,毕文玉,王安妮,林萍. 基于CARS-PLSR的油茶种仁油脂含量和脂肪酸成分的近红外光谱预测模型构建[J]. 林业科学, 2026, 62(2): 111-125.
Huiqi Zhong,Jingyu Chai,Kailiang Wang,Jianhua Teng,Wenyu Bi,Anni Wang,Ping Lin. Construction of Near Infrared Spectroscopy Prediction Models Based on CARS-PLSR for Determining Oil Content and Fatty Acid Composition of Camellia oleifera Kernel[J]. Scientia Silvae Sinicae, 2026, 62(2): 111-125.
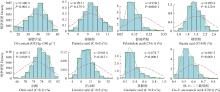
图1
油茶群体样本油脂含量、脂肪酸成分含量概率密度直方图 P<0.05,样本数据不符合正态分布;P>0.05,样本数据符合正态分布。w越接近1,样本数据越接近正态分布。"
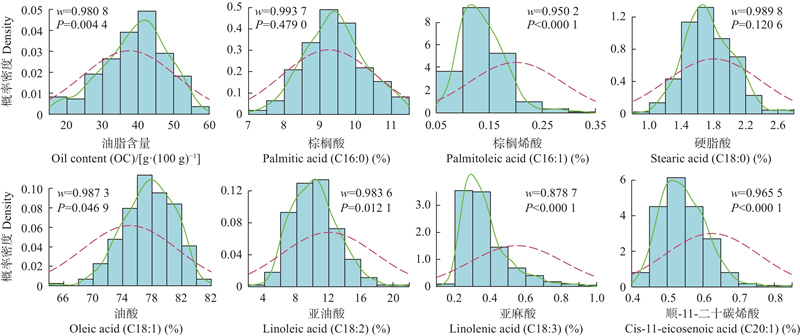

图2
油茶种仁原始近红外光谱"
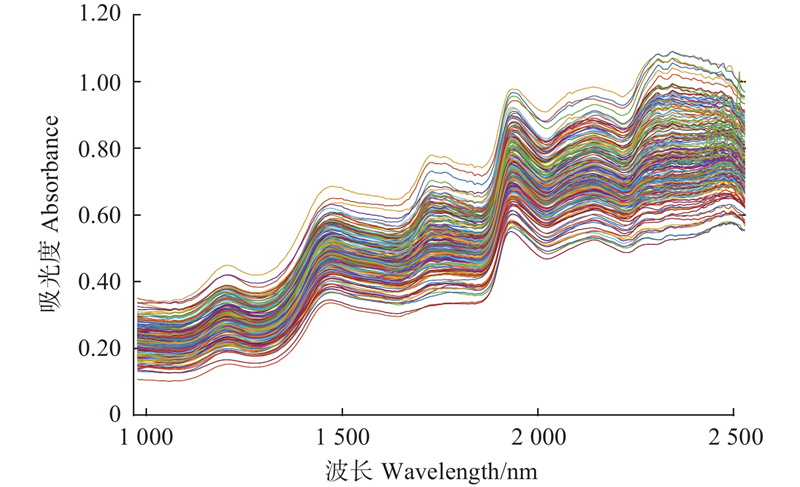
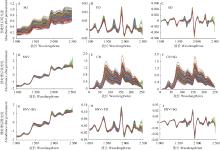
图3
油茶种仁预处理后近红外光谱 SG:Savitzky-Golay 卷积平滑Savitzky-Golay convolution smoothing;FD:一阶导数First derivative; SD:二阶导数Second derivative; SNV:标准正态变换Standard normal variate; CR:连续统去除Continuum removal."
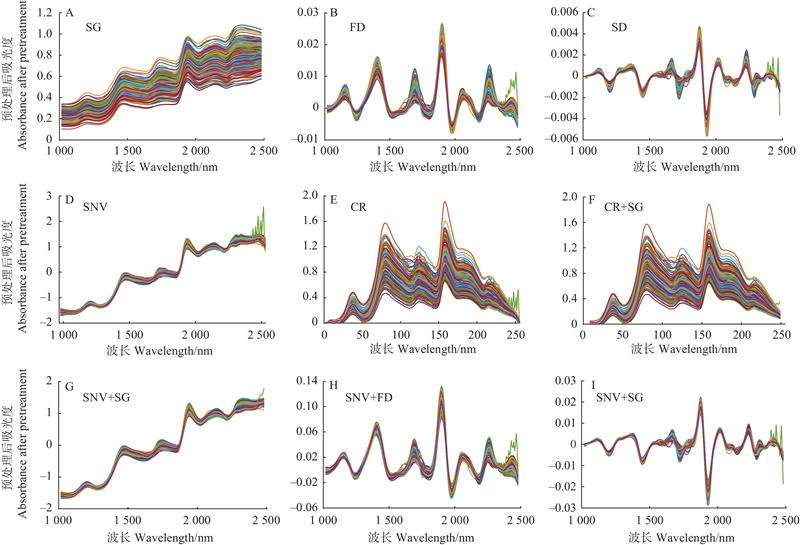
表1
校准集和预测集样品油脂含量、脂肪酸含量的分布"
| 项目Item | RS法划分样本集 Partitioning sample sets with RS | SPXY算法划分样本集 Partitioning sample sets with SPXY | ||||
| 校准集Calibration set | 预测集Prediction set | 校准集Calibration set | 预测集Prediction set | |||
| 样本数量 Sample number | 160 | 40 | 160 | 40 | ||
| 油脂含量 Oil content (OC)/ [g·(100 g)?1] | 最小值Minimum | 16.01 | 16.32~19.56 | 16.01~16.32 | 16.01~20.11 | |
| 最大值Maximum | 51.96~55.22 | 50.33~55.22 | 55.22 | 51.90~53.68 | ||
| 平均值Mean | 38.64~39.23 | 37.37~39.74 | 38.15~39.16 | 37.65~41.68 | ||
| 标准差Standard deviation | 8.59~9.16 | 7.35~9.80 | 8.80~9.22 | 6.97~8.96 | ||
| 棕榈酸 Palmitic acid (C16:0) (%) | 最小值Minimum | 7.09 | 7.59~8.34 | 7.09 | 7.59~8.39 | |
| 最大值Maximum | 11.30~11.40 | 10.60~11.40 | 11.40 | 10.60~11.20 | ||
| 平均值Mean | 9.41~9.46 | 9.34~9.54 | 9.42~9.48 | 9.26~9.50 | ||
| 标准差Standard deviation | 0.86~0.90 | 0.56~0.77 | 0.88~0.90 | 0.57~0.69 | ||
| 棕榈烯酸 Palmitoleic acid (C16:1) (%) | 最小值Minimum | 0.05 | 0.06~0.90 | 0.06 | 0.06~0.09 | |
| 最大值Maximum | 0.31 | 0.18~0.23 | 0.32 | 0.20 | ||
| 平均值Mean | 0.14 | 0.13~0.14 | 0.13~0.14 | 0.12~0.13 | ||
| 标准差Standard deviation | 0.04~0.05 | 0.02~0.04 | 0.04~0.05 | 0.02~0.03 | ||
| 硬脂酸 Stearic acid (C18:0) (%) | 最小值Minimum | 0.89 | 1.14~1.34 | 0.89 | 1.14~1.23 | |
| 最大值Maximum | 2.73 | 2.14~2.30 | 2.73 | 2.14~2.29 | ||
| 平均值Mean | 1.73~1.76 | 1.64~1.75 | 1.73~1.74 | 1.68~1.76 | ||
| 标准差Standard deviation | 0.31~0.32 | 0.21~0.27 | 0.31~0.32 | 0.21~0.27 | ||
| 油酸 Oleic acid (C18:1) (%) | 最小值Minimum | 69.10, 69.30 | 69.10~73.50 | 69.10 | 69.30~73.30 | |
| 最大值Maximum | 84.60 | 82.50~84.10 | 84.60 | 82.30~82.60 | ||
| 平均值Mean | 77.29~77.52 | 77.34~78.27 | 77.35~77.49 | 77.46~78.05 | ||
| 标准差Standard deviation | 3.32~3.48 | 2.42~3.31 | 3.41~3.50 | 2.44~2.95 | ||
| 亚油酸 Linoleic acid (C18:2) (%) | 最小值Minimum | 4.71, 5.65 | 4.71~6.80 | 4.71 | 5.65~6.63 | |
| 最大值Maximum | 18.10 | 15.10~16.90 | 18.10 | 13.80~18.00 | ||
| 平均值Mean | 10.12~10.40 | 9.84~10.99 | 10.30~10.52 | 9.36~10.26 | ||
| 标准差Standard deviation | 2.73~2.96 | 2.08~2.90 | 2.84~2.94 | 2.00~2.58 | ||
| 亚麻酸 Linolenic acid (C18:3) (%) | 最小值Minimum | 0.13 | 0.20~0.22 | 0.13 | 0.21~0.23 | |
| 最大值Maximum | 0.92 | 0.55~0.70 | 0.92 | 0.43~0.67 | ||
| 平均值Mean | 0.37~0.38 | 0.33~0.37 | 0.37~0.38 | 0.31~0.35 | ||
| 标准差Standard deviation | 0.13~0.14 | 0.07~0.17 | 0.13~0.14 | 0.05~0.11 | ||
| 顺-11-二十碳烯酸 Cis-11-eicosenoic acid (C20:1) (%) | 最小值Minimum | 0.43, 0.43 | 0.43~0.47 | 0.43 | 0.44~0.47 | |
| 最大值Maximum | 0.83 | 0.62~0.70 | 0.83 | 0.636~0.70 | ||
| 平均值Mean | 0.54~0.55 | 0.52~0.55 | 0.54~0.55 | 0.53~0.54 | ||
| 标准差Standard deviation | 0.06~0.07 | 0.05~0.06 | 0.06~0.07 | 0.04~0.06 | ||
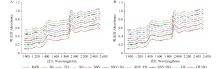
图4
RS (A)和SPXY (B)划分样本集不同预处理下的特征波长选择分布(油脂含量) 圆圈标识位置为筛选出的特征波长区The circled positions indicate the selected feature wavelength regions. RAW:原始数据Raw data;SG:Savitzky-Golay 卷积平滑Savitzky-Golay convolution smoothing;FD:一阶导数First derivative; SD:二阶导数Second derivative; SNV:标准正态变换Standard normal variate; CR:连续统去除Continuum removal."
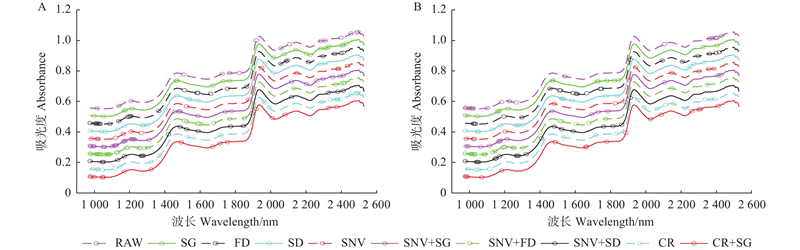
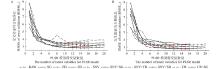
图5
RS (A)和SPXY (B)划分样本集下油脂含量PLSR模型最优潜变量数量的确定 红色点标识位置为筛选出的潜变量The red dot positions indicate the selected latent variables. RAW:原始数据Raw data;SG:Savitzky-Golay 卷积平滑Savitzky-Golay convolution smoothing;FD:一阶导数First derivative; SD:二阶导数Second derivative; SNV:标准正态变换Standard normal variate; CR:连续统去除Continuum removal."
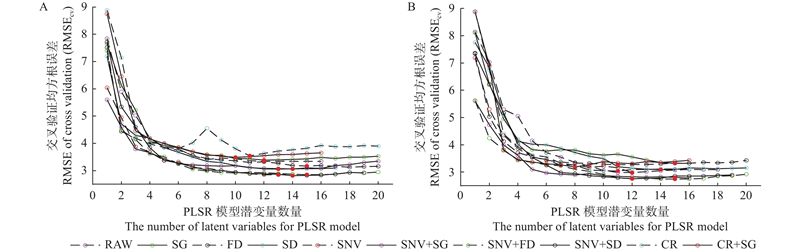
表2
不同预处理后种仁油脂含量预测模型的相关参数①"
| 样本集划分方法 Partitioning sample sets method | 预处理方法 Preprocessing method | 波长选择 数量 Number of wavelengths selected | 潜变量 数量 Number of latent variables | 相对分析 误差Relative percent deviation (RPD) | 校准集 Calibration set | 校准集交叉验证 Cross validation | 预测集 Prediction set | |||||
| RMSEc/ [g·(100 g)?1] | RMSEcv/ [g·(100 g)?1] | RMSEp/ [g·(100 g)?1] | ||||||||||
| 随机抽样法 Random sampling (RS) | RAW | 16 | 12 | 4.014 1 | 0.884 4 | 2.958 8 | 0.853 0 | 3.336 6 | 0.937 0 | 2.283 9 | ||
| SG | 23 | 12 | 3.884 6 | 0.878 2 | 3.037 7 | 0.848 7 | 3.385 7 | 0.934 8 | 2.377 6 | |||
| FD | 28 | 15 | 3.549 0 | 0.904 8 | 2.779 0 | 0.876 2 | 3.169 8 | 0.918 8 | 2.259 6 | |||
| SD | 17 | 13 | 4.117 2 | 0.900 0 | 2.766 4 | 0.877 9 | 3.057 0 | 0.953 1 | 2.211 4 | |||
| SNV | 14 | 13 | 5.205 5 | 0.910 1 | 2.579 9 | 0.890 5 | 2.847 1 | 0.965 1 | 1.854 8 | |||
| SNV+SG | 31 | 14 | 4.698 3 | 0.908 7 | 2.723 1 | 0.884 6 | 3.060 5 | 0.953 6 | 1.703 2 | |||
| SNV+FD | 34 | 15 | 4.914 1 | 0.919 0 | 2.478 7 | 0.892 7 | 2.852 5 | 0.959 3 | 1.856 2 | |||
| SNV+SD | 19 | 14 | 5.009 5 | 0.917 5 | 2.460 4 | 0.892 1 | 2.814 3 | 0.959 4 | 1.955 9 | |||
| CR | 22 | 11 | 3.227 4 | 0.892 9 | 2.989 4 | 0.849 5 | 3.543 1 | 0.902 4 | 2.276 2 | |||
| CR+SG | 16 | 10 | 3.610 1 | 0.875 8 | 3.175 2 | 0.850 0 | 3.488 6 | 0.924 0 | 2.184 5 | |||
| 光谱?理化值共生距离 算法Sample set partitioning based on joint X-Y distance (SPXY) | RAW | 18 | 12 | 2.696 4 | 0.914 2 | 2.693 9 | 0.894 7 | 2.984 7 | 0.859 3 | 2.621 8 | ||
| SG | 16 | 15 | 2.493 6 | 0.895 7 | 2.969 2 | 0.869 5 | 3.321 5 | 0.839 0 | 2.806 2 | |||
| FD | 21 | 11 | 2.637 5 | 0.894 0 | 2.940 7 | 0.868 7 | 3.272 6 | 0.865 6 | 2.950 8 | |||
| SD | 21 | 14 | 3.359 6 | 0.912 2 | 2.679 4 | 0.883 0 | 3.092 0 | 0.915 9 | 2.338 7 | |||
| SNV | 12 | 12 | 2.920 2 | 0.910 6 | 2.740 1 | 0.894 3 | 2.978 9 | 0.882 3 | 2.467 0 | |||
| SNV+SG | 16 | 15 | 3.092 4 | 0.922 9 | 2.553 4 | 0.906 6 | 2.808 8 | 0.893 0 | 2.253 8 | |||
| SNV+FD | 25 | 15 | 3.417 0 | 0.924 1 | 2.416 2 | 0.902 0 | 2.745 2 | 0.916 8 | 2.622 4 | |||
| SNV+SD | 19 | 12 | 3.432 5 | 0.925 8 | 2.429 4 | 0.904 6 | 2.755 5 | 0.913 5 | 2.268 2 | |||
| CR | 16 | 11 | 2.208 5 | 0.907 6 | 2.777 5 | 0.889 3 | 3.039 9 | 0.801 1 | 3.322 0 | |||
| CR+SG | 16 | 8 | 2.192 2 | 0.897 4 | 2.929 6 | 0.878 6 | 3.187 4 | 0.802 8 | 3.326 9 | |||
图6
RS (A)和SPXY (B)划分样本集下油脂含量CARS-PLSR模型预测结果"
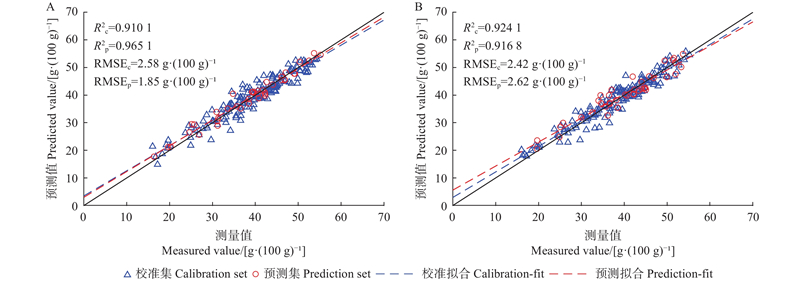
表3
脂肪酸含量近红外预测模型的相关参数(RS法划分样本集)①"
| 脂肪酸 Fatty acid | 预处理方法 Preprocessing method | 波长选择 数量 Number of wavelengths selected | 潜变量数量 Number of latent variables | 相对分析 误差Relative percent deviation (RPD) | 校准集 Calibration set | 校准集交叉 验证Cross validation | 预测集 Prediction set | |||||
| RMSEc (%) | RMSEcv (%) | RMSEp (%) | ||||||||||
| 棕榈酸 Palmitic acid (C16:0) | SD | 31 | 14 | 1.408 6 | 0.485 8 | 0.616 8 | 0.711 3 | 0.545 3 | 0.543 9 | |||
| 棕榈烯酸 Palmitoleic acid (C16:1) | SNV | 20 | 8 | 1.493 5 | 0.377 5 | 0.034 7 | 0.233 5 | 0.038 5 | 0.605 8 | 0.022 1 | ||
| 硬脂酸 Stearic acid (C18:0) | SD | 14 | 11 | 1.648 9 | 0.408 7 | 0.237 8 | 0.307 5 | 0.257 3 | 0.631 7 | 0.164 2 | ||
| 油酸 Oleic acid (C18:1) | SD | 25 | 12 | 1.939 4 | 0.556 1 | 2.207 4 | 0.429 0 | 2.503 3 | 0.738 5 | 1.707 1 | ||
| 亚油酸 Linoleic acid (C18:2) | SNV | 29 | 14 | 2.116 4 | 0.530 7 | 1.866 8 | 0.356 8 | 2.185 4 | 0.775 4 | 1.370 2 | ||
| 亚麻酸 Linolenic acid (C18:3) | CR | 20 | 13 | 2.338 1 | 0.622 0 | 0.083 5 | 0.508 2 | 0.095 2 | 0.831 6 | 0.049 2 | ||
| 顺-11-二十碳烯酸 Cis-11-eicosenoic acid (C20:1) | SD | 16 | 13 | 1.683 1 | 0.489 3 | 0.046 5 | 0.374 5 | 0.051 5 | 0.644 0 | 0.034 7 | ||
表4
脂肪酸含量近红外预测模型的相关参数(SPXY算法划分样本集)①"
| 脂肪酸 Fatty acid | 预处理方法 Preprocessing method | 波长选择 数量 Number of wavelengths selected | 潜变量数量 Number of latent variables | 相对分析 误差Relative percent deviation (RPD) | 校准集 Calibration set | 校准集交叉 验证Cross validation | 预测集 Prediction set | |||||
| RMSEc (%) | RMSEcv (%) | RMSEp (%) | ||||||||||
| 棕榈酸 Palmitic acid (C16:0) | SD | 28 | 15 | 1.254 2 | 0.467 5 | 0.642 0 | 0.265 1 | 0.754 3 | 0.358 0 | 0.507 8 | ||
| 棕榈烯酸 Palmitoleic acid (C16:1) | FD | 14 | 11 | 1.242 0 | 0.340 4 | 0.036 2 | 0.248 1 | 0.038 6 | 0.413 5 | 0.023 5 | ||
| 硬脂酸 Stearic acid (C18:0) | SD | 16 | 13 | 1.265 8 | 0.471 6 | 0.228 7 | 0.362 0 | 0.251 3 | 0.374 4 | 0.188 8 | ||
| 油酸 Oleic acid (C18:1) | SD | 30 | 14 | 1.946 3 | 0.596 3 | 2.160 0 | 0.459 8 | 2.498 6 | 0.735 0 | 1.513 3 | ||
| 亚油酸 Linoleic acid (C18:2) | CR | 24 | 14 | 1.864 5 | 0.553 3 | 1.928 7 | 0.412 9 | 2.211 1 | 0.733 2 | 1.182 2 | ||
| 亚麻酸 Linolenic acid (C18:3) | SD | 19 | 14 | 1.910 4 | 0.654 6 | 0.080 8 | 0.564 8 | 0.090 7 | 0.735 6 | 0.055 3 | ||
| 顺-11-二十碳烯酸 Cis-11-eicosenoic acid (C20:1) | SNV+SD | 21 | 13 | 1.348 6 | 0.557 8 | 0.043 5 | 0.444 7 | 0.048 8 | 0.480 1 | 0.041 7 | ||
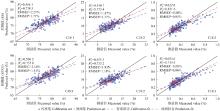
图7
脂肪酸成分CARS-PLSR模型预测结果 RS:随机抽样法Random sampling;SPXY:光谱?理化值共生距离算法Sample set partitioning based on joint X-Y distance. C18:1:油酸Oleic acid;C18:2:亚油酸Linoleic acid;C18:3:亚麻酸Linolenic acid."
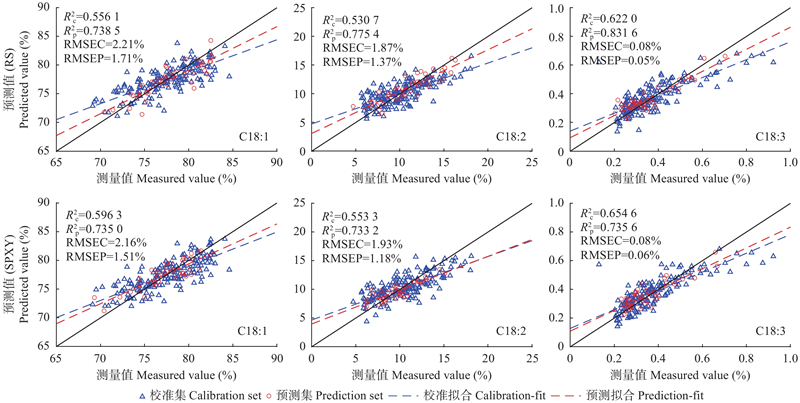

图8
RS (A)和SPXY (B)划分样本集下油脂含量最佳模型验证结果"
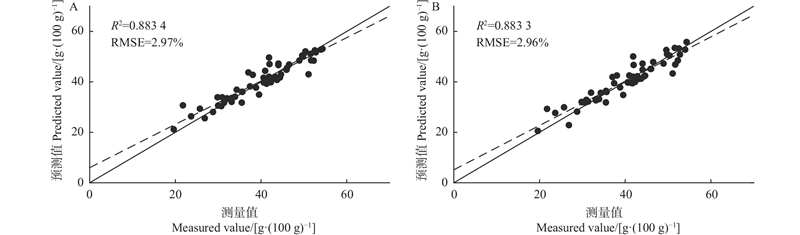

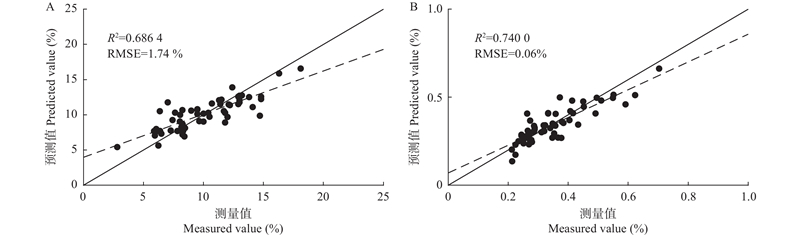
图9
亚油酸(A)和亚麻酸(B)含量最佳模型验证结果"
| 褚小立, 袁洪福, 陆婉珍. 2004. 近红外分析中光谱预处理及波长选择方法进展与应用. 化学进展, 16(4): 528‒542. | |
| Chu X L, Yuan H F, Lu W Z, 2004. Progress and application of spectral data pretreatment and wavelength selection methods in NIR analytical technique. Progress in Chemistry, 16(4): 528‒542. [in Chinese] | |
| 丁丽霞, 王志辉, 葛宏立. 2010. 基于包络线法的不同树种叶片高光谱特征分析. 浙江林学院学报, 27(6): 809‒814. | |
| Ding L X, Wang Z H, Ge H L, 2010. Continuum removal based hyperspectral characteristic analysis of leaves of different tree species. Journal of Zhejiang Forestry College, 27(6): 809‒814. [in Chinese] | |
|
郭文川, 朱德宽, 张 乾, 等. 基于近红外光谱的掺伪油茶籽油检测. 农业机械学报, 2020, 51 (9): 350- 357.
doi: 10.6041/j.issn.1000-1298.2020.09.040 |
|
|
Guo W C, Zhu D K, Zhang Q, et al. Detection on adulterated oil-tea camellia seed oil based on near-infrared spectroscopy. Transactions of the Chinese Society for Agricultural Machinery, 2020, 51 (9): 350- 357.
doi: 10.6041/j.issn.1000-1298.2020.09.040 |
|
|
何小三, 李 博, 符树根, 等. 茶油脂肪酸组分近红外模型构建研究. 南方林业科学, 2018, 46 (5): 13- 23.
doi: 10.16259/j.cnki.36-1342/s.2018.05.004 |
|
|
He X S, Li B, Fu S G, et al. Near infrared model construction of fatty acid composition of Camellia oleifera oil. South China Forestry Science, 2018, 46 (5): 13- 23.
doi: 10.16259/j.cnki.36-1342/s.2018.05.004 |
|
| 李运锋, 袁景淇, 薛耀锋. 2004. 发酵过程中神经网络训练样本的选取. 化工自动化及仪表, 31(6): 21‒24. | |
| Li Y F, Yuan J Q, Xue Y F, 2004. Selection of training samples of the neural network in fermentation industry. Control and Instruments in Chemical Industry, 31(6): 21‒24. [in Chinese] | |
| 刘慧春, 周江华, 张加强, 等. 油用牡丹单粒种子含油量NIRS模型的建立. 核农学报, 2022, 36 (6): 1137- 1144. | |
| Liu H C, Zhou J H, Zhang J Q, et al. Establishment of NIRS model for oil content in single seed of oil peony. Journal of Nuclear Agricultural Sciences, 2022, 36 (6): 1137- 1144. | |
| 阮治纲, 李 彬. 2011. 近红外光谱分析技术的原理及在中药材中的应用. 药物分析杂志, 31(2): 408‒417. | |
| Ruan Z G, Li B, 2011. The principle and application of near- nfrared spectroscopy for the Chinese herbal medicines. Chinese Journal of Pharmaceutical Analysis, 31(2): 408‒417. [in Chinese] | |
|
谭传波, 田 华, 周刚平, 等. 鲜榨山茶油与特级初榨橄榄油营养价值的比较. 中国油脂, 2019, 44 (1): 67- 69.
doi: 10.3969/j.issn.1003-7969.2019.01.015 |
|
|
Tan C B, Tian H, Zhou G P, et al. Comparison of nutritional values between fresh pressed oil-tea Camellia seed oil and extra virgin olive oil. China Oils and Fats, 2019, 44 (1): 67- 69.
doi: 10.3969/j.issn.1003-7969.2019.01.015 |
|
| 王 珏, 李彦杰, 陈益存, 等. 近红外光谱技术在林业领域的应用. 南京林业大学学报(自然科学版), 2023, 47 (3): 237- 246. | |
| Wang J, Li Y J, Chen Y C, et al. The application of near-infrared spectroscopy in forestry. Journal of Nanjing Forestry University (Natural Sciences Edition), 2023, 47 (3): 237- 246. | |
|
王亚萍, 费学谦, 姚小华, 等. 不同产地油茶籽脂肪酸及甘油三酯的主成分分析和聚类分析. 中国油脂, 2021, 46 (9): 112- 119.
doi: 10.19902/j.cnki.zgyz.1003-7969.200640 |
|
|
Wang Y P, Fei X Q, Yao X H, et al. Principal component analysis and cluster analysis of fatty acids and triglycerides in oi-tea Camellia seeds from different origins. China Oils and Fats, 2021, 46 (9): 112- 119.
doi: 10.19902/j.cnki.zgyz.1003-7969.200640 |
|
| 奚如春, 钟燕梅, 邓小梅, 等. 基于近红外光谱的油茶种子含油量定标模型构建. 林业科学, 2013, 49 (4): 1- 6. | |
| Xi R C, Zhong Y M, Deng X M, et al. Models for determining oil contents in Camellia oleifera seeds by using near infrared spectroscopy. Scientia Silvae Sinicae, 2013, 49 (4): 1- 6. | |
| 谢一青, 李志真, 姚小华, 等. 2013. 小果油茶果实性状与含油率及脂肪酸组成相关性分析. 中国油脂, 38(5): 80−83. | |
| Xie Y Q, Li Z Z, Yao X H, et al. 2013. Correlation of fruit characters and oil content and fatty acid composition of Camellia meiocarpa. China Oils and Fats, 38(5): 80−83. [in Chinese] | |
| 杨 忠, 江泽慧, 费本华, 等. 2005. 近红外光谱技术及其在木材科学中的应用. 林业科学, 41(4): 177‒183. | |
| Yang Z, Jiang Z H, Fei B H, et al. 2005. Application of near infrared (NIR) spectroscopy to wood science. Scientia Silvae Sinicae, 41(4): 177‒183. [in Chinese] | |
| 姚小华, 王亚萍, 王开良, 等. 地理经纬度对油茶籽中脂肪及脂肪酸组成的影响. 中国油脂, 2011, 36 (4): 31- 34. | |
| Yao X H, Wang Y P, Wang K L, et al. Effects of geographic latitude and longitude on fat and its fatty acid composition of oil-tea Camellia seeds. China Oils and Fats, 2011, 36 (4): 31- 34. | |
| 原姣姣, 王成章, 陈虹霞, 等. 近红外漫反射光谱法测定油茶籽含油量的研究. 林产化学与工业, 2011, 31 (3): 28- 32. | |
| Yuan J J, Wang C Z, Chen H X, et al. Determination of oil content of Camellia oleifera Abel. seeds by near infrared reflectance spectroscopy. Chemistry and Industry of Forest Products, 2011, 31 (3): 28- 32. | |
|
展晓日, 朱向荣, 史新元, 等. SPXY样本划分法及蒙特卡罗交叉验证结合近红外光谱用于橘叶中橙皮苷的含量测定. 光谱学与光谱分析, 2009, 29 (4): 964- 968.
doi: 10.3964/j.issn.1000-0593(2009)04-0964-05 |
|
|
Zhan X R, Zhu X R, Shi X Y, et al. Determination of hesperidin in tangerine leaf by near-infrared spectroscopy with SPXY algorithm for sample subset partitioning and monte carlo cross validation. Spectroscopy and Spectral Analysis, 2009, 29 (4): 964- 968.
doi: 10.3964/j.issn.1000-0593(2009)04-0964-05 |
|
|
张菊华, 卞建明, 朱向荣, 等. 近红外光谱结合化学计量学法在油茶籽油脂肪酸含量测定中的应用. 湖南农业科学, 2013, 43 (12): 30- 32.
doi: 10.3969/j.issn.1006-060X.2013.12.010 |
|
|
Zhang J H, Bian J M, Zhu X R, et al. Application of near-infrared spectroscopy combined with chemometrics in the determination of fatty acid content in Camellia oil. Hunan Agricultural Sciences, 2013, 43 (12): 30- 32.
doi: 10.3969/j.issn.1006-060X.2013.12.010 |
|
|
周 菲, 王文军, 刘 岩, 等. 向日葵籽仁脂肪和脂肪酸含量近红外光谱模型的建立. 作物杂志, 2021, 36 (2): 200- 206.
doi: 10.16035/j.issn.1001-7283.2021.02.029 |
|
|
Zhou F, Wang W J, Liu Y, et al. Establishment of near-infrared spectroscopy model for the contents of fat and fatty acids in sunflower husked seeds. Crops, 2021, 36 (2): 200- 206.
doi: 10.16035/j.issn.1001-7283.2021.02.029 |
|
|
周宏平, 胡逸磊, 姜洪喆, 等. 基于高光谱成像的油茶籽含油率检测方法. 农业机械学报, 2021, 52 (5): 308- 315.
doi: 10.6041/j.issn.1000-1298.2021.05.034 |
|
|
Zhou H P, Hu Y L, Jiang H Z, et al. Detection method of oil content of Camellia oleifera seed based on hyperspectral imaging. Transactions of the Chinese Society for Agricultural Machinery, 2021, 52 (5): 308- 315.
doi: 10.6041/j.issn.1000-1298.2021.05.034 |
|
|
周长富, 姚小华, 林 萍, 等. 油茶种子发育过程组分含量动态研究. 中国油料作物学报, 2013, 35 (6): 680- 685.
doi: 10.7505/j.issn.1007-9084.2013.06.010 |
|
|
Zhou C F, Yao X H, Lin P, et al. Constituent changes associated with seeds development of Camellia oleifera Abel. Chinese Journal of Oil Crop Sciences, 2013, 35 (6): 680- 685.
doi: 10.7505/j.issn.1007-9084.2013.06.010 |
|
|
Arendse E, Fawole O A, Magwaza L S, et al. Non-destructive prediction of internal and external quality attributes of fruit with thick rind: a review. Journal of Food Engineering, 2018, 217, 11- 23.
doi: 10.1016/j.jfoodeng.2017.08.009 |
|
|
Barnes R J, Dhanoa M S, Lister S J. Standard normal variate transformation and de-trending of near-infrared diffuse reflectance spectra. Applied Spectroscopy, 1989, 43 (5): 772- 777.
doi: 10.1366/0003702894202201 |
|
|
Cayuela J A, Camino M del C P. Prediction of quality of intact olives by near infrared spectroscopy. European Journal of Lipid Science and Technology, 2010, 112 (11): 1209- 1217.
doi: 10.1002/ejlt.201000372 |
|
|
Chu X, Wang W, Li C, et al. Identifying camellia oil adulteration with selected vegetable oils by characteristic near-infrared spectral regions. Journal of Innovative Optical Health Sciences, 2018, 11 (2): 1850006.
doi: 10.1142/S1793545818500062 |
|
|
Cozzolino D, Williams P J, Hoffman L C. An overview of pre-processing methods available for hyperspectral imaging applications. Microchemical Journal, 2023, 193, 109129.
doi: 10.1016/j.microc.2023.109129 |
|
|
da Silva Medeiros M L, Cruz-Tirado J P, Lima A F, et al. Assessment oil composition and species discrimination of Brassicas seeds based on hyperspectral imaging and portable near infrared (NIR) spectroscopy tools and chemometrics. Journal of Food Composition and Analysis, 2022, 107, 104403.
doi: 10.1016/j.jfca.2022.104403 |
|
|
Galvão R K H, Araujo M C U, José G E, et al. A method for calibration and validation subset partitioning. Talanta, 2005, 67 (4): 736- 740.
doi: 10.1016/j.talanta.2005.03.025 |
|
|
Geladi P, Kowalski B R. Partial least-squares regression: a tutorial. Analytica Chimica Acta, 1986, 185, 1- 17.
doi: 10.1016/0003-2670(86)80028-9 |
|
|
Kennard R W, Stone L A. Computer aided design of experiments. Technometrics, 1969, 11 (1): 137- 148.
doi: 10.1080/00401706.1969.10490666 |
|
|
Li H, Liang Y, Xu Q. Key wavelengths screening using competitive adaptive reweighted sampling method for multivariate calibration. Analytica chimica acta, 2009, 648 (1): 77- 84.
doi: 10.1016/j.aca.2009.06.046 |
|
| Li X, Zhang L, Zhang Y, et al. Review of NIR spectroscopy methods for nondestructive quality analysis of oilseeds and edible oils. Trends in Food Science & Technology, 2020, 101, 172- 181. | |
|
Li Y, Xiong Y, Min S. Data fusion strategy in quantitative analysis of spectroscopy relevant to olive oil adulteration. Vibrational Spectroscopy, 2019, 101, 20- 27.
doi: 10.1016/j.vibspec.2018.12.009 |
|
| Manley M, 2014. Near-infrared spectroscopy and hyperspectral imaging: non-destructive analysis of biological materials. Chemical Society Reviews, 43(24): 8200‒8214. | |
|
Mendes T O, da Rocha R A, Porto B L S, et al. Quantification of extra-virgin olive oil adulteration with soybean oil: a comparative study of NIR, MIR, and Raman spectroscopy associated with chemometric approaches. Food Analytical Methods, 2015, 8 (9): 2339- 2346.
doi: 10.1007/s12161-015-0121-y |
|
|
Nicolaï B M, Beullens K, Bobelyn E, et al. Nondestructive measurement of fruit and vegetable quality by means of NIR spectroscopy: a review. Postharvest Biology and Technology, 2007, 46 (2): 99- 118.
doi: 10.1016/j.postharvbio.2007.06.024 |
|
|
Qu J, Liu D, Cheng J, et al. Applications of near-infrared spectroscopy in food safety evaluation and control: a review of recent research advances. Critical Reviews in Food Science and Nutrition, 2015, 55 (13): 1939- 1954.
doi: 10.1080/10408398.2013.871693 |
|
|
Rinnan Å, van den Berg F, Søren B E Engelsen.. Review of the most common pre-processing techniques for near-infrared spectra. Trends in Analytical Chemistry, 2009., 28 (10), 1201- 1222.
doi: 10.1016/j.trac.2009.07.007 |
|
|
Ren G, Wang Y, Ning J, et al. Highly identification of keemun black tea rank based on cognitive spectroscopy: near infrared spectroscopy combined with feature variable selection. Spectrochimica Acta Part A: Molecular and Biomolecular Spectroscopy, 2020, 230, 118079.
doi: 10.1016/j.saa.2020.118079 |
|
|
Sohng W, Park Y, Jang D, et al. Incorporation of two-dimensional correlation analysis into discriminant analysis as a potential tool for improving discrimination accuracy: near-infrared spectroscopic discrimination of adulterated olive oils. Talanta, 2020, 212, 120748.
doi: 10.1016/j.talanta.2020.120748 |
|
|
Sun Y, Yuan M, Liu X, et al. A sample selection method specific to unknown test samples for calibration and validation sets based on spectra similarity. Spectrochimica Acta Part A: Molecular and Biomolecular Spectroscopy, 2021, 258, 119870.
doi: 10.1016/j.saa.2021.119870 |
|
|
Wold S, Sjöström M, Eriksson L. PLS-regression: a basic tool of chemometrics. Chemometrics and Intelligent Laboratory Systems, 2001, 58 (2): 109- 130.
doi: 10.1016/S0169-7439(01)00155-1 |
|
| Zhang L, Li G, Sun M, et al. Kennard-Stone combined with least square support vector machine method for noncontact discriminating human blood species. Infrared Physics & Technology, 2017, 86, 116- 119. |
| [1] | 竹万宽,王志超,许宇星,黄润霞,陶怡,钟源源,杜阿朋. 基于机器学习算法的雷州半岛桉树复层混交林土壤呼吸模拟[J]. 林业科学, 2026, 62(1): 67-82. |
| [2] | 周宏威,李永正,郭文辉,陈怡帆,胡浩昌,张思岩,崔迪,陈雨茉. 基于元胞自动机模型的松材线虫病小班尺度预测[J]. 林业科学, 2026, 62(1): 133-143. |
| [3] | 孙英杰,张德楠,沈育伊,徐广平,曹杨,黄科朝,陈运霜,毛馨月,滕秋梅,吕仕洪,褚俊智. 模拟氮沉降对中亚热带桉树人工林土壤微生物群落结构及酶活性的影响[J]. 林业科学, 2025, 61(5): 46-60. |
| [4] | 周龙,张麦芳,董强,朱慧男,刘金良. 油松纯林、辽东栎纯林与油松-辽东栎混交林土壤微生物源碳变化特征[J]. 林业科学, 2025, 61(12): 34-48. |
| [5] | 朱诗豪,吴志伟,李政杰,李顺. 赣南马尾松林地表细小死可燃物含水率动态及模型[J]. 林业科学, 2024, 60(5): 158-168. |
| [6] | 潘玺,李康,杨忠. 基于卷积神经网络的近红外光谱与数字图像特征信息融合木材树种识别[J]. 林业科学, 2024, 60(12): 136-145. |
| [7] | 钟建,刘辰露,庆军,王琦,刘攀峰,杜庆鑫,杜红岩,杜兰英,王璐. ‘华仲8号’杜仲种仁油脂积累及脂肪酸变化规律[J]. 林业科学, 2023, 59(6): 48-56. |
| [8] | 刘萍,谢宇峰,袁婷,贡献,秦利军. 杜仲叶胶颗粒形态、脂肪酸组成及胶分子量季节变化[J]. 林业科学, 2023, 59(4): 57-67. |
| [9] | 何铁定,邵凤侠,张赛阳,陈娟,杨昌宏,王森. 黑老虎果实发育及种子油脂积累规律[J]. 林业科学, 2023, 59(2): 75-85. |
| [10] | 张晓芳,郭旭展,洪亮,陈涛,符利勇,张会儒. 冬奥核心区华北落叶松和白桦单木冠幅预测模型——组级贝叶斯模型、加性模型和混合效应模型比较[J]. 林业科学, 2022, 58(10): 89-100. |
| [11] | 朱翰文,杜官本,杨忠,吕斌,卢胜高. 基于近红外光谱分析技术的桉木纤维施胶量高低快速判别[J]. 林业科学, 2021, 57(8): 141-146. |
| [12] | 孙龙,刘祺,胡同欣. 森林地表死可燃物含水率预测模型研究进展[J]. 林业科学, 2021, 57(4): 142-152. |
| [13] | 陈芳,程献宝,黄安民,王学顺. 基于人工蜂群算法优化SVM的NIR杉木弹性模量预测[J]. 林业科学, 2021, 57(1): 161-168. |
| [14] | 刘果, 陈鸿鹏, 吴志华, 彭彦, 谢耀坚. 南美油藤种子发育过程的代谢组学和转录组学联合分析[J]. 林业科学, 2019, 55(5): 169-179. |
| [15] | 郭松, 李在留, 薛建辉, 李雪萍, 陈晶晶. 掌叶木不同种源种子的经济性状[J]. 林业科学, 2019, 55(4): 84-96. |
| 阅读次数 | ||||||
|
全文 |
|
|||||
|
摘要 |
|
|||||