
林业科学 ›› 2023, Vol. 59 ›› Issue (3): 115-126.doi: 10.11707/j.1001-7488.LYKX20220339
李彤彤1,郭素娟1,*( ),李艳华2
收稿日期:2022-05-17
出版日期:2023-03-25
发布日期:2023-05-27
通讯作者:
郭素娟
E-mail:gwangzs@263.net
基金资助:
Tongtong Li1,Sujuan Guo1,*(),Yanhua Li2
Received:2022-05-17
Online:2023-03-25
Published:2023-05-27
Contact:
Sujuan Guo
E-mail:gwangzs@263.net
摘要:
目的: 为解决生产中板栗品种易混淆、辨别困难等问题,采用几何形态测量法对不同板栗品种叶形进行数字化分析,建立板栗品种叶形鉴别方法。方法: 以来自我国不同板栗产区的80个品种叶片为试验材料,2年间重复采集叶样,每年6 400张。通过扫描获取叶片图像,采用几何形态测量法及Image J软件,结合板栗叶片特征,选取24个鉴定点并按照一致顺序获取叶形坐标数据。利用Morpho J软件将叶形数据以产区、品种进行分类,进行普氏叠印分析将叶片大小与形状因子分离,进一步形成对称及非对称组分。对数据进行主成分分析、偏最小二乘法的异速生长分析并结合网格变化图将不同品种间叶形差异可视化,同时依据鉴别贡献率对24个鉴定点进行分类;借助典型变量、判别分析及显著性检验进行品种鉴别。结果: 1)不同品种叶片形态差异主要受对称组分影响,在非对称组分中差异不明显。对称组分前2个主成分的累计贡献率为80.6%,可作为板栗品种差异分析的典型变量,对称组分的网格变化图显示品种间差异显著。2)主成分及异速生长分析显示,贡献率排名前14的鉴定点一致,可作为一级鉴定点。3)对称组分中前2个变量的累计贡献率为81.4%。散点图显示,除‘怀九’与‘燕丰’,‘燕山红栗’与‘燕昌’,‘燕龙’与‘燕明’,‘六月爆’与‘叶里藏’相似度较高,其余品种均能准确区分。4)产区间判别分析显示,除湖北与安徽(97.5% vs. 96.9%),其余产区间的正确判别率均达到100.0%;品种间判别分析显示,有99.3%的品种间判别率达到100.0%,个别品种判别率较低且均为95.0%以上,判别结果均存在显著差异(P<0.05)。5)聚类分析反映产区及品种间叶形的相似性,分类结果与种源地理分布基本吻合。结论: 基于24个鉴定点的几何形态测量分析可实现不同板栗品种的准确鉴别,筛选出的14个一级鉴定点,3个次级鉴定点,7个补充鉴定点,可准确反映不同板栗品种叶形的主要差异部位,正确判别率达95.3%~100.0%。建立的板栗品种叶形鉴别数据库和基于叶片形态数字化分析的板栗品种鉴别方法,将对板栗品种精准鉴别提供技术支撑。
中图分类号:
李彤彤,郭素娟,李艳华. 基于叶片形态数字化分析的板栗品种鉴别[J]. 林业科学, 2023, 59(3): 115-126.
Tongtong Li,Sujuan Guo,Yanhua Li. Identification of Chestnut Varieties Based on Digital Analysis of Leaf Morphology[J]. Scientia Silvae Sinicae, 2023, 59(3): 115-126.
表1
80个板栗品种名称及来源"
| 编号No. | 名称Name | 来源Source | 编号No. | 名称Name | 来源Source | |
| 1 | 烟泉 Yanquan | 山东烟台 Yantai, Shandong | 41 | 八月红 Bayuehong | 湖北罗田 Luotian, Hubei | |
| 2 | 东丰 Dongfeng | 山东烟台 Yantai, Shandong | 42 | 罗田乌壳栗 Luotianwukeli | 湖北罗田 Luotian, Hubei | |
| 3 | 金丰 Jinfeng | 山东招远 Zhaoyuan, Shandong | 43 | 罗田中迟栗 Luotianzhongchili | 湖北罗田 Luotian, Hubei | |
| 4 | 红光 Hongguang | 山东莱西 Laixi, Shandong | 44 | 桂花香 Guihuaxiang | 湖北罗田 Luotian, Hubei | |
| 5 | 烟清 Yanqing | 山东烟台 Yantai, Shandong | 45 | 九月寒 Jiuyuehan | 湖北罗田 Luotian, Hubei | |
| 6 | 上丰 Shangfeng | 山东海阳 Haiyang, Shandong | 46 | 罗田早栗 Luotianzaoli | 湖北罗田 Luotian, Hubei | |
| 7 | 清丰 Qingfeng | 山东海阳 Haiyang, Shandong | 47 | 六月爆 Liuyuebao | 湖北罗田 Luotian, Hubei | |
| 8 | 泰栗一号 Tailiyihao | 山东泰安 Taian, Shandong | 48 | 浅刺大板栗 Qiancidabanli | 湖北宜昌 Yichang, Hubei | |
| 9 | 黄棚 Huangpeng | 山东泰安 Taian, Shandong | 49 | 九家种 Jiujiazhong | 江苏洞庭 Dongting, Jiangsu | |
| 10 | 泰安薄壳栗 Taianbokeli | 山东泰安 Taian, Shandong | 50 | 处暑红 Chushuhong | 江苏宜兴 Yixing, Jiangsu | |
| 11 | 红栗 Hongli | 山东泰安 Taian, Shandong | 51 | 焦扎 Jiaozha | 江苏宜兴 Yixing, Jiangsu | |
| 12 | 鲁岳早丰 Luyuezaofeng | 山东泰安 Taian, Shandong | 52 | 大底青 Dadiqing | 江苏宜兴 Yixing, Jiangsu | |
| 13 | 沂蒙短枝 Yimengduanzhi | 山东泰安 Taian, Shandong | 53 | 短扎 Duanzha | 江苏无锡 Wuxi, Jiangsu | |
| 14 | 丽抗 Likang | 山东泰安 Taian, Shandong | 54 | 铁粒头 Tielitou | 江苏无锡 Wuxi, Jiangsu | |
| 15 | 宋家早 Songjiazao | 山东泰安 Taian, Shandong | 55 | 广德大红袍 Guangdedahongpao | 安徽广德 Guangde, Anhui | |
| 16 | 鲁栗2号 Luli No.2 | 山东泰安 Taian, Shandong | 56 | 蜜蜂球 Mifengqiu | 安徽舒城 Shucheng, Anhui | |
| 17 | 石丰 Shifeng | 山东泰安 Taian, Shandong | 57 | 叶里藏 Yelicang | 安徽舒城 Shucheng, Anhui | |
| 18 | 蒙早 Mengzao | 山东费县 Feixian, Shandong | 58 | 粘底板 Zhandiban | 安徽舒城 Shucheng, Anhui | |
| 19 | 燕山红栗 Yanshanhongli | 北京昌平 Changping, Beijing | 59 | 镇安大板栗 Zhenandabanli | 陕西镇安 Zhenan, Shaanxi | |
| 20 | 燕昌 Yanchang | 北京昌平 Changping, Beijing | 60 | 柞板11号 Zhaban No.11 | 陕西柞水 Zhashui, Shaanxi | |
| 21 | 银丰 Yinfeng | 北京昌平 Changping, Beijing | 61 | 柞板14号 Zhaban No.14 | 陕西柞水 Zhashui, Shaanxi | |
| 22 | 短花 Duanhua | 北京密云 Miyun, Beijing | 62 | 毛栗 Maoli | 陕西宝鸡 Baoji, Shaanxi | |
| 23 | 怀黄 Huaihuang | 北京怀柔 Huairou, Beijing | 63 | 泰山一号 Taishanyihao | 陕西宝鸡 Baoji, Shaanxi | |
| 24 | 怀九 Huaijiu | 北京怀柔 Huairou, Beijing | 64 | 社栗 Sheli | 陕西宝鸡 Baoji, Shaanxi | |
| 25 | 燕丰 Yanfeng | 北京怀柔 Huairou, Beijing | 65 | 长安明拣栗 Changanminjianli | 陕西西安 Xi’an, Shaanxi | |
| 26 | 燕昌早生 Yanchangzaosheng | 北京昌平 Changping, Beijing | 66 | 长安灰拣栗 Changanhuijianli | 陕西西安 Xi’an, Shaanxi | |
| 27 | 京暑红 Jingshuhong | 北京怀柔 Huairou, Beijing | 67 | 长安铁蛋栗 Changantiedanli | 陕西西安 Xi’an, Shaanxi | |
| 28 | 紫珀 Zipo | 河北遵化 Zunhua, Hebei | 68 | 确山紫油栗 Queshanziyouli | 河南确山 Queshan, Henan | |
| 29 | 遵达栗 Zundali | 河北遵化 Zunhua, Hebei | 69 | 豫丰红 Yufenghong | 河南罗山 Luoshan, Henan | |
| 30 | 遵化短刺 Zunhuaduanci | 河北遵化 Zunhua, Hebei | 70 | 豫罗红 Yuluohong | 河南罗山 Luoshan, Henan | |
| 31 | 东陵明珠 Donglingmingzhu | 河北遵化 Zunhua, Hebei | 71 | 易门1号 Yimen No.1 | 云南易门 Yimen, Yunnan | |
| 32 | 塔丰 Tafeng | 河北遵化 Zunhua, Hebei | 72 | 易门2号 Yimen No.2 | 云南易门 Yimen, Yunnan | |
| 33 | 燕山短枝 Yanshanduanzhi | 河北迁西 Qianxi, Hebei | 73 | 易门3号 Yimen No.3 | 云南易门 Yimen, Yunnan | |
| 34 | 燕山早丰 Yanshanzaofeng | 河北迁西 Qianxi, Hebei | 74 | 宝塔板栗 Baotabanli | 云南宝塔 Baota,Yunnan | |
| 35 | 大板红 Dabanhong | 河北迁西 Qianxi, Hebei | 75 | 弥勒板栗 Milebanli | 云南弥勒 Mile, Yunnann | |
| 36 | 迁西早红 Qianxizaohong | 河北迁西 Qianxi, Hebei | 76 | 永仁板栗 Yongrenbanli | 云南永仁 Yongren, Yunnan | |
| 37 | 燕宝 Yanbao | 河北昌黎 Changli, Hebei | 77 | 云富 Yunfu | 云南富民 Fumin, Yunnann | |
| 38 | 燕龙 Yanlong | 河北昌黎 Changli, Hebei | 78 | 荔波早栗 Libozaoli | 贵州荔波 Libo, Guizhou | |
| 39 | 燕明 Yanming | 河北昌黎 Changli, Hebei | 79 | 荔波中栗 Libozhongli | 贵州荔波 Libo, Guizhou | |
| 40 | 昌黎8号 Changli No.8 | 河北昌黎 Changli, Hebei | 80 | 荔波晚栗 Libowanli | 贵州荔波 Libo, Guizhou |
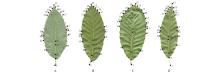
图1
板栗叶片的鉴定点位置 A: ‘燕山短枝’‘Yanshanduanzhi’; B: ‘桂花香’ ‘Guihuaxiang’; C: ‘柞板14号’ ‘Zhaban’ No.14; D: ‘易门1号’ ‘Yimen No.1’."
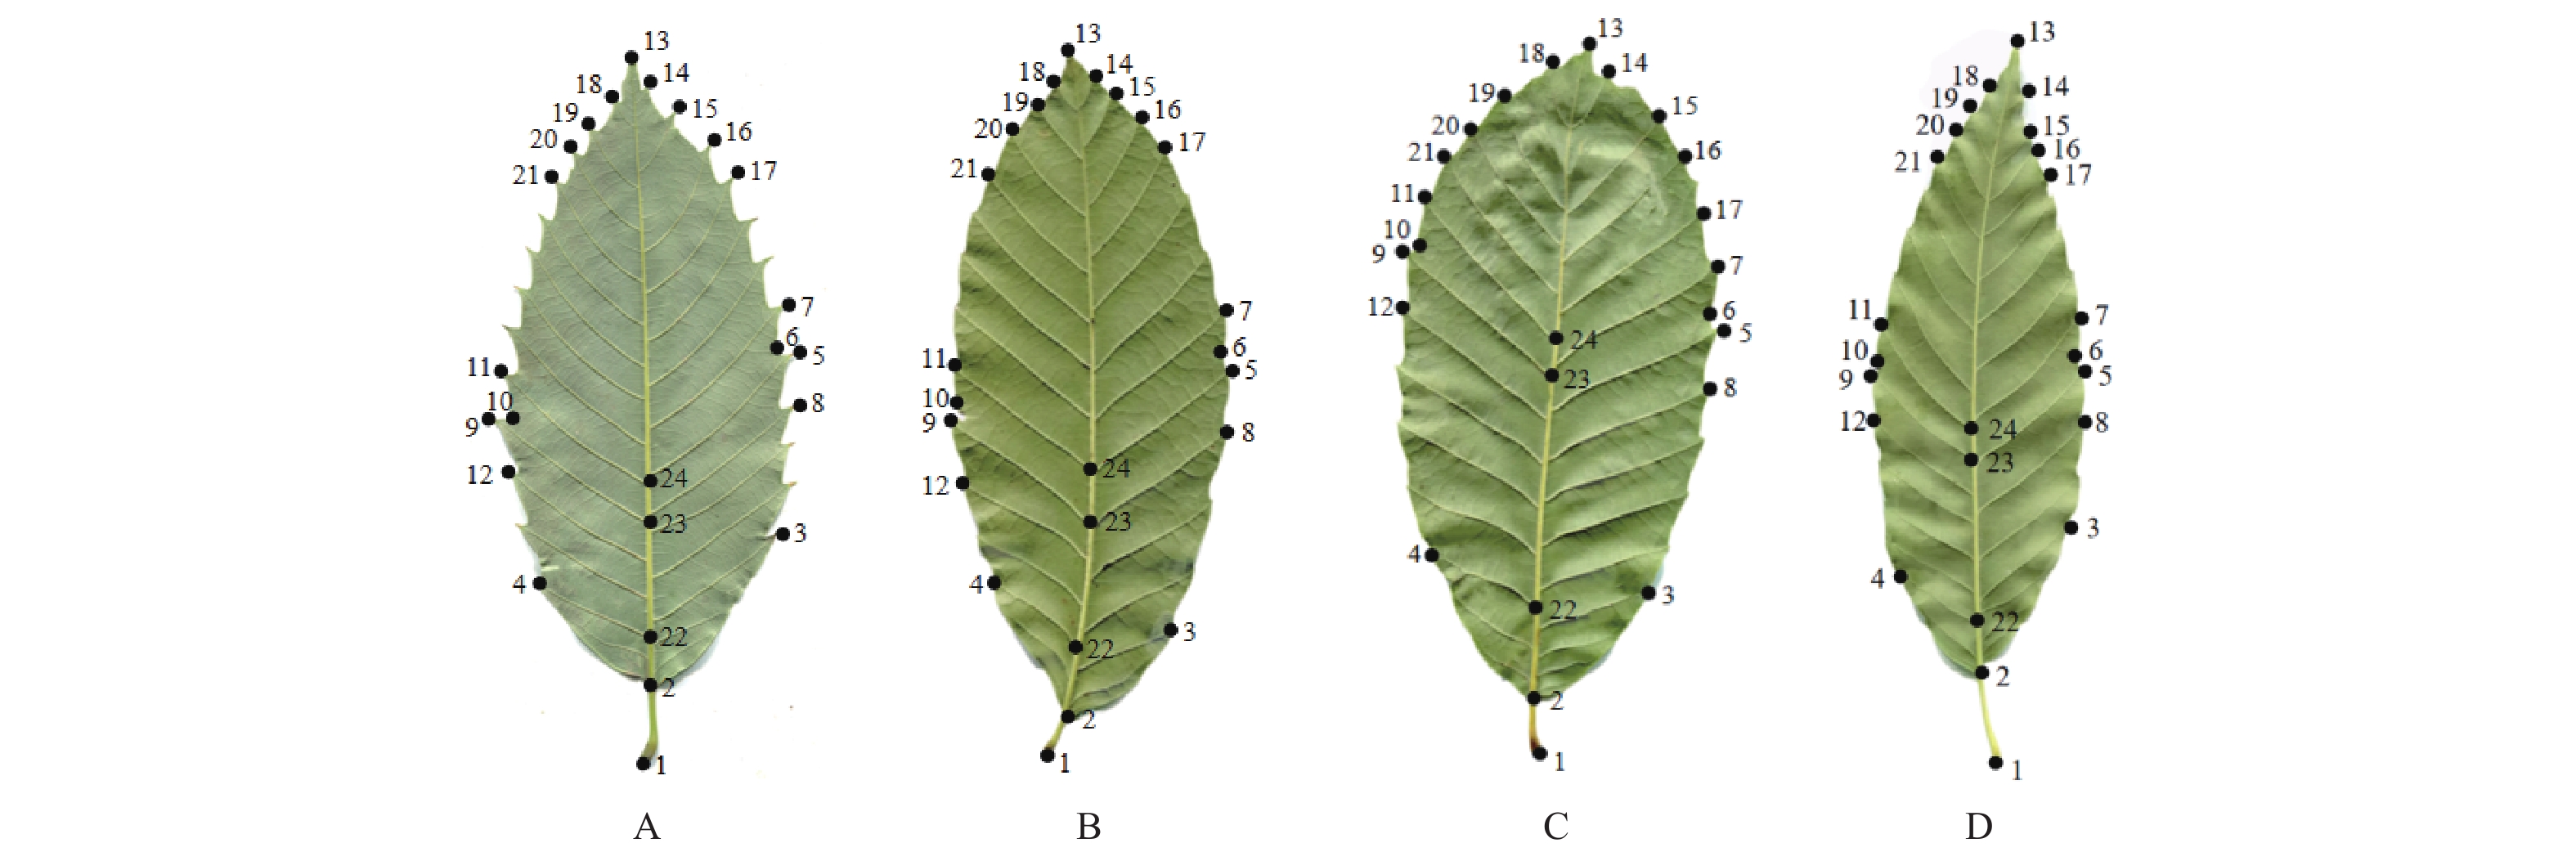
表2
叶片鉴定点位置描述①"
| 鉴定点Identification marks | 描述Description |
| IM1 | 叶柄起始点Petiole starting point |
| IM2 | 叶柄与叶片的交界点Junction of petiole and leaf |
| IM3–4 | 从叶柄起向上第1锯齿鉴定点Identification mark of the first serration upward from the petiole |
| IM5–9 | 叶片最宽处的锯齿鉴定点Identification mark of the serration at the widest part of the blade |
| IM6–10 | 叶片最宽处锯齿上部凹陷点Concave point on the upper serration at the widest part of the blade |
| IM7–11 | 叶片最宽处锯齿向上1锯齿鉴定点Identification mark on the upper serration at the widest part of the blade |
| IM8–12 | 叶片最宽处锯齿向下1锯齿鉴定点Identification mark on the lower serration at the widest part of the blade |
| IM13 | 叶片顶端Apex of the leaf blade |
| IM14–18 | 叶片顶端向下第1锯齿鉴定点Identification mark of the first serration at the lower part of the leaf apex |
| IM15–19 | 叶片顶端向下第2锯齿鉴定点Identification mark of the second serration at the lower part of the leaf apex |
| IM16–20 | 叶片顶端向下第3锯齿鉴定点Identification mark of the third serration at the lower part of the leaf apex |
| IM17–21 | 叶片顶端向下第4锯齿鉴定点Identification mark of the fourth serration at the lower part of the leaf apex |
| IM22 | 从叶柄起向上第1锯齿的叶脉交叉点Vein intersection of the first serration upwards from the petiole |
| IM23 | 最宽处锯齿的叶脉交叉点Vein intersection of the serrations at the widest point |
| IM24 | 中心点上紧邻的主叶脉交叉点Vein intersection above center point |
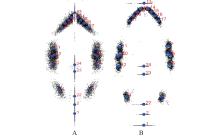
图2
基于叶片对称组分(A)和非对称组分(B)的普氏叠印分析"
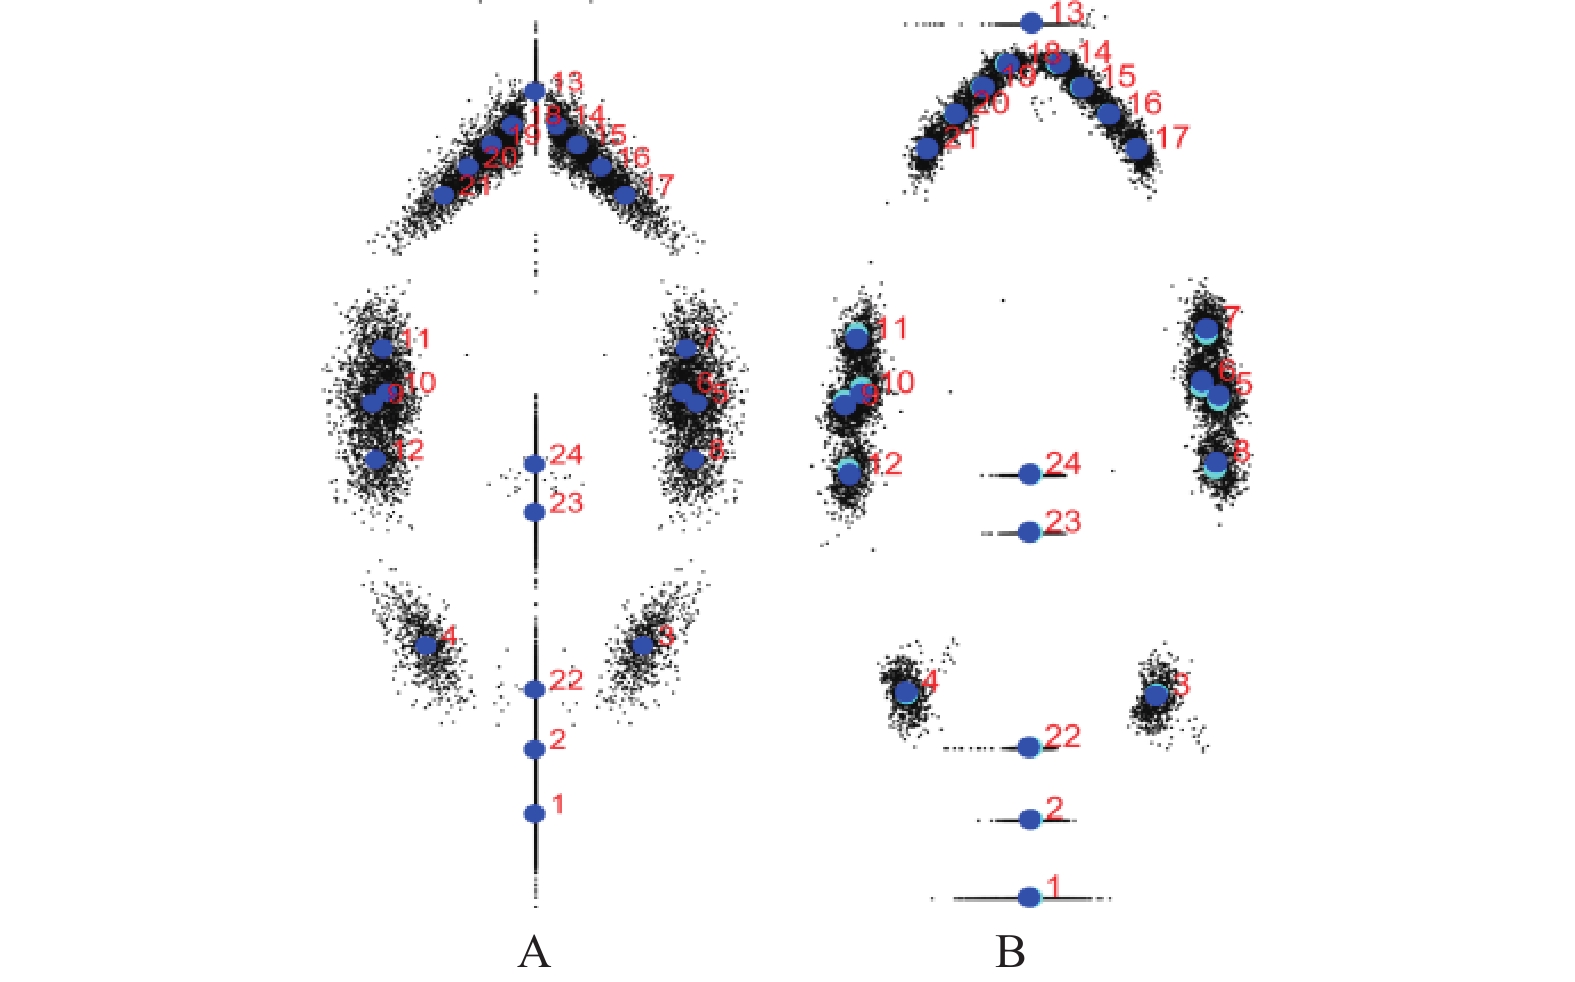
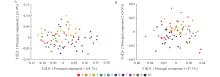
图3
80个品种叶片在对称组分(A)和非对称组分(B)的PC散点图 1: 山东Shandong; 2: 北京Beijing; 3: 河北Hebei; 4: 湖北Hubei; 5: 江苏Jiangsu; 6: 安徽Anhui; 7: 陕西Shaanxi; 8: 河南Henan; 9: 云南Yunnan; 10: 贵州Guizhou. 下同The same below."
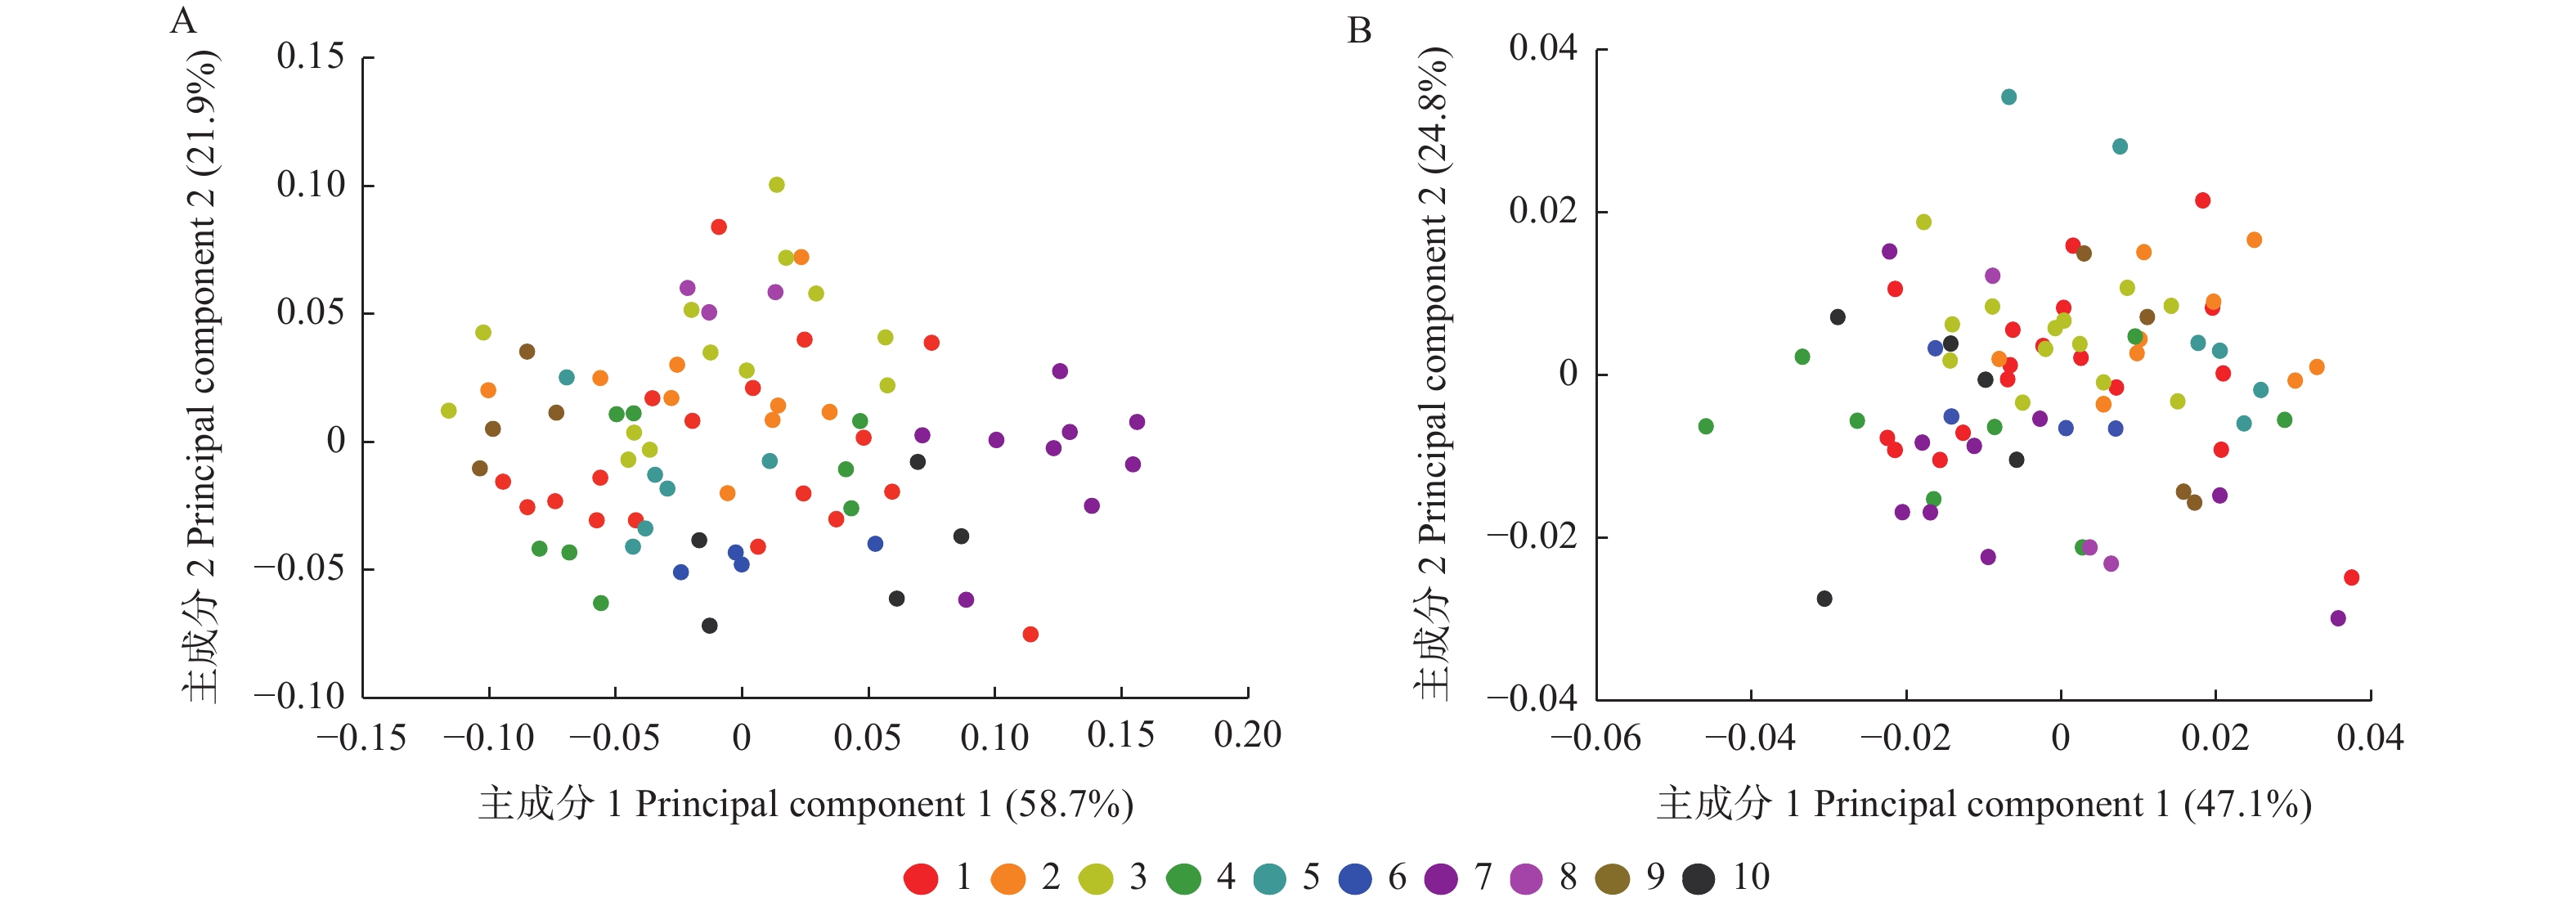
表3
叶片对称和非对称组分的前5个主成分信息"
| 组分Component | 主成分PCA | 特征值Eigenvalues | 贡献率Variance(%) | 累计贡献率Cumulative(%) |
| 对称Symmetric | PC1 | 3.929 | 52.716 | 58.716 |
| PC2 | 1.465 | 21.897 | 80.614 | |
| PC3 | 0.443 | 6.622 | 87.236 | |
| PC4 | 0.333 | 4.971 | 92.207 | |
| PC5 | 0.181 | 2.708 | 94.915 | |
| 非对称Asymmetric | PC1 | 0.318 | 47.138 | 47.138 |
| PC2 | 0.167 | 24.829 | 71.968 | |
| PC3 | 0.062 | 9.208 | 81.175 | |
| PC4 | 0.036 | 5.359 | 86.534 | |
| PC5 | 0.019 | 2.741 | 89.275 |
表4
基于叶片对称组分PCA的鉴定点综合得分及贡献率"
| 鉴定点IM | 综合得分Scores | 排名Rank | 贡献率(%)Contribution | 鉴定点IM | 综合得分Scores | 排名Rank | 贡献率Contribution(%) | 鉴定点IM | 综合得分Scores | 排名Rank | 贡献率Contribution(%) | ||
| IM1 | 0.188 | 24 | 2.284 | IM9 | 0.450 | 4 | 5.466 | IM17 | 0.409 | 9 | 4.965 | ||
| IM2 | 0.261 | 18 | 3.171 | IM10 | 0.248 | 20 | 3.013 | IM18 | 0.231 | 22 | 2.806 | ||
| IM3 | 0.415 | 8 | 5.041 | IM11 | 0.441 | 6 | 5.357 | IM19 | 0.404 | 12 | 4.908 | ||
| IM4 | 0.415 | 7 | 5.041 | IM12 | 0.451 | 1 | 5.479 | IM20 | 0.317 | 14 | 3.852 | ||
| IM5 | 0.450 | 3 | 5.466 | IM13 | 0.233 | 21 | 2.830 | IM21 | 0.409 | 10 | 4.965 | ||
| IM6 | 0.248 | 19 | 3.013 | IM14 | 0.231 | 23 | 2.806 | IM22 | 0.268 | 17 | 3.256 | ||
| IM7 | 0.441 | 5 | 5.357 | IM15 | 0.404 | 11 | 4.908 | IM23 | 0.273 | 16 | 3.316 | ||
| IM8 | 0.451 | 2 | 5.479 | IM16 | 0.317 | 13 | 3.852 | IM24 | 0.277 | 15 | 3.365 |
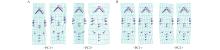
图4
叶片在对称组分(A)和非对称组分(B)的PC网格变化 网格变化,PC的值为正负极值(?,+)下的叶片形态。"
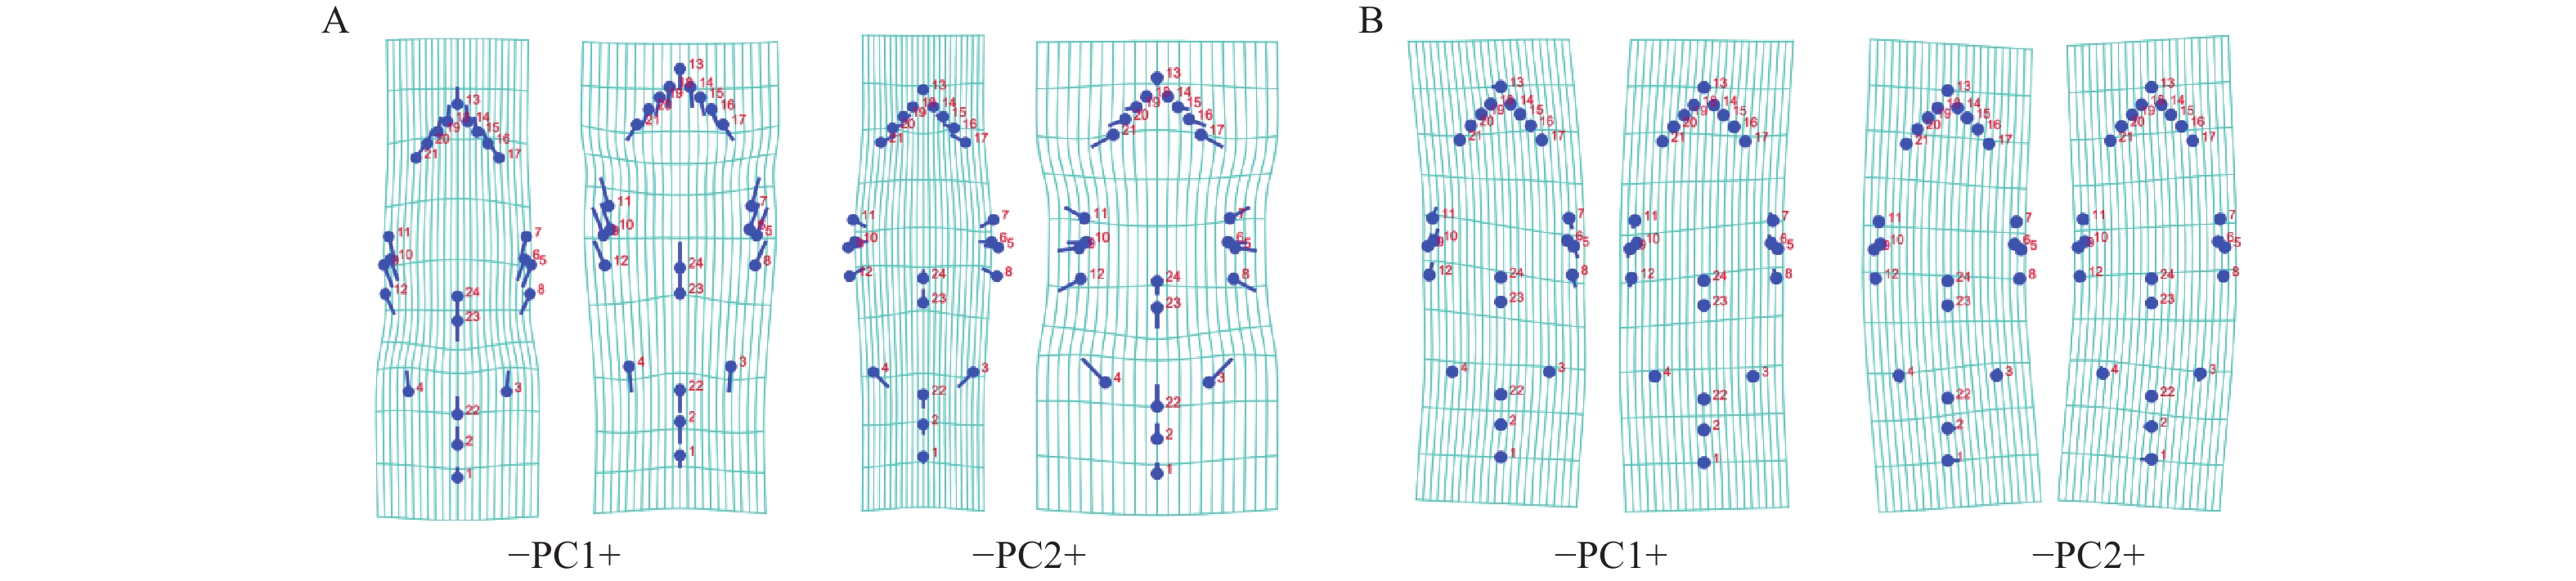
表5
基于叶片对称组分AGA的鉴定点综合得分"
| 鉴定点IM | 综合得分Scores | 排名Rank | 鉴定点IM | 综合得分Scores | 排名Rank | 鉴定点IM | 综合得分Scores | 排名Rank | ||
| IM1 | 0.236 | 17 | IM9 | 0.358 | 6 | IM17 | 0.362 | 3 | ||
| IM2 | 0.125 | 20 | IM10 | 0.247 | 16 | IM18 | 0.129 | 19 | ||
| IM3 | 0.396 | 1 | IM11 | 0.300 | 8 | IM19 | 0.266 | 14 | ||
| IM4 | 0.396 | 2 | IM12 | 0.290 | 10 | IM20 | 0.289 | 12 | ||
| IM5 | 0.358 | 5 | IM13 | 0.123 | 21 | IM21 | 0.362 | 4 | ||
| IM6 | 0.247 | 15 | IM14 | 0.129 | 18 | IM22 | 0.037 | 24 | ||
| IM7 | 0.300 | 7 | IM15 | 0.266 | 13 | IM23 | 0.053 | 23 | ||
| IM8 | 0.290 | 9 | IM16 | 0.289 | 11 | IM24 | 0.075 | 22 |
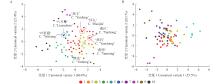
图5
80个品种叶片在对称组分(A)和非对称组分(B)的CV散点图"
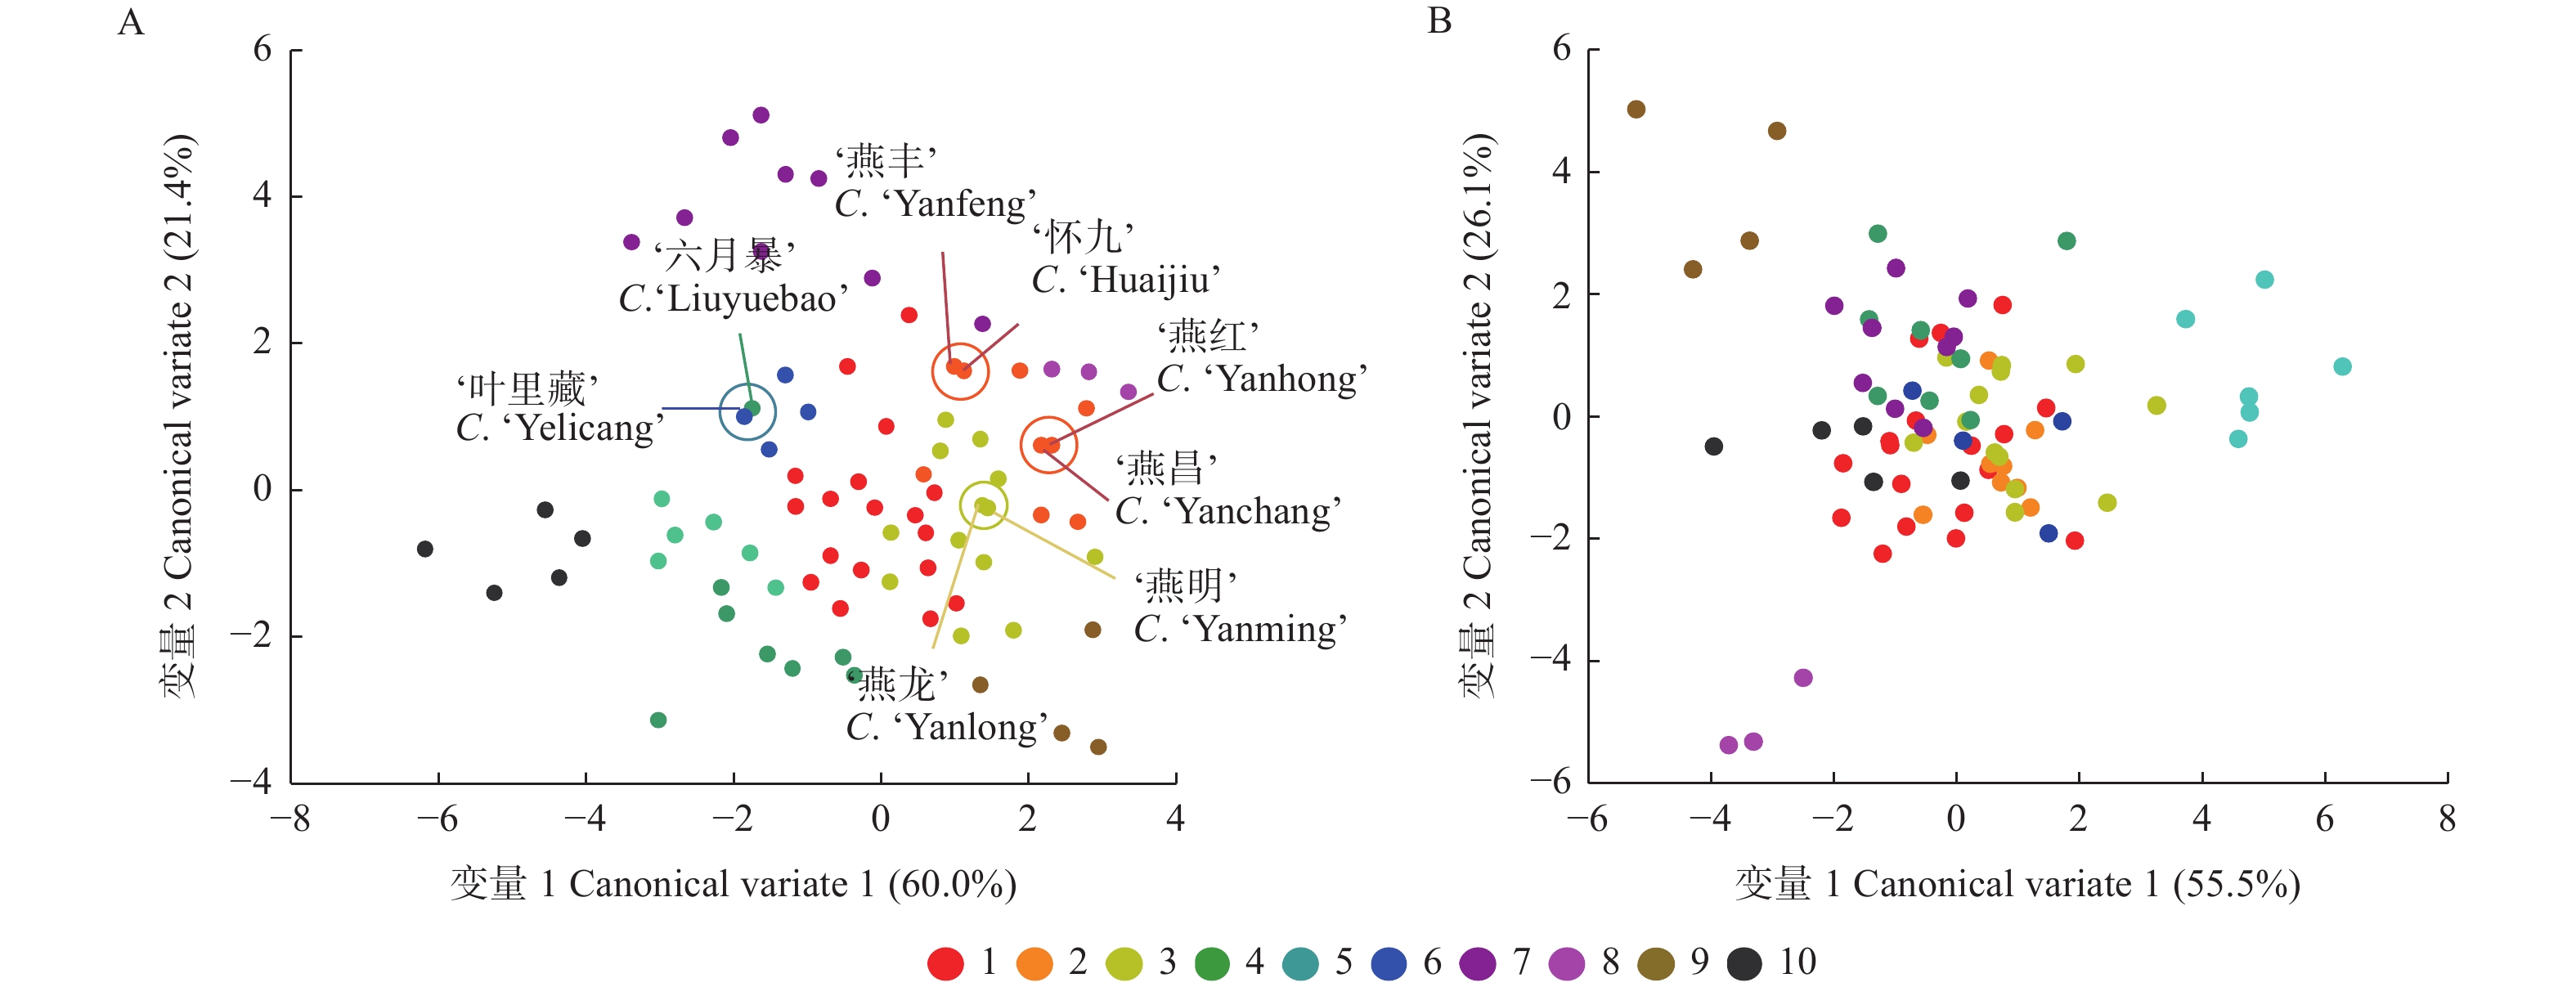
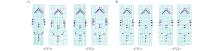
图6
叶片在对称组分(A)和非对称组分(B)的CV网格变化"
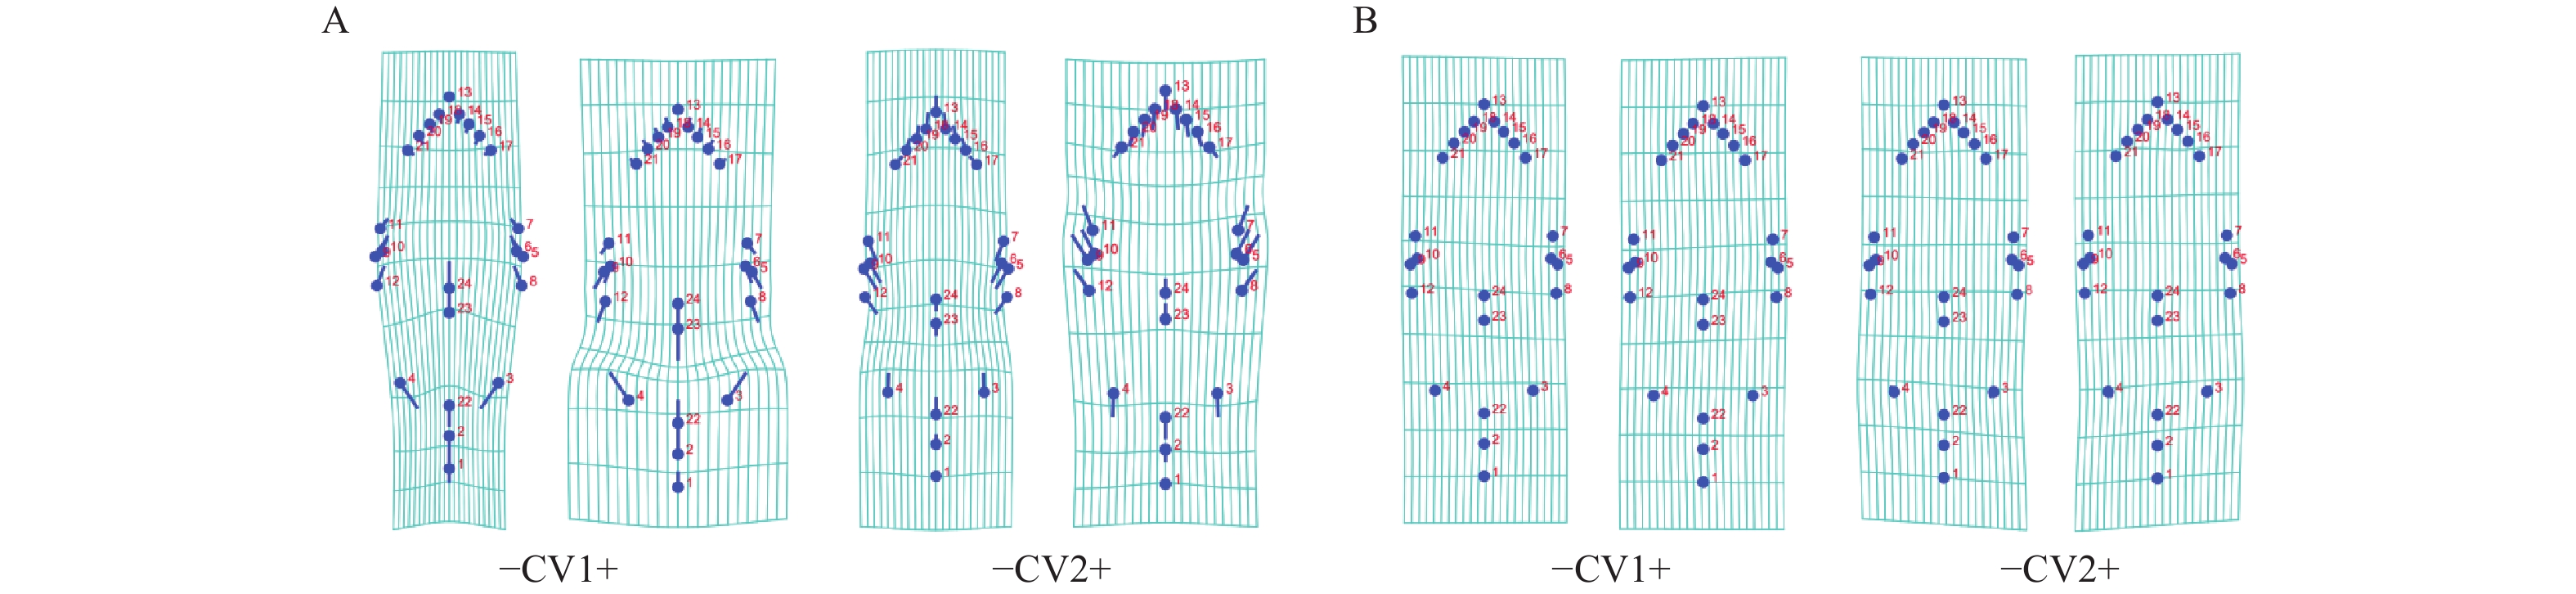
表6
不同产区间板栗叶片的马氏距离(基于10 000次重复)"
| 山东Shandong | 北京 Beijing | 河北 Hebei | 湖北 Hubei | 江苏 Jiangsu | 安徽 Anhui | 陕西 Shaanxi | 河南 Henan | 云南 Yunnan | |
| 北京 Beijing | 3.071 | ||||||||
| 河北 Hebei | 2.676 | 3.071 | |||||||
| 湖北 Hubei | 4.905 | 2.676 | 4.764 | ||||||
| 江苏 Jiangsu | 5.572 | 4.905 | 4.079 | 3.739 | |||||
| 安徽 Anhui | 5.260 | 5.572 | 3.770 | 2.462 | 3.054 | ||||
| 陕西 Shaanxi | 4.178 | 5.260 | 4.676 | 5.346 | 4.104 | 4.232 | |||
| 河南 Henan | 4.551 | 4.178 | 4.870 | 5.761 | 5.259 | 6.045 | 4.610 | ||
| 云南 Yunnan | 5.517 | 4.551 | 5.448 | 5.953 | 5.584 | 5.802 | 7.054 | 6.962 | |
| 贵州 Guizhou | 6.147 | 5.517 | 6.223 | 5.278 | 5.789 | 5.331 | 5.645 | 6.290 | 5.032 |
表7
不同产区板栗叶片的马氏距离P值(基于10 000次重复)"
| 山东Shandong | 北京Beijing | 河北Hebei | 湖北Hubei | 江苏Jiangsu | 安徽Anhui | 陕西Shaanxi | 河南Henan | 云南Yunnan | |
| 北京 Beijing | <.001 | ||||||||
| 河北 Hebei | <.001 | 0.002 | |||||||
| 湖北 Hubei | <.001 | <.001 | <.001 | ||||||
| 江苏 Jiangsu | 0.015 | <.001 | 0.007 | <.001 | |||||
| 安徽 Anhui | 0.004 | 0.001 | <.001 | 0.009 | 0.032 | ||||
| 陕西 Shaanxi | <.001 | <.001 | <.001 | <.001 | <.001 | 0.004 | |||
| 河南 Henan | <.001 | <.001 | 0.002 | <.001 | <.001 | <.001 | <.001 | ||
| 云南 Yunnan | <.001 | <.001 | <.001 | 0.003 | 0.002 | <.001 | <.001 | 0.003 | |
| 贵州 Guizhou | <.001 | 0.001 | <.001 | 0.003 | <.001 | 0.009 | <.001 | <.001 | 0.003 |
表8
不同产区间叶形的判别率及T2检验①"
| 产区编号Area No. | T2统计量T-square | 判别率Discrimination rate (%) | 产区编号Area No. | T2统计量T-square | 判别率Discrimination rate (%) | 产区编号Area No. | T2统计量T-square | 判别率Discrimination rate (%) | ||
| 1&2 | 724.70 | 100.00 vs. 100.00 | 2&9 | 527.78 | 100.00 vs. 100.00 | 5&6 | 517.93 | 100.00 vs. 100.00 | ||
| 1&3 | 806.22 | 100.00 vs. 100.00 | 2&10 | 764.70 | 100.00 vs. 100.00 | 5&7 | 722.64 | 100.00 vs. 100.00 | ||
| 1&4 | 887.51 | 100.00 vs. 100.00 | 3&4 | 577.85 | 100.00 vs. 100.00 | 5&8 | 908.85 | 100.00 vs. 100.00 | ||
| 1&5 | 577.27 | 100.00 vs. 100.00 | 3&5 | 505.23 | 100.00 vs.100.00 | 5&9 | 908.45 | 100.00 vs. 100.00 | ||
| 1&6 | 605.58 | 100.00 vs. 100.00 | 3&6 | 577.84 | 100.00 vs. 100.00 | 5&10 | 572.49 | 100.00 vs. 100.00 | ||
| 1&7 | 563.68 | 100.00 vs. 100.00 | 3&7 | 683.27 | 100.00 vs. 100.00 | 6&7 | 655.22 | 100.00 vs. 100.00 | ||
| 1&8 | 463.41 | 100.00 vs. 100.00 | 3&8 | 555.86 | 100.00 vs. 100.00 | 6&8 | 944.27 | 100.00 vs. 100.00 | ||
| 1&9 | 729.22 | 100.00 vs. 100.00 | 3&9 | 626.67 | 100.00 vs. 100.00 | 6&9 | 909.65 | 100.00 vs. 100.00 | ||
| 1&10 | 807.11 | 100.00 vs. 100.00 | 3&10 | 770.56 | 100.00 vs. 100.00 | 6&10 | 866.66 | 100.00 vs. 100.00 | ||
| 2&3 | 550.69 | 100.00 vs. 100.00 | 4&5 | 441.28 | 100.00 vs. 100.00 | 7&8 | 747.39 | 100.00 vs. 100.00 | ||
| 2&4 | 648.05 | 100.00 vs. 100.00 | 4&6 | 440.60 | 97.50 vs. 96.86 | 7&9 | 747.33 | 100.00 vs. 100.00 | ||
| 2&5 | 736.05 | 100.00 vs. 100.00 | 4&7 | 912.17 | 100.00 vs. 100.00 | 7&10 | 811.76 | 100.00 vs. 100.00 | ||
| 2&6 | 840.09 | 100.00 vs. 100.00 | 4&8 | 774.40 | 100.00 vs. 100.00 | 8&9 | 911.90 | 100.00 vs. 100.00 | ||
| 2&7 | 696.78 | 100.00 vs. 100.00 | 4&9 | 641.76 | 100.00 vs. 100.00 | 8&10 | 727.34 | 100.00 vs. 100.00 | ||
| 2&8 | 658.31 | 100.00 vs. 100.00 | 4&10 | 445.86 | 100.00 vs. 100.00 | 9&10 | 811.142 | 100.00 vs. 100.00 |
表9
不同板栗品种间叶形判别率及T 2检验①"
| 品种编号No. | T2统计量T-square | 判别率Discrimination rate (%) | 品种编号No. | T2统计量T-square | 判别率Discrimination rate (%) | 品种编号No. | T2统计量T-square | 判别率Discrimination rate (%) | ||
| 2&3 | 154.00 | 98.25 vs. 100.00 | 38&39 | 114.32 | 95.33 vs. 95.62 | 56&57 | 259.12 | 97.12 vs. 100.00 | ||
| 2&15 | 216.40 | 97.44 vs. 100.00 | 44&48 | 172.00 | 100.00 vs. 98.75 | 56&58 | 168.01 | 96.25 vs. 100.00 | ||
| 7&16 | 197.70 | 97.26 vs. 100.000 | 46&57 | 169.22 | 95.75 vs. 95.27 | 65&67 | 232.33 | 96.25 vs. 99.00 | ||
| 14&15 | 221.00 | 97.50 vs. 100.00 | 51&53 | 246.00 | 98.72 vs. 100.00 | 66&67 | 238.35 | 96.25 vs. 100.00 | ||
| 19&20 | 140.17 | 96.25 vs. 96.82 | 52&53 | 168.01 | 96.67 vs. 100.00 | 68&69 | 192.00 | 97.50 vs. 100.00 | ||
| 19&24 | 190.63 | 98.68 vs. 100.00 | 53&58 | 178.60 | 97.37 vs. 100.00 | 76&77 | 166.750 | 98.75 vs. 100.00 | ||
| 24&25 | 184.00 | 95.61 vs. 96.20 | 55&57 | 192.00 | 98.63 vs. 100.00 | 78&79 | 228.22 | 97.25 vs. 98.30 |
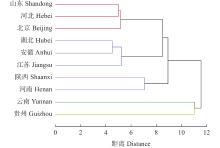
图7
不同产区基于板栗品种叶片形态的Ward聚类分析"
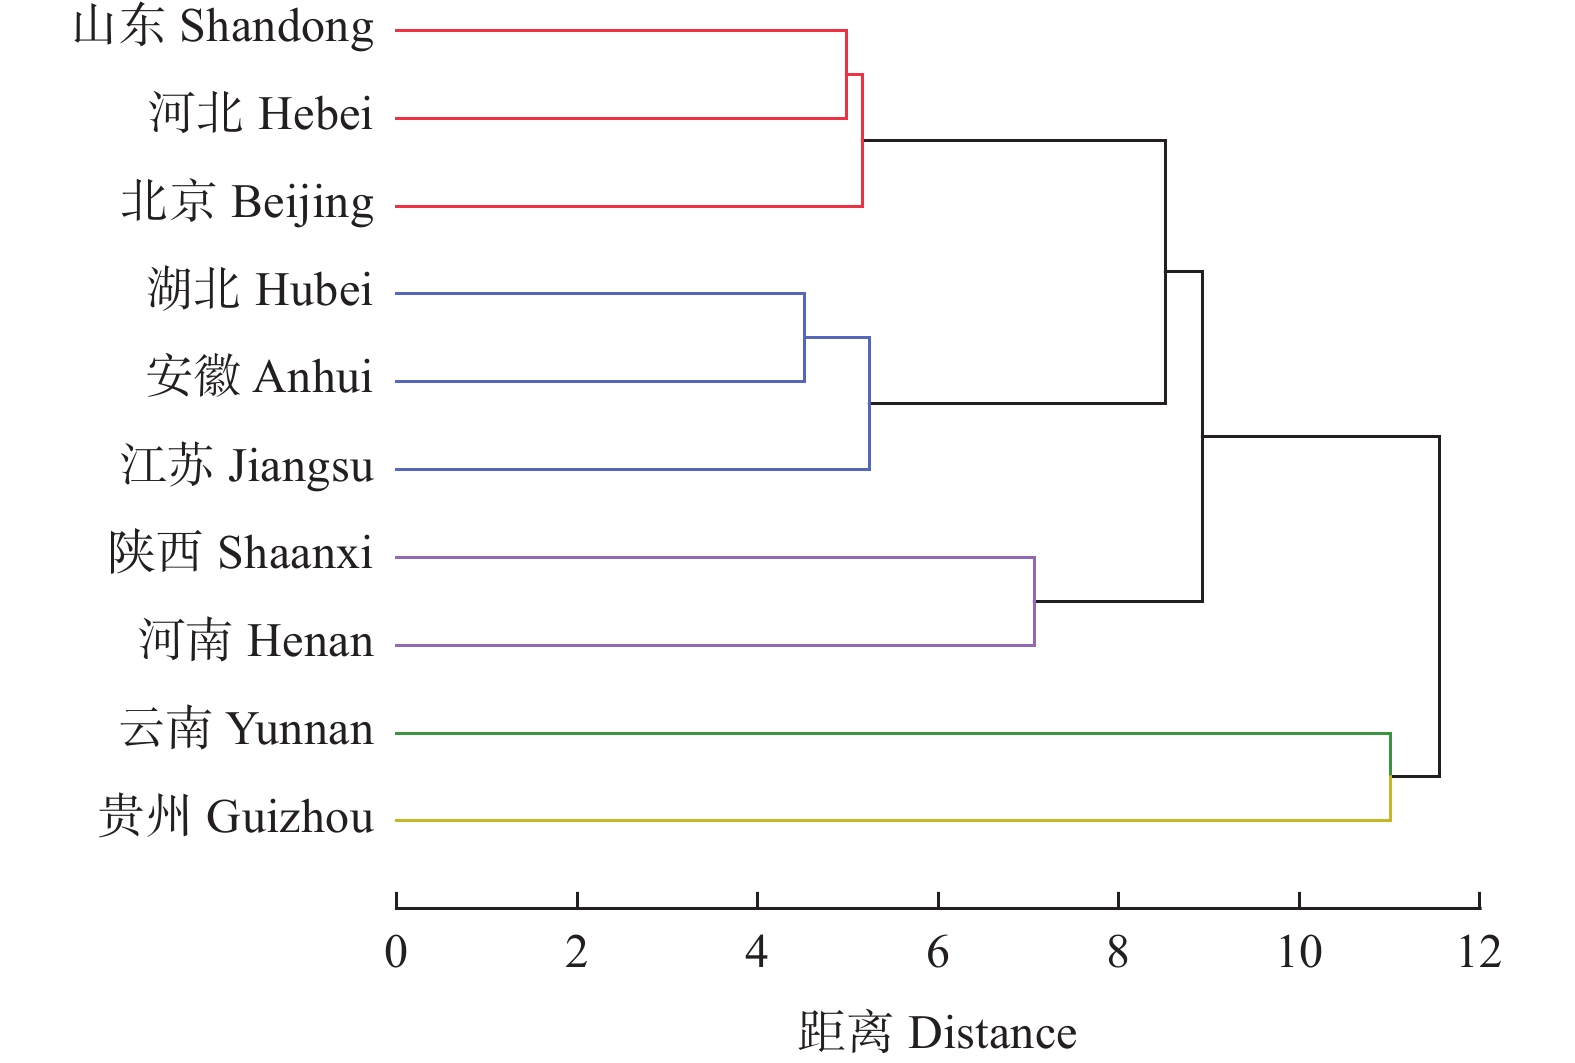
图8
不同板栗品种叶片平均形态的Ward聚类分析"
| 白 明, 杨星科, 李 静, 等 几何形态学: 关于形态定量比较的科学计算工具. 科学通报, 2014, 59 (10): 887- 894. | |
| Bai M, Yang X K, Li J, et al Geometric morphometrics, a super scientific computing tool in morphology comparison. Chinese Science Bulletin, 2014, 59 (10): 887- 894. | |
| 蔡小娜. 2013. 基于数字图像的主要蛾类害虫分类识别研究. 保定: 河北农业大学 | |
| Cai X N. 2013. Classification research on moths based on digital images. Baoding: Hebei Agricultural University. [in Chinese] | |
|
蔡小娜, 苏筱雨, 黄大庄, 等 基于几何形态测量学的天蛾科成虫数字化分类. 林业科学, 2019, 55 (1): 38- 46.
doi: 10.11707/j.1001-7488.20190105 |
|
|
Cai X N, Su X Y, Huang D Z, et al Digital classification of sphingid moths adults (Lepidoptera: Sphingidae) based on geometric morphometry. Scientia Silvae Sinicae, 2019, 55 (1): 38- 46.
doi: 10.11707/j.1001-7488.20190105 |
|
| 曹卫群, 裴 勇. 2014. 一种基于数字图像的植物种类识别方法. 中国, CN201110262117.3, 1−16. | |
| Cao W Q, Pei Y. 2014. A method for identifying plant species based on digital images. China, CN102324038A, 1−16. [in Chinese] | |
|
戴志聪, 杜道林, 司春灿, 等 用扫描仪及Image J软件精确测量叶片形态数量特征的方法. 广西植物, 2009, 29 (3): 342- 347.
doi: 10.3969/j.issn.1000-3142.2009.03.013 |
|
|
Dai Z C, Du D L, Si C C, et al A method to exactly measure the morphological quantity of leaf using scanner and Image J software. Guihaia, 2009, 29 (3): 342- 347.
doi: 10.3969/j.issn.1000-3142.2009.03.013 |
|
| 杜梓甄. 2021. 基于几何形态学对跃度蝗属及其形态近似属种的快速鉴定(直翅目-蝗总科). 沈阳: 沈阳农业大学. | |
| Du Z Z. 2021. Rapid identification of the genus Podosmopsis and similar genera (species) in morphology based on geometric morphology (Orthoptera: Acridoidea). Shenyang: Shenyang Agriculture University. [in Chinese] | |
| 范建平, 刘鑫昱, 张 翔, 等. 2019. 一种基于叶片形状和边缘特征的植物叶片识别方法. 中国, CN107122781B, 1−12. | |
| Fan J P, Liu X Y, Zhang X, et al. 2019. A method for identifying plant leaves based on leaf morphology and edge features. China, CN107122781B, 1−12. [in Chinese] | |
|
顾建成, 聂兴华, 曹小艳, 等 栗属植物叶片形态特征在种间识别的研究. 电子显微学报, 2021, 40 (4): 432- 440.
doi: 10.3969/j.issn.1000-6281.2021.04.012 |
|
|
Gu J C, Nie X H, Cao X Y, et al Study on leaf morphological characteristics of Castanea in interspecies identification . Journal of Chinese Electron Microscopy Society, 2021, 40 (4): 432- 440.
doi: 10.3969/j.issn.1000-6281.2021.04.012 |
|
|
郭 燕, 张树航, 李 颖, 等 中国板栗36个叶片表型性状的多样性. 中国农业科学, 2022, 55 (5): 991- 1009.
doi: 10.3864/j.issn.0578-1752.2022.05.012 |
|
|
Guo Y, Zhang S H, Li Y, et al Diversity analysis of 36 leaf phenotypic traits of Chinese chestnut. Scientia Agricultura Sinica, 2022, 55 (5): 991- 1009.
doi: 10.3864/j.issn.0578-1752.2022.05.012 |
|
| 何秀娟, 邱文明, 徐育海 利用叶片形态学性状和RAPD分子标记检测湖北板栗资源遗传多样性. 中国南方果树, 2014, 43 (2): 12- 16. | |
| He X J, Qiu W M, Xu Y H Analysis of genetic diversity of chestnut germplasm resources in Hubei Province by leaf morphological characteristics and RAPD makers. South China Fruits, 2014, 43 (2): 12- 16. | |
| 李贺敏, 王 森, 张红瑞, 等 基于叶表皮特征对25科40种药用植物显微鉴别的研究. 中草药, 2021, 50 (2): 150- 156. | |
| Li H M, Wang S, Zhang H R, et al Research of microscopic identification of 40 medicinal plants from 25 families based on characteristics of leaf epidermis. Chinese Traditional and Herbal Drugs, 2021, 50 (2): 150- 156. | |
| 刘 媛, 吕 佳, 宋 佳, 等 基于几何形态测量学的植物鉴定方法. 植物科学学报, 2017, 35 (6): 894- 899. | |
| Liu Y, Lü J, Song J, et al Plant species delimitation method based on geometric morphometrics. Plant Science Journal, 2017, 35 (6): 894- 899. | |
|
刘亚斌, 郭素娟 迁西地区39份板栗种质叶片的功能性状多样性. 东北林业大学学报, 2020, 48 (4): 8- 19.
doi: 10.3969/j.issn.1000-5382.2020.04.002 |
|
|
Liu Y B, Guo S J Leaf functional traits of 41 chestnut germplasms in Qianxi region. Journal of Northeast Forestry University, 2020, 48 (4): 8- 19.
doi: 10.3969/j.issn.1000-5382.2020.04.002 |
|
| 路 超. 2017. 不同板栗种质资源的评价分析与筛选. 北京: 北京林业大学. | |
| Lu C. 2017. Evaluation analysis and selection of different Chinese chestnut germplasm resources. Beijing: Beijing Forestry University. [in Chinese] | |
| 庞丁玮, 王 军, 原阳晨, 等 “冀洪1号”黑枣与普通黑枣叶形性状差异研究. 林业与生态学报, 2021, 36 (2): 132- 137. | |
| Pang D W, Wang J, Yuan Y C, et al Study on inheritance and variation of leaf morphology traits of “Jihong No. 1” and ordinary Diospyros lotus L. Forestry and Ecological Sciences, 2021, 36 (2): 132- 137. | |
| 宋 佳, 侯 盟, 鲁四海, 等 一种基于鉴定点的叶片几何形态分析方法. 兰州大学学报(自然科学版), 2015, 51 (5): 705- 710. | |
| Song J, Hou M, Lu S H, et al Geometric morphological analysis of leaves based on landmarks. Journal of Lanzhou University (Natural Science Edition), 2015, 51 (5): 705- 710. | |
| 苏 蔚, 宋以刚 , 祁 敏, 等 2021. 基于几何形态分析的栎属白栎组叶片形态特征. 应用生态学报, 32(7): 2309−2315. | |
| Su W, Song Y G, Qi M, et al. 2021. Leaf morphological characteristics of section Quercus based on geometric morphological analysis. Chinese Journal of Applied Ecology, 32(7): 2309−2315. [in Chinese] | |
| 王凤格, 田红丽, 易红梅, 等 植物品种DNA指纹鉴定原理及其鉴定方案. 分子植物育种, 2018, 16 (14): 4756- 4766. | |
| Wang F G, Tian H L, Yi H M, et al Principle and strategy of DNA fingerprint identification of plant variety. Molecular Plant Breeding, 2018, 16 (14): 4756- 4766. | |
| 王晓艳. 2019. 基于高光谱的谷子叶片叶绿素含量预测及品种识别的方法研究. 太谷: 山西农业大学. | |
| Wang X Y. 2019. Methods of millet leaf chlorophyll content prediction and identification of varieties based on hyperspectral technique. Taigu: Shanxi Agricultural University. [in Chinese] | |
|
王娅丽, 李 毅, 陈晓阳 祁连山青海云杉天然群体表型性状遗传多样性分析. 林业科学, 2008, 44 (2): 70- 77.
doi: 10.3321/j.issn:1001-7488.2008.02.011 |
|
|
Wang Y L, Li Y, Chen X Y Phenotypic diversity of natural populations in Picea crassifolia in Qilian Mountains . Scientia Silvae Sinicae, 2008, 44 (2): 70- 77.
doi: 10.3321/j.issn:1001-7488.2008.02.011 |
|
| 魏仕伟, 陈海荣, 葛国军, 等 SSR和形态标记在叶用莴苣品种鉴定上的应用. 分子植物育种, 2020, 18 (13): 4350- 4360. | |
| Wei S W, Chen H R, Ge G J, et al Application of SSR and morphological markers for identification on lettuce varieties. Molecular Plant Breeding, 2020, 18 (13): 4350- 4360. | |
| 徐 红, 韩玉兰, 杨自湘, 等 用叶片特征区别不同产地不同单株青杨的研究. 林业科技通讯, 1995, (2): 17- 18, 43. | |
| Xu H, Han Y L, Yang Z X, et al A study on distinguishing different individual plants of Populus cathayana from different areas by leaf characteristics . Forest Science and Technology, 1995, (2): 17- 18, 43. | |
| 闫宝荣, 花保祯 几何形态测量学及其在昆虫分类学和系统发育中的应用. 昆虫分类学报, 2010, 32 (4): 313- 320. | |
| Yan B R, Hua B Z Geometric morphometrics and its application in the systematics and phylogenetics of insects. Entomotaxonomia, 2010, 32 (4): 313- 320. | |
|
殷云霞, 孟庆全, 徐先韬 基于分段面积比的植物叶片图像识别方法研究. 重庆科技学院学报(自然科学版), 2019, 21 (3): 89- 93.
doi: 10.19406/j.cnki.cqkjxyxbzkb.2019.03.022 |
|
|
Yin Y X, Meng Q Q, Xu X T Research on plant leaf recognition algorithm based on sectional area ratio. Journal of Chongqing University of Science and Technology (Natural Science Edition), 2019, 21 (3): 89- 93.
doi: 10.19406/j.cnki.cqkjxyxbzkb.2019.03.022 |
|
| 曾卫东. 2019. 基于形态、分子和生态数据的星果草属物种界定研究. 南昌: 江西农业大学. | |
| Zeng W D. 2019. Species delimitation of Asteropyrum Drumm. et Hutch. (Rannuculaceae) based on morphological, molecular and ecological variation. Nanchang: Jiangxi Agriculture University. [in Chinese] | |
| 张宇和, 柳 鎏, 梁维坚, 等. 2005. 中国果树志: 板栗榛子卷. 北京: 中国林业出版社. | |
| Zhang Y H. Liu L, Liang W J, et al. 2005. Chinese fruit trees: chestnut hazelnut. Beijing: China Forestry Publishing House. [in Chinese] | |
|
赵志珩, 张 荣, 和润喜, 等 板栗花芽分化进程及形态结构观察. 广西林业科学, 2021, 50 (2): 150- 156.
doi: 10.3969/j.issn.1006-1126.2021.02.006 |
|
|
Zhao Z H, Zhang R, He R X, et al Flower bud differentiation and morphological structure of Castanea mollissima . Guangxi Forestry Science, 2021, 50 (2): 150- 156.
doi: 10.3969/j.issn.1006-1126.2021.02.006 |
|
|
朱瑞清, 刘美玲, 李 刚, 等 2种水分生境下红砂叶片功能性状的响应及适应机制. 西北林学院学报, 2020, 35 (5): 29- 34.
doi: 10.3969/j.issn.1001-7461.2020.05.05 |
|
|
Zhu R Q, Liu M L, Li G, et al Responses of leaf functional traits of Reaumuria soongorica in two different desert habitats . Journal of Northwest Forestry University, 2020, 35 (5): 29- 34.
doi: 10.3969/j.issn.1001-7461.2020.05.05 |
|
|
Aasamaa K, Sõber A Stomatal sensitivities to changes in leaf water potential, air humidity, CO2 concentration and light intensity, and the effect of abscisic acid on the sensitivities in six temperate deciduous tree species . Environmental and Experimental Botany, 2011, 71 (1): 72- 78.
doi: 10.1016/j.envexpbot.2010.10.013 |
|
|
Baranov S G Use of Morpho J soft package for phenotypic and genotypic variety testing (English oak case study). Russian Journal of Genetics: Applied Research, 2018, 8 (1): 22- 30.
doi: 10.1134/S2079059718010021 |
|
| Binashikhbubkr K, Adam M A, Al-Misned F, et al Geometric morphometric discrimination between seven populations of Kawakawa Euthynnus affinis (Cantor, 1849) from Peninsular Malaysia . Journal of King Saud University—Science, 2022, 34 (3): 1- 8. | |
| Costa C, Paglia G, Salvador F R, et al Hazelnut cultivar identification with leaf morphometric analysis: preliminary results. Acta Horticulturae, 2009, (845): 245- 248. | |
|
Eric W Morphometrical methods as tools for identifying field maple (Acer campestre L.) trees . Feddes Repertorium, 2020, 131 (1): 72- 81.
doi: 10.1002/fedr.201900015 |
|
| Gailing O, Lind J, Lilleskov E Leaf morphological and genetic differentiation between Quercus rubra L. and Q. ellipsoidalis E. J. Hill populations in contrasting environments . Plant Systematics and Evolution, 2012, 298 (8): 1533- 1545. | |
|
Granier C, Vile D Phenotyping and beyond: modelling the relationships between traits. Current Opinion in Plant Biology, 2014, 18, 96- 102.
doi: 10.1016/j.pbi.2014.02.009 |
|
| Huang L J, Liu Y C Understanding diversity in leaf morphology of Chinese Sagittaria (Alismataceae) by geometric tools . Pakistan Journal of Botany, 2014, 46 (6): 1927- 1934. | |
|
Klingenberg C P Morpho J: an integrated software package for geometric morphometrics. Molecular Ecology Resources, 2011, 11 (2): 353- 357.
doi: 10.1111/j.1755-0998.2010.02924.x |
|
| Klingenberg C P Evolution and development of morphology: integrating quantitative approaches. Nature Reviews Genetics, 2010, 11 (7): 623- 635. | |
| Klingenberg C P, Barluenga M, Meyer A Shape analysis of symmetric structures: quantifying variation among individuals and asymmetry. Evolution, 2002, 56 (10): 1909- 1920. | |
|
Klingenberg C P, Monteiro L R Distances and directions in multidimensional shape spaces: implications for morphometric applications. Systematic Biology, 2005, 54 (4): 678- 688.
doi: 10.1080/10635150590947258 |
|
| Lang C, Costa F R C, Camargo G L C, et al Near infrared spectroscopy facilitates rapid identification of both young and mature Amazonian tree species. PLoS ONE, 2015, 10 (8): 1- 15. | |
| Liu Y, Li Y J, Song J L, et al Geometric morphometric analyses of leaf shapes in two sympatric Chinese oaks: Quercus dentata Thunberg and Quercus aliena Blume (Fagaceae) . Annals of Forest Science, 2018, 75 (4): 1- 12. | |
|
Mitteroecker P, Gunz P Advances in geometric morphometrics. Evolutionary Biology, 2009, 36 (2): 235- 247.
doi: 10.1007/s11692-009-9055-x |
|
| Murat A A, Michaël T, Pierre R, et al Landmark based geometric morphometric analysis of wing morphology in Sibiricobombus Vogt (Hymenoptera: Apidae: Bombus Latreille) . Annales de la Société Entomologique de France (N. S. ), 2007, 43 (1): 95- 102. | |
|
Viscosi V, Lepais O, Gerber S, et al Leaf morphological analyses in four European oak species (Quercus) and their hybrids: acomparison of traditional and geometric morphometric methods . Plant Biosystems—An International Journal Dealing with all Aspects of Plant Biology, 2009, 143 (3): 564- 574.
doi: 10.1080/11263500902723129 |
|
|
Viscosi V Geometric morphometrics and leaf phenotypic plasticity: assessing fluctuating asymmetry and allometry in European white oaks (Quercus) . Botanical Journal of the Linnean Society, 2015, 179 (2): 335- 348.
doi: 10.1111/boj.12323 |
|
|
Yann V, Caroline C. B, Antoine K, et al Quantifying phenological plasticity to temperature in two temperate tree species. Functional Ecology, 2010, 24 (6): 1163- 1369.
doi: 10.1111/j.1365-2435.2010.01747.x |
| [1] | 马雅莉,郭素娟,廖逸宁,王芳芳. 板栗不同冠层球苞负载量对光合特性及果实品质的影响[J]. 林业科学, 2022, 58(9): 90-97. |
| [2] | 李爱博,周本智,李春友,羊美娟,汤丽萍,王利仙. 树种配置和叶元素含量的空气负离子浓度效应[J]. 林业科学, 2022, 58(5): 65-74. |
| [3] | 温文杰,王冬梅. 青海黄土高寒区4种典型人工林树木叶片碳氮磷含量及化学计量特征[J]. 林业科学, 2022, 58(1): 22-31. |
| [4] | 曹德美,张亚红,成星奇,项晓冬,张磊,胡建军. 青杨不同种群叶片表型性状的遗传变异[J]. 林业科学, 2021, 57(8): 56-67. |
| [5] | 陈海波,郭丽,张真,孔祥波,张苏芳,刘福. 杨树人工林种间混交对生长性状和食叶害虫抗性的影响[J]. 林业科学, 2021, 57(8): 133-140. |
| [6] | 彭金根,姜雪茹,谢利娟,刘燕. 小叶黄杨越冬叶片呈色及其温光影响因子[J]. 林业科学, 2021, 57(2): 49-61. |
| [7] | 徐瑞晶,胡璇,刘广路,郭雯,梁昌强,孔祥河. 海南岛热带低地雨林2种攀缘竹的叶片功能性状差异[J]. 林业科学, 2021, 57(12): 155-166. |
| [8] | 张亦弛,郭素娟. 2种生长延缓剂对板栗枝条生长和叶片碳氮代谢物积累的影响[J]. 林业科学, 2020, 56(5): 29-36. |
| [9] | 杨佳骏,吴永波,张燕红. 高温与干旱胁迫对‘南林895杨’扦插苗生长和超微结构的影响[J]. 林业科学, 2020, 56(5): 176-183. |
| [10] | 韩彪,李文清,郭素娟,陆璐,解孝满. 基于差示扫描量热技术的板栗胚轴低温保存技术及临界含水量[J]. 林业科学, 2020, 56(3): 21-27. |
| [11] | 沈阔程,陈倩文,齐梅,彭子嘉,樊军锋,余仲东. 杨树叶片结构与抗锈菌侵染的相关性[J]. 林业科学, 2020, 56(12): 75-82. |
| [12] | 郭雯, 雷刚, 漆良华, 王一, 徐瑞晶, 张建. 海南岛簕竹属5个竹种雨季光合特性与叶片形态结构性状[J]. 林业科学, 2019, 55(8): 63-72. |
| [13] | 尹淑艳, 李波, 周成刚, 张卫光, 谢丽霞, 刘永杰. 基于28S rDNA分析板栗和杉木上针叶小爪螨物种分化原因[J]. 林业科学, 2019, 55(4): 122-128. |
| [14] | 毛运芝, 冯璐璐, 冉慧, 刘世尧. 缙云山5种乡土楠木资源叶片精油挥发性成分GC-MS鉴定与组成差异分析[J]. 林业科学, 2019, 55(2): 182-196. |
| [15] | 冉慧, 冯璐璐, 毛运芝, 周利, 刘世尧. 重庆4种野生樟科植物叶片精油GC-MS鉴定及挥发性成分分析[J]. 林业科学, 2018, 54(7): 91-103. |
| 阅读次数 | ||||||
|
全文 |
|
|||||
|
摘要 |
|
|||||