
Scientia Silvae Sinicae ›› 2023, Vol. 59 ›› Issue (12): 51-60.doi: 10.11707/j.1001-7488.LYKX20220683
• Research papers • Previous Articles Next Articles
Zanqing Zeng1,2,3,Hanqing Song1,Junhong Gao2,Miaomiao Wang2,3,Yaoxing Wu1,Lianghua Qi1,*
Received:2022-10-11
Accepted:2023-10-24
Online:2023-12-25
Published:2024-01-08
Contact:
Lianghua Qi
CLC Number:
Zanqing Zeng,Hanqing Song,Junhong Gao,Miaomiao Wang,Yaoxing Wu,Lianghua Qi. Spatial and Temporal Change and Potential Prediction of Carbon Sequestrating and Energy Carbon Emissing of Forest Vegetation in Beijing[J]. Scientia Silvae Sinicae, 2023, 59(12): 51-60.
Table 1
Energy carbon emission factor"
| 能源名称 Energy name | 平均低位发热量 Mean low calorific value/( kJ·kg?1) | 折标准煤系数 Discount standard coal coefficient/ ( kg·kg?1) | 单位热值含碳量 Carbon content per unit calorific value/ (t ·TJ?1) | 碳氧化率 Carbon oxidation rate(%) | 碳排放系数 Carbon emission coefficient |
| 原煤Coal | 20 908 | 0.714 3 | 26.37 | 0.94 | 0.755 9 |
| 焦炭Coke | 28 435 | 0.971 4 | 29.5 | 0.93 | 0.855 6 |
| 原油Crude oil | 41 816 | 1.428 6 | 20.1 | 0.98 | 0.586 0 |
| 燃料油Fuel oil | 41 816 | 1.428 6 | 21.1 | 0.98 | 0.618 2 |
| 汽油 Gas | 43 070 | 1.471 4 | 18.9 | 0.98 | 0.553 8 |
| 煤油Kerosene | 43 070 | 1.471 4 | 19.5 | 0.98 | 0.574 3 |
| 柴油Diesel | 42 652 | 1.457 1 | 20.2 | 0.98 | 0.591 8 |
| 液化石油 Liquefied petroleum gas | 50 179 | 1.714 3 | 17.2 | 0.98 | 0.504 1 |
| 天然气Natural gas | 38 931 | 1.330 0 | 15.3 | 0.99 | 0.448 0 |
Table 2
Carbon fixation and carbon fixation capacity of vegetation in Beijing in different periods"
| 年份 Year | 森林植被类型 Vegetation type | 面积 Area/hm2 | 每10年面积 增长率Area growth rate per 10 years (%) | 固碳(CO2)量 CO2 sequestration/ (104 t·a?1) | 每10年固碳量 增长率Rate of carbon sequestration per 10 years (%) | 单位面积 固碳(CO2)量CO2 sequestration per unit area/(104 t·hm?2a?1) |
| 2000 | Ⅰ | 69 800 | 12.58 | 11.12 | 23.69 | 1.59 |
| Ⅱ | 4 600 | 14.65 | 0.85 | ?30.32 | 1.84 | |
| Ⅲ | 159 600 | ?13.2 | 69.37 | 7.66 | 4.34 | |
| Ⅳ | 255 700 | 13.44 | 102.43 | 6.53 | 4.01 | |
| 小计Total | 489 700 | 13.38 | 183.77 | 7.59 | 3.75 | |
| 2010 | Ⅰ | 102 600 | 46.99 | 18.20 | 63.66 | 1.77 |
| Ⅱ | 4 400 | ?4.34 | 0.91 | 7.05 | 2.06 | |
| Ⅲ | 106 600 | ?33.20 | 51.60 | ?25.61 | 4.84 | |
| Ⅳ | 317 900 | 24.32 | 141.80 | 38.43 | 4.46 | |
| 小计Total | 531 500 | 8.53 | 212.51 | 15.64 | 3.99 | |
| 2020 | Ⅰ | 119 800 | 16.76 | 20.33 | 11.70 | 1.69 |
| Ⅱ | 6 300 | 43.18 | 1.24 | 36.26 | 1.96 | |
| Ⅲ | 213 300 | 100.09 | 98.73 | 91.33 | 4.62 | |
| Ⅳ | 369 500 | 16.23 | 157.62 | 11.15 | 4.26 | |
| 小计Total | 708 900 | 45.76 | 277.92 | 33.37 | 3.92 |
Table 3
Carbon fixation and contribution rate of carbon fixation of forest vegetation in each administrative region of Beijing"
| 行政区 District | 森林植被CO2固定量 CO2 fixed amount of forest vegetation/(t·a?1) | 森林植被碳固定量贡献率 Contribution rate of carbon fixation of forest vegetation (%) | |||||
| 2000 | 2010 | 2020 | 2000 | 2010 | 2020 | ||
| 西城 Xicheng | 757.11 | 842.02 | 1542.92 | 0.04 | 0.04 | 0.06 | |
| 东城 Dongcheng | 968.86 | 1 077.51 | 1974.45 | 0.05 | 0.05 | 0.07 | |
| 朝阳 Chaoyang | 18 356.46 | 21 325.07 | 36 349.49 | 1.00 | 1.00 | 1.31 | |
| 丰台 Fengtai | 15 917.72 | 18 555.32 | 30 169.20 | 0.87 | 0.87 | 1.09 | |
| 石景山 Shijingshan | 5 314.53 | 5 873.53 | 8 530.38 | 0.29 | 0.28 | 0.31 | |
| 海淀 Haidian | 31 911.27 | 35 128.25 | 54 863.08 | 1.74 | 1.65 | 1.97 | |
| 门头沟 Mentougou | 238 643.44 | 262 839.09 | 241 706.29 | 12.99 | 12.37 | 8.70 | |
| 房山 Fangshan | 235 070.38 | 271 136.14 | 249 123.06 | 12.79 | 12.76 | 8.96 | |
| 通州 Tongzhou | 33 581.00 | 58 206.23 | 98 234.88 | 1.83 | 2.74 | 3.53 | |
| 顺义 Shunyi | 49 491.21 | 77 581.27 | 112 023.63 | 2.69 | 3.65 | 4.03 | |
| 昌平Changping | 148 687.03 | 174 830.28 | 227 192.07 | 8.09 | 8.23 | 8.17 | |
| 大兴Daxing | 49 477.30 | 60 239.72 | 109 264.10 | 2.69 | 2.83 | 3.93 | |
| 怀柔Huairou | 321 357.29 | 356 674.73 | 439 317.10 | 17.49 | 16.78 | 15.81 | |
| 平谷Pinggu | 123 493.32 | 137 131.01 | 228 200.06 | 6.72 | 6.45 | 8.21 | |
| 密云Miyun | 291 964.92 | 329 738.29 | 518 283.16 | 15.89 | 15.52 | 18.65 | |
| 延庆Yanqing | 272 708.20 | 313 900.67 | 422 426.13 | 14.84 | 14.77 | 15.20 | |
Table 4
Energy carbon emissions in Beijing from 2000 to 2020 104t·a?1"
| 年份 Year | 煤炭Coal | 原油 Crude oil | 汽油 Gas | 焦炭 Coke | 煤油 Kerosene | 柴油 Diesel | 燃料油 Fuel oil | 液化石油气 Liquefied Petroleum gas | 天然气 Natural gas | 总计 Total |
| 2000 | 3 690.74 | 3 255.81 | 458.38 | 404.17 | 522.14 | 362.01 | 405.79 | 0 | 43.65 | 9 142.72 |
| 2010 | 3 575.17 | 4 815.66 | 1 597.57 | 198.40 | 1 743.27 | 1 058.89 | 301.95 | 0 | 299.51 | 13 590.45 |
| 2020 | 233.14 | 3 961.67 | 2 112.10 | 0 | 3 088.22 | 715.55 | 2.12 | 257.47 | 751.12 | 11 121.39 |
Table 5
Energy carbon emissions of Beijing administrative regions 104 t·a?1"
| 行政区 District | 年份Year | ||
| 2000 | 2010 | 2020 | |
| 西城 Xicheng | 830.73 | 861.36 | 567.19 |
| 东城 Dongcheng | 594.24 | 636.84 | 355.88 |
| 朝阳 Chaoyang | 1 542.88 | 2 456.56 | 1 757.18 |
| 丰台 Fengtai | 922.36 | 1 463.54 | 1 023.17 |
| 石景山 Shijingshan | 329.46 | 426.87 | 289.16 |
| 海淀 Haidian | 1 509.19 | 2 273.62 | 1 590.36 |
| 门头沟 Mentougou | 179.89 | 200.96 | 200.19 |
| 房山 Fangshan | 548.43 | 654.85 | 667.28 |
| 通州 Tongzhou | 454.10 | 820.47 | 934.20 |
| 顺义 Shunyi | 429.18 | 607.73 | 667.28 |
| 昌平Changping | 414.35 | 1 151.02 | 1 156.62 |
| 大兴Daxing | 452.76 | 945.90 | 1 012.05 |
| 怀柔Huairou | 199.43 | 258.48 | 222.43 |
| 平谷Pinggu | 267.48 | 288.27 | 233.55 |
| 密云Miyun | 282.97 | 323.62 | 266.91 |
| 延庆Yanqing | 185.28 | 219.67 | 177.94 |
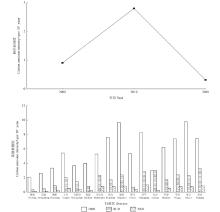
Fig.1
Carbon emission intensity in Beijing"
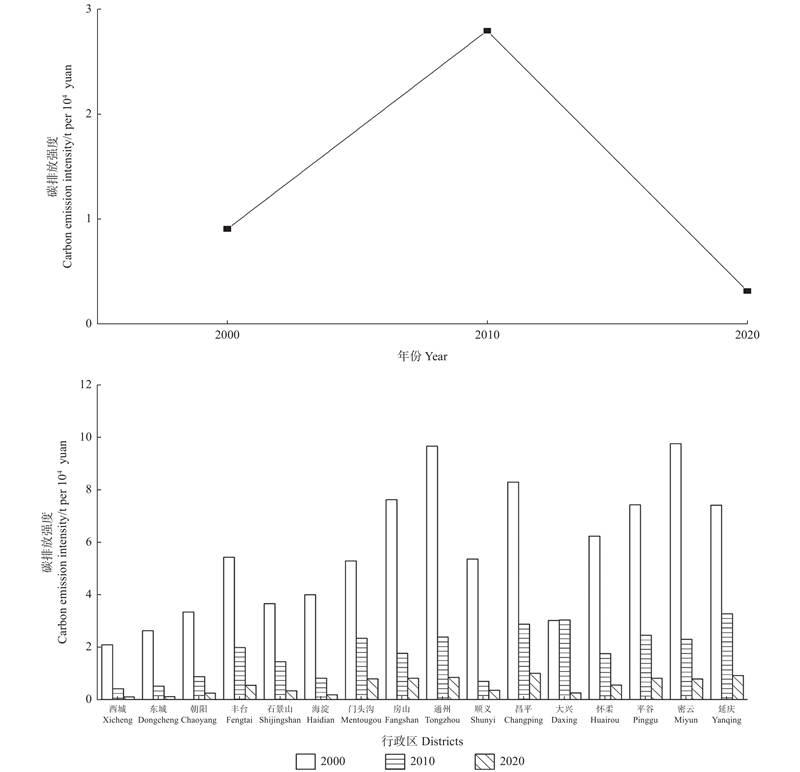
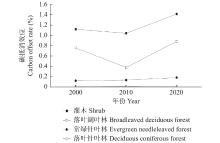
Fig.2
Carbon offset effect of different forest types"

Fig.3
Carbon offset and classification of forest vegetation from 2000 to 2020"
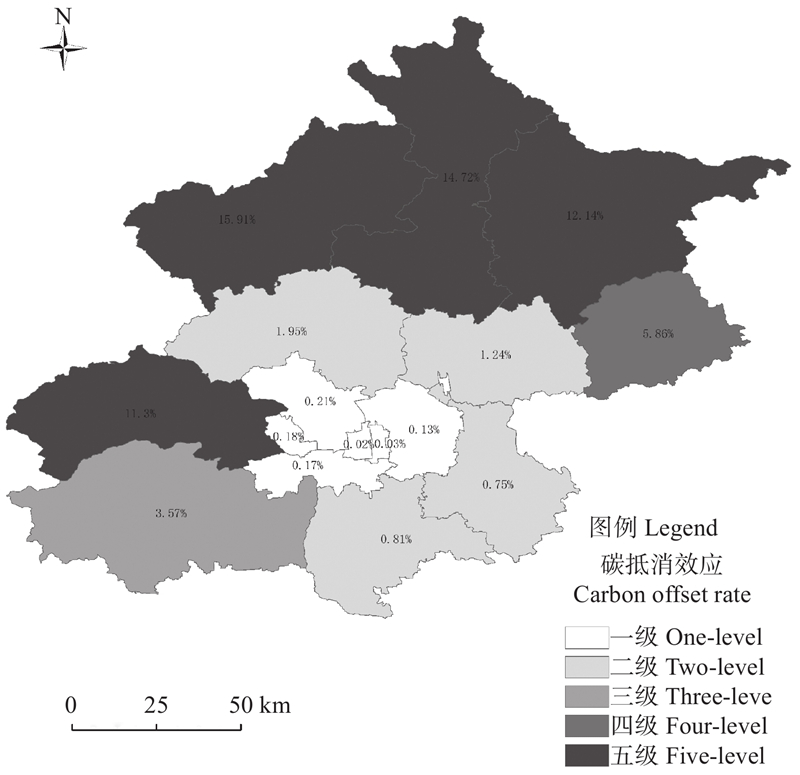
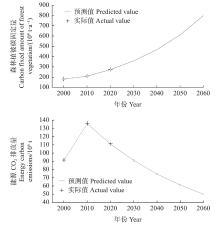
Fig.4
Actual and predicted values of carbon fixation by forest vegetation and energy carbon emissions in Beijing"
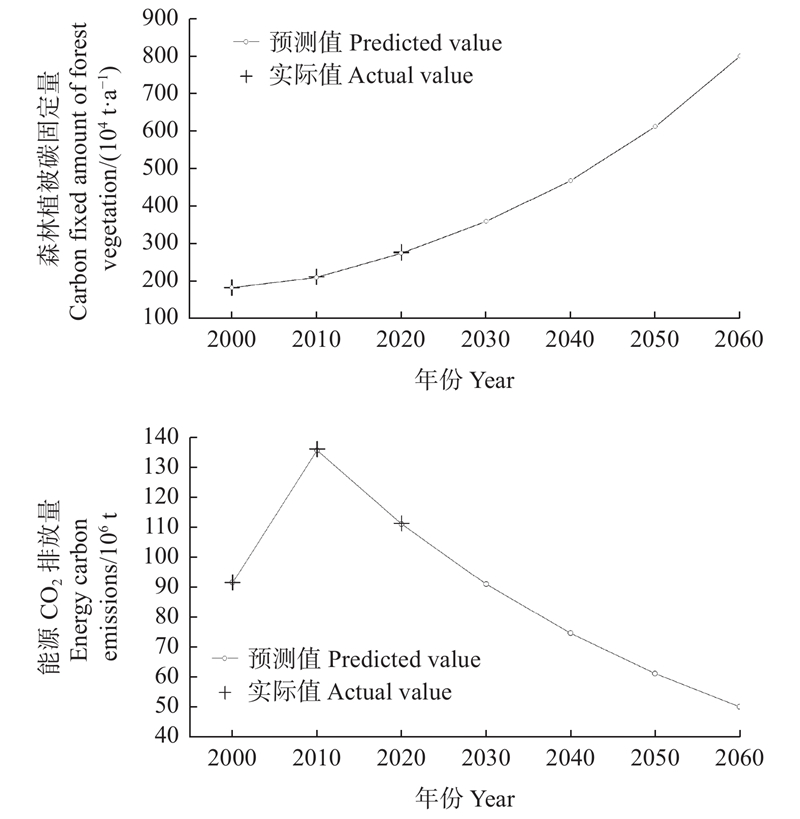
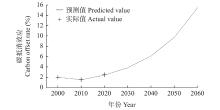
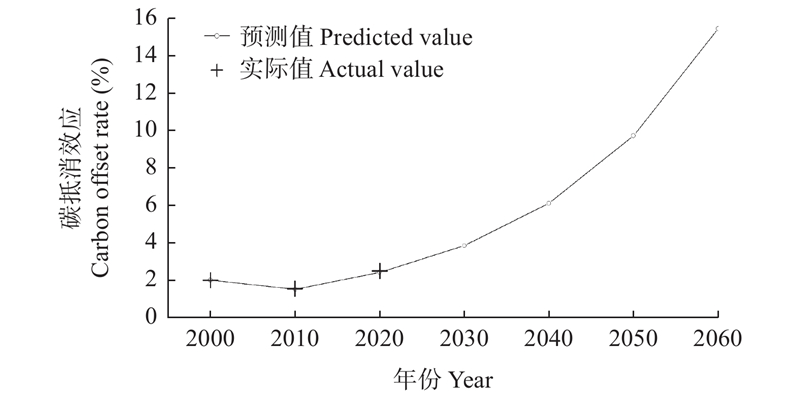
Fig.5
Actual and predicted value of energy carbon effect in Beijing"
| 邓聚龙. 2002 . 灰色预测与灰决策.1版. 武汉: 华中科技大学出版社. | |
| Deng J L. 2002. Grey prediction and grey decision.1th edition. Wuhan: Huazhong University of Science and Technology Press. [in Chinese] | |
| 李帅帅, 孙贞昌. 2019. 西部地区森林碳汇碳抵消效果及发展潜力评价研究. 林业经济, 41(2): 74−78. | |
| Li S S, Sun Z C. 2019. Study on the evaluation on forest carbon sink offsetting effect and development potential in western China. Forestry Economics, 41(2): 74−78. [in Chinese] | |
| 刘魏魏, 王效科, 逯 非, 等. 全球森林生态系统碳储量、固碳能力估算及其区域特征. 应用生态学报, 2015, 26 (9): 2881- 2890. | |
| Liu W W, Wang X K, Lu F, et al. Regional and global estimates of carbon stocks and carbon sequestration capacity in forest ecosystems: a review. Chinese Journal of Applied Ecology, 2015, 26 (9): 2881- 2890. | |
| 苏泳娴, 陈修治, 叶玉瑶, 等. 基于夜间灯光数据的中国能源消费碳排放特征及机理. 地理学报, 2013, 68 (11): 1513- 1526. | |
| Su Y X, Chen X Z, Ye Y Y, et al. The characteristics and mechanisms of carbon emissions from energy consumption in China using DMSP/OLS night light imageries. Acta Geographica Sinica, 2013, 68 (11): 1513- 1526. | |
| 王亚飞, 邱尔发, 韩玉丽, 等. 2017. 基于EKC曲线的北京市绿地生态服务价值研究. 南京林业大学学报(自然科学版), 41(2): 181−186. | |
| Wang Y F, Qiu E F, Han Y L, et al. 2017. Analysis of environmental Kuznets curve-based ecosystem services of urban green space: a case study of Beijing City. Journal of Nanjing Forestry University(Natural Science Edition), 41(2): 181−186. [in Chinese] | |
| 温宥越, 孙 强, 燕玉超, 等. 粤港澳大湾区陆地生态系统演变对固碳释氧服务的影响. 生态学报, 2020, 40 (23): 8482- 8493. | |
| Wen Y Y, Sun Q, Yan Y C, et al. Impacts of the terrestrial ecosystem changes on the carbon fixation and oxygen release services in the Guangdong-HongKong-Macao Greater Bay Area. Acta Ecologica Sinica, 2020, 40 (23): 8482- 8493. | |
| 吴 婕, 李 楠, 陈 智, 等. 深圳特区城市植被的固碳释氧效应. 中山大学学报(自然科学版), 2010, 49 (4): 86- 92. | |
| Wu J, Li N, Chen Z, et al. The effect of CO2 sequestration and O2 release of urban vegetation in shenzhen special zone. Journal of Sun Yat-sen University(Natural Science Edition), 2010, 49 (4): 86- 92. | |
| 谢军飞, 李玉娥, 李延明, 等. 北京城市园林树木碳贮量与固碳量研究. 中国生态农业学报, 2007, 15 (3): 5- 7. | |
| Xie J F, Li Y E, Li Y M, et al. Calculation of carbon storage and sequestration in the urban trees of Beijing. Chinese Journal of Eco-Agriculture, 2007, 15 (3): 5- 7. | |
| 熊向艳, 韩永伟, 高馨婷, 等. 北京市城乡结合部17种常用绿化植物固碳释氧功能研究. 环境工程技术学报, 2014, 4 (3): 248- 255. | |
| Xiong X Y, Han Y W, Gao X T, et al. Analysis of carbon fixation and oxygen release capabilities of 17 afforestation plants in rural-urban fringe in Beijing. Journal of Environmental Engineering Technology, 2014, 4 (3): 248- 255. | |
| 薛海丽, 唐海萍, 李延明, 等. 北京常见绿化植物生态调节服务研究. 北京师范大学学报(自然科学版), 2018, 54 (4): 517- 524. | |
| Xue H L, Tang H P, Li Y M, et al. Regulation service of main greening tree species in Beijing. Journal of Beijing Normal University (Natural Science), 2018, 54 (4): 517- 524. | |
| 杨 超, 鲁绍伟, 陈 波, 等. 北京地区常见果树的光合速率和固碳释氧效应. 经济林研究, 2016, 34 (1): 57- 64. | |
| Yang C, Lu S W, Chen B, et al. Photosynthetic rate and effects of carbon fixation and oxygen release of common fruit trees in Beijing City. Nonwood Forest Research, 2016, 34 (1): 57- 64. | |
| 张 彪, 谢紫霞, 高吉喜. 上海城市森林植被固碳功能及其抵消能源碳排放效果评估. 生态学报, 2021, 41 (22): 8906- 8920. | |
| Zhang B, Xie Z X, Gao J X. Assessment on the carbon fixation of urban forests and their efficacy on offsetting energy carbon emissions in Shanghai. Acta Ecologica Sinica, 2021, 41 (22): 8906- 8920. | |
| 张 峰, 彭祚登. 北京市森林碳储量和碳汇经济价值研究. 林业资源管理, 2021, (6): 52- 58. | |
| Zhang F, Peng Z D. Biomass carbon stocks and carbon stock economic value of forests in Beijing. Forest Resources Management, 2021, (6): 52- 58. | |
| 张 娇, 施拥军, 朱月清, 等. 2013. 浙北地区常见绿化树种光合固碳特征. 生态学报, 33(12): 3878−3887. | |
| Zhang J, Shi Y J, Zhu Y Q, et al. 2013. The photosynthetic carbon fixation characteristics of common tree species in northern Zhejiang. Acta Ecologica Sinica, 33(12): 3878−3887. [in Chinese] | |
| 张青云, 吕伟娅, 徐炳乾, 等. 华北地区城市绿地固碳能力测算研究. 环境保护科学, 2021, 47 (1): 41- 48. | |
| Zhang Q Y, Lü W Y, Xu B Q, et al. Study on the calculation of carbon sequestration capacity of urban green space in North China. Environmental Protection Science, 2021, 47 (1): 41- 48. | |
|
张艳丽, 费世民, 李智勇, 等. 成都市沙河主要绿化树种固碳释氧和降温增湿效益. 生态学报, 2013, 33 (12): 3878- 3887.
doi: 10.5846/stxb201205080672 |
|
|
Zhang Y L, Fei S M, Li Z Y, et al. Carbon sequestration and oxygen release as well as cooling and humidification efficiency of the main greening tree species of Sha River, Chengdu. Acta Ecologica Sinica, 2013, 33 (12): 3878- 3887.
doi: 10.5846/stxb201205080672 |
|
| 赵传燕, 沈卫华, 彭焕华. 祁连山区青海云杉林冠层叶面积指数的反演方法. 植物生态学报, 2009, 33 (5): 860- 869. | |
| Zhao C Y, Shen W H, Peng H H. Methods for determining ganopy leaf area index of Picea carssifolia forest in qilian mountains, China. Chinese Journal of Plant Ecology, 2009, 33 (5): 860- 869. | |
|
周 健, 肖荣波, 庄长伟, 等. 城市森林碳汇及其抵消能源碳排放效果: 以广州为例. 生态学报, 2013, 33 (18): 5865- 5873.
doi: 10.5846/stxb201305030913 |
|
|
Zhou J, Xiao R B, Zhuang C W, et al. The carbon sink of urban forests and efficacy on offsetting energy carbon emissions from city in Guangzhou. Acta Ecologica Sinica, 2013, 33 (18): 5865- 5873.
doi: 10.5846/stxb201305030913 |
|
| 朱万泽. 成熟森林固碳研究进展. 林业科学, 2020, 56 (3): 117- 126. | |
| Zhu W Z. Advances in the carbon sequestration of mature forests. Scientia Silvae Sinicae, 2020, 56 (3): 117- 126. | |
|
Adrian F, Peter S, John A. Relating foliage and crown projective cover in Australian tree stands. Agricultural and Forest Meteorology, 2018, 259, 39- 57.
doi: 10.1016/j.agrformet.2018.04.016 |
|
|
Armston J D, Scarth P F, Phinn S R, et al. Analysis of multi-date MISR measurements for forest and woodland communties, Queensland, Australia. Remote Sensing of Environment, 2007, 107, 287- 298.
doi: 10.1016/j.rse.2006.11.003 |
|
| Change I P O. 2006. IPCC guidelines for national greenhouse gas inventories. Tokyo: Institute for Global Environmental Strategies, Hayama, Kanagawa, Japan. | |
|
Fang J Y, Yu G R, Liu L L, et al. Climate change, human impacts, and carbon sequestration in China. PNAS, 2018, 115, 4015- 4020.
doi: 10.1073/pnas.1700304115 |
|
|
Fu D, Bu B, Wu J, et al. Investigation on the carbon sequestration capacity of vegetation along a heavy traffic load expressway. Journal of Environmental Management, 2019, 241, 549- 557.
doi: 10.1016/j.jenvman.2018.09.098 |
|
|
Hayes D J, Turner D P, Stinson G. Reconciling estimates of the contemporary North American carbon balance among terrestrial biosphere models, atmospheric inversions, and a new approach for estimating net ecosystem exchange from inventory-based data. Global Change Biology, 2012, 18 (4): 1282- 1299.
doi: 10.1111/j.1365-2486.2011.02627.x |
|
|
Keenan R J, Reams G A, Achard F, et al. Dynamics of global forest area: results from the FAO global forest resources assessment. Forest Ecology and Management, 2015, 352, 9- 20.
doi: 10.1016/j.foreco.2015.06.014 |
|
| Liski J, Perruchoud D, Karjalainen T. Increasing carbon stocks in the forest soils of western Europe. Forest Ecology and Management, 2012, 169, 159- 175. | |
|
Lü Q, Liu H, Wang J, et al. Multiscale analysis on spatiotemporal dynamics of energy consumption CO2 emissions in China: utilizing the integrated of DMSP-OLS and NPP-VIIRS nighttime light datasets. Science of The Total Environment, 2020, 703, 134394.
doi: 10.1016/j.scitotenv.2019.134394 |
|
| US Environmental Protection Agency. 2014. Washington DC: Inventory of US Greenhouse Gas Emissions and Sinks: 1990−2012. | |
|
Xu L, Du H, Zhang X. Driving forces of carbon dioxide emissions in China’s cities: n empirical analysis based on the geodetector method. Journal of Cleaner Production, 2021, 287, 125169.
doi: 10.1016/j.jclepro.2020.125169 |
| Viewed | ||||||
|
Full text |
|
|||||
|
Abstract |
|
|||||