
Scientia Silvae Sinicae ›› 2022, Vol. 58 ›› Issue (10): 35-46.doi: 10.11707/j.1001-7488.20221004
• Special Issue: Forest Fire Prevention Relevant Resource Monitoring, Analysis and Management Techniques in Zhangjiakou Competition Area of the Beijing Olympic Winter Games • Previous Articles Next Articles
Xingjing Chen1,2,Linyan Feng2,3,Yuchao Zhang4,Qingwang Liu2,5,Zhaohui Yang1,Liyong Fu2,3,Jinhua Bai1,*
Received:2021-11-16
Online:2022-10-25
Published:2023-04-23
Contact:
Jinhua Bai
CLC Number:
Xingjing Chen,Linyan Feng,Yuchao Zhang,Qingwang Liu,Zhaohui Yang,Liyong Fu,Jinhua Bai. Inversion of Aboveground Biomass in the Core Area of Chongli Winter Olympics Based on Airborne LiDAR[J]. Scientia Silvae Sinicae, 2022, 58(10): 35-46.
Table 1
Allometric growth equation used to calculate aboveground biomass(AGB) for different species"
| 树种 Species | 异速生长方程 Allometric growth equation | 来源 Source |
| 华北落叶松 Larix principis-rupprechtii | AGB=0.027 7×DBH2.793 26 | |
| 白桦 Betula platyphylla | AGB=0.1905×DBH2.243 22 |

Fig.1
LiDAR point cloud normalization"
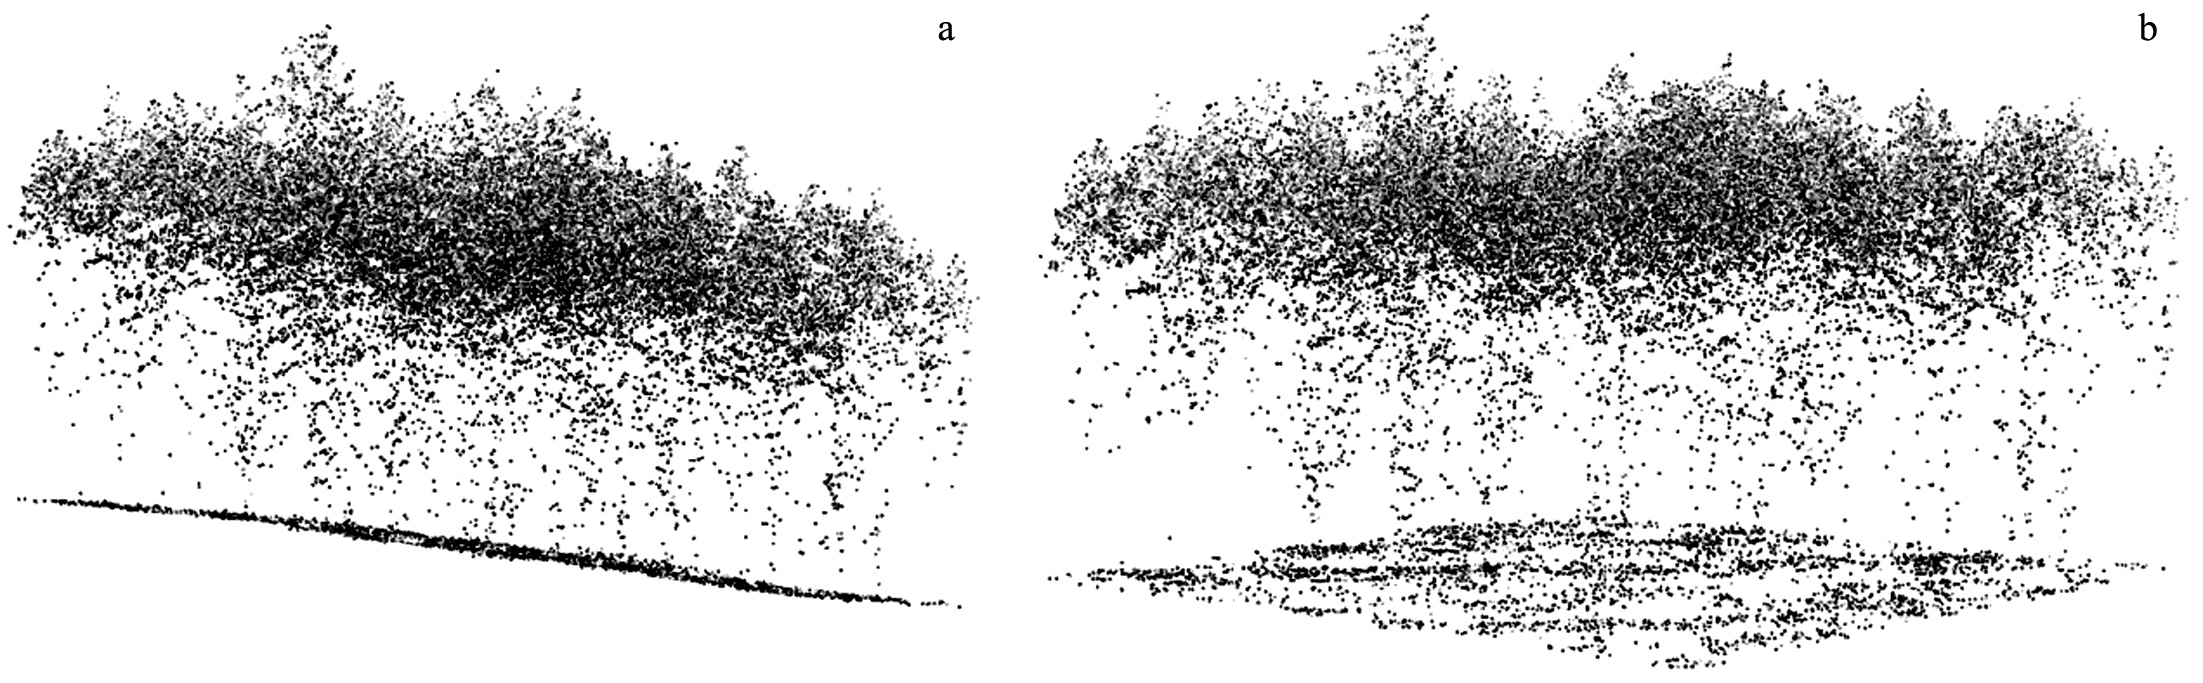
Table 附表
Airborne LiDAR variable meter"
| 变量 Variable | 名称 Name | 原理 Principle |
| x1 | 高度平均绝对偏差 Average absolute deviation of height | |
| x2 | 冠层高度起伏率 Canopy height fluctuation rate | |
| x3-x17 | 累计高度百分位数(AIH) Cumulative height percentile(AIH) | 某一统计单元内,将其内部所有归一化的激光雷达点云按高度进行排序并计算所有点的累积高度,每一统计单元内x%的点所在的累积高度,即为该统计单元的累积高度百分位数。 In a statistical unit, all normalized LiDAR point clouds within it are sorted by height and the cumulative height of all points is calculated. The cumulative height of x% points in each statistical unit is the percentile of the cumulative height of the statistical unit. |
| x18 | 累积高度百分位数四分位数间距 Cumulative height percentile quartile spacing | V=AIH75%-AIH25% |
| x19 | 高度三次幂平均值 Average height of cubic power | |
| x20 | 变异系数 Coefficient of variation | |
| x21 | 高度百分位数四分位数间距 Height percentile quartile spacing | V=Elcv75%-Elcv25% |
| x22 | 高度峰度 Height kurtosis | |
| x23 | 高度中位数绝对偏差的中位数 Median of absolute deviation of height median | 高度中位数绝对偏差的中位数 The median of absolute deviation of height median |
| x24 | 高度最大值 Maximum height | 某一统计单元内,所有点的Z值的最大值 In a statistical unit, the maximum Z value of all points |
| x25 | 高度最小值 Minimum height | 某一统计单元内,所有点的Z值的最小值 Minimum Z value for all points in a statistical unit |
| x26 | 高度平均值 Average height | 某一统计单元内,所有点的Z值的平均值 In a statistical unit, the average Z value of all points |
| x27 | 高度中位数 Height median | 某一统计单元内,所有点的Z值的中位数 In a statistical unit, the median of Z value of all points |
| x28-x42 | 高度百分位数(Elcv) Height percentile (Elcv) | 某一统计单元内,将其内部所有归一化的激光雷达点云按高度进行排序,然后计算每一统计单元内x%的点所在的高度,即为该统计单元的高度百分位数 In a statistical unit, all normalized LiDAR point clouds inside it are sorted by height, and then the height of x% points in each statistical unit is calculated, which is the height percentile of the statistical unit |
| x43 | 高度偏斜度(偏态) Height skewness (skewness) | 某一统计单元内,所有点的Z值分布的对称性, The symmetry of Z-value distribution of all points in a statistical unit, |
| x44 | 高度二次幂平均值 Average value of height quadratic power | |
| x45 | 高度标准差 Height standard deviation | 某一统计单元内,所有点的Z值的标准差 The standard deviation of Z value of all points in a statistical unit |
| x46 | 高度方差 Height variance | 某一统计单元内,所有点的Z值的方差 In a statistical unit, the variance of Z value of all points |
| x47-x56 | 密度变量 Density variable | 将点云数据从低到高分成十个相同高度的切片,每层回波数的比例就是相应的密度变量 The point cloud data is divided into ten slices of the same height from low to high, and the ratio of echo number per layer is the corresponding density variable |
| x57 | 强度平均绝对偏差 Average absolute deviation of intension | |
| x58 | 强度变异系数 Tension variance | |
| x59-x73 | 累计强度百分位数 Cumulative intension percentiles | 某一统计单元内,将其内部所有归一化的激光雷达点云按强度进行排序并计算所有点的累积强度,每一统计单元内x%的点的累积强度,即为该统计单元的累积强度百分位数 All normalized LiDAR point clouds within a statistical unit are sorted by intension and the cumulative intension of all points is calculated. The cumulative intension of x% points in each statistical unit is the percentile of the cumulative intension of the statistical unit |
| x74 | 强度峰度 Peak intension | |
| x75 | 强度中位数绝对偏差的中位数 Median of absolute deviation of median intension | 强度中位数绝对偏差的中位数 Median of absolute deviation of median intension |
| x76 | 强度最大值 Intension maximums | 某一统计单元内,所有点的强度值的最大值 In a statistical unit, the maximum intension value of all points |
| x77 | 强度平均值 Average intension | 某一统计单元内,所有点的强度值的平均值 Average intension of all points in a statistical unit |
| x78 | 强度中位数 Intension median | 某一统计单元内,所有点的强度值的中位数 Median intensit of all points in a statistical unit |
| x79 | 强度最小值 Minimum intension | 某一统计单元内,所有点的强度值的最小值 Minimum intension of all points in a statistical unit |
| x80 | 强度偏斜度 Intension skewness | 某一统计单元内,所有点的强度值分布的对称性, Symmetry of intension distribution of all points in a statistical unit, |
| x81 | 强度方差 Variance of intension | 某一统计单元内,所有点的强度值的方差 Variance of intension values of all points in a statistical unit |
| x82 | 强度标准差 Standard deviation of intension | 某一统计单元内,所有点的强度值的标准差 Standard deviation of intension values of all points in a statistical unit |
| x83-x97 | 强度百分位数 Intension percentiles | 某一统计单元内,将其内部所有归一化的激光雷达点云按强度进行排序,然后计算每一统计单元内x%的点的强度,即为该统计单元的强度百分位数 In a statistical unit, all normalized laser radar point clouds inside it are sorted by intension, and then the intension of x% points in each statistical unit is calculated as the intension percentile of the statistical unit |
| x98 | 强度百分位数四分位数间距 Intension percentile quartile spacing | V=Int75%-Int25% |
Table 2
Stand variables for modeling plots"
| 树种 Species | 样地数 Number of plots | 平均胸径DBH/cm | 平均树高Mean tree height/m | 生物量Biomass/(t·hm-2) | |||||
| 最小值Min. | 最大值Max. | 最小值Min. | 最大值Max. | 最小值Min. | 最大值Max. | ||||
| 华北落叶松Larix principis-rupprechtii | 40 | 2 | 41.4 | 7.2 | 16.8 | 4.91 | 197.62 | ||
| 白桦Betula platyphylla | 22 | 2.3 | 41.2 | 6.4 | 14.3 | 26.32 | 165.15 | ||
Table 3
Basic model form for forest biomass"
| 序号 No. | 模型 Model | 模型来源 Model source |
| Ⅰ | AGB=b0+b1X1+b2X2+b3X3+…+bnXn+εAGB | Linear |
| Ⅱ | AGB=b0/[1+b1exp(-b2X1-b3X2-b4X3-…-bn+1Xn)]+εAGB | Logistic |
| Ⅲ | AGB=b0exp(-b1X1-b2X2-b3X3-…-bnXn)+εAGB | Exponential |
| Ⅳ | AGB=b0X1b1X2b2X3b3…Xnbn+εAGB | Empirical |
Table 4
The 20 LiDAR variables with the greatest correlation with biomass"
| 变量 Variable | 相关系数 Correlation coefficient | 变量 Variable | 相关系数 Correlation coefficient | 变量 Variable | 相关系数 Correlation coefficient | 变量 Variable | 相关系数 Correlation coefficient | |||
| x12 | 0.889 52 | x16 | 0.883 15 | x26 | 0.877 50 | x50 | -0.696 09 | |||
| x13 | 0.888 53 | x19 | 0.882 68 | x17 | 0.875 29 | x47 | -0.706 26 | |||
| x14 | 0.887 56 | x44 | 0.880 84 | x42 | 0.873 65 | x49 | -0.761 40 | |||
| x15 | 0.886 27 | x10 | 0.879 22 | x9 | 0.871 94 | x48 | -0.800 81 | |||
| x11 | 0.885 50 | x27 | 0.879 18 | x24 | 0.871 90 | x43 | -0.819 34 |
Table 5
Linear and nonlinear model parameter estimation results"
| 模型 Model | 参数 Parameter | 解释变量 Explainable variable | 参数估计值 Parameter estimate | P |
| Ⅰ | b1 | x46 | 8.82 | 1.84E-07 |
| b2 | x47 | -298.89 | 1.84E-07 | |
| b3 | x56 | 300.42 | 0.040 4 | |
| Ⅱ | b0 | 152.27 | 8.30E-11 | |
| b1 | 3.35 | 0.005 948 | ||
| b2 | x46 | 0.32 | 0.000 253 | |
| b3 | x47 | -11.87 | 0.000 472 | |
| b4 | x56 | 10.70 | 0.112 488 | |
| Ⅲ | b0 | 14.80 | 0.06 | |
| b1 | x46 | 0.71 | 1.07E-06 | |
| b2 | x47 | -0.23 | 1.72E-05 | |
| b3 | x56 | 0.05 | 0.456 8 | |
| Ⅳ | b0 | 59.98 | 6.51E-11 | |
| b1 | x46 | -0.11 | 3.31E-07 | |
| b2 | x47 | 6.52 | 2.93E-06 | |
| b3 | x56 | -1.13 | 0.467 0 |
Table 6
Evaluation indicators for ordinary least squares and Bayesian models"
| 模型Model | 最小二乘Ordinary least squares | 贝叶斯Bayesian | |||||
| 均方根误差 RMSE/(t·hm-2) | 确定系数 R2 | 总体相对误差 TRE(%) | 均方根误差 RMSE/(t·hm-2) | 确定系数 R2 | 总体相对误差 TRE(%) | ||
| LinearⅠ | 22.49 | 0.780 | 5.69 | 33.19 | 0.545 | 13.55 | |
| LogisticⅡ | 21.66 | 0.798 | 5.26 | 24.29 | 0.732 | 7.31 | |
| EmpiricalⅢ | 21.74 | 0.796 | 5.30 | 21.58 | 0.796 | 5.32 | |
| Exponential Ⅳ | 24.41 | 0.743 | 6.78 | 25.21 | 0.743 | 6.82 | |
Table 7
Evaluation indicators for mixed effect model"
| 模型Model | 训练集Training set | 验证集Verification sets | |||||
| 均方根误差 RMSE/(t·hm-2) | 确定系数 R2 | 总体相对误差 TRE(%) | 均方根误差 RMSE/(t·hm-2) | 确定系数 R2 | 总体相对误差 TRE(%) | ||
| LinearⅠ | 19.28 | 0.840 | 4.13 | 23.46 | 0.759 | 6.32 | |
| LogisticⅡ | 18.64 | 0.850 | 3.86 | 22.99 | 0.768 | 6.08 | |
| EmpiricalⅢ | 21.73 | 0.796 | 5.89 | 23.52 | 0.757 | 6.30 | |
| Exponential Ⅳ | 21.97 | 0.792 | 5.45 | 27.93 | 0.658 | 8.94 | |
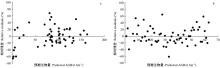
Fig.2
Residual distribution of mixed effect model"
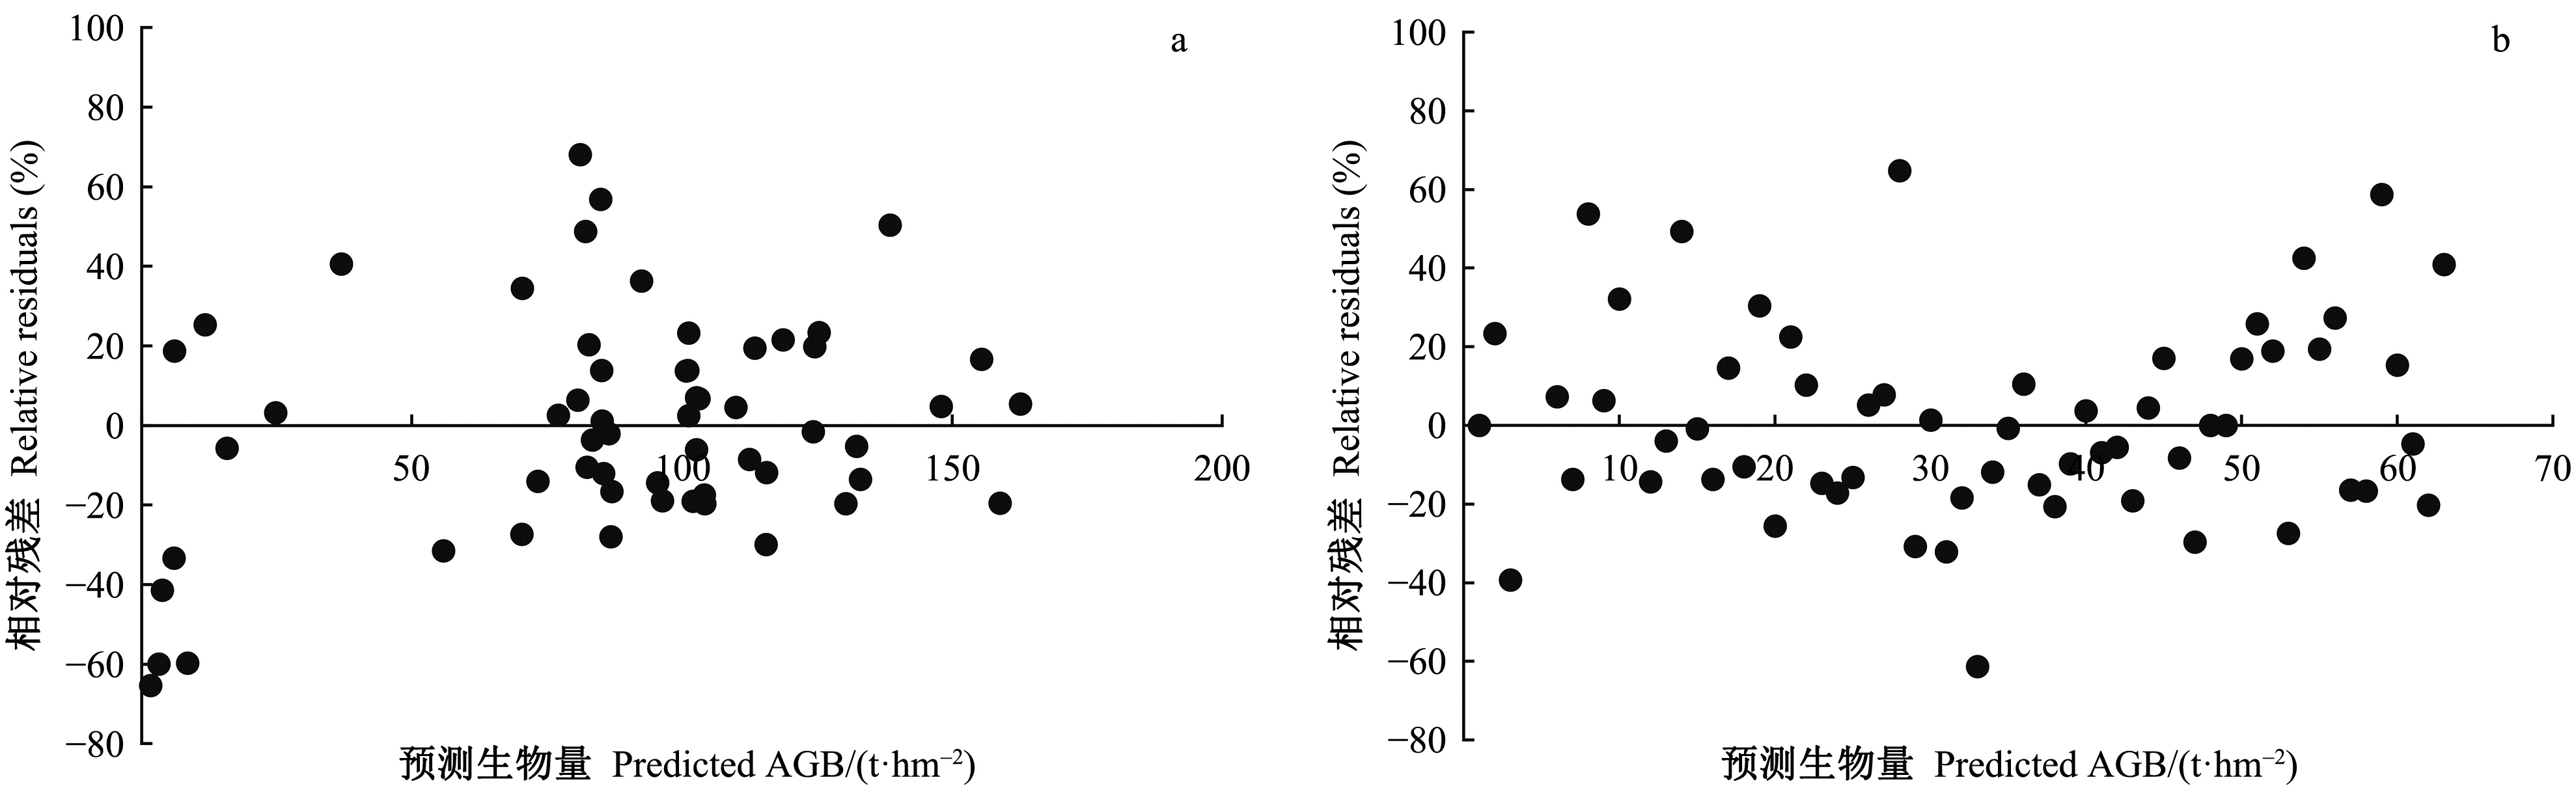

Fig.3
Biomass of the Winter Olympics core area in Chongli, China"
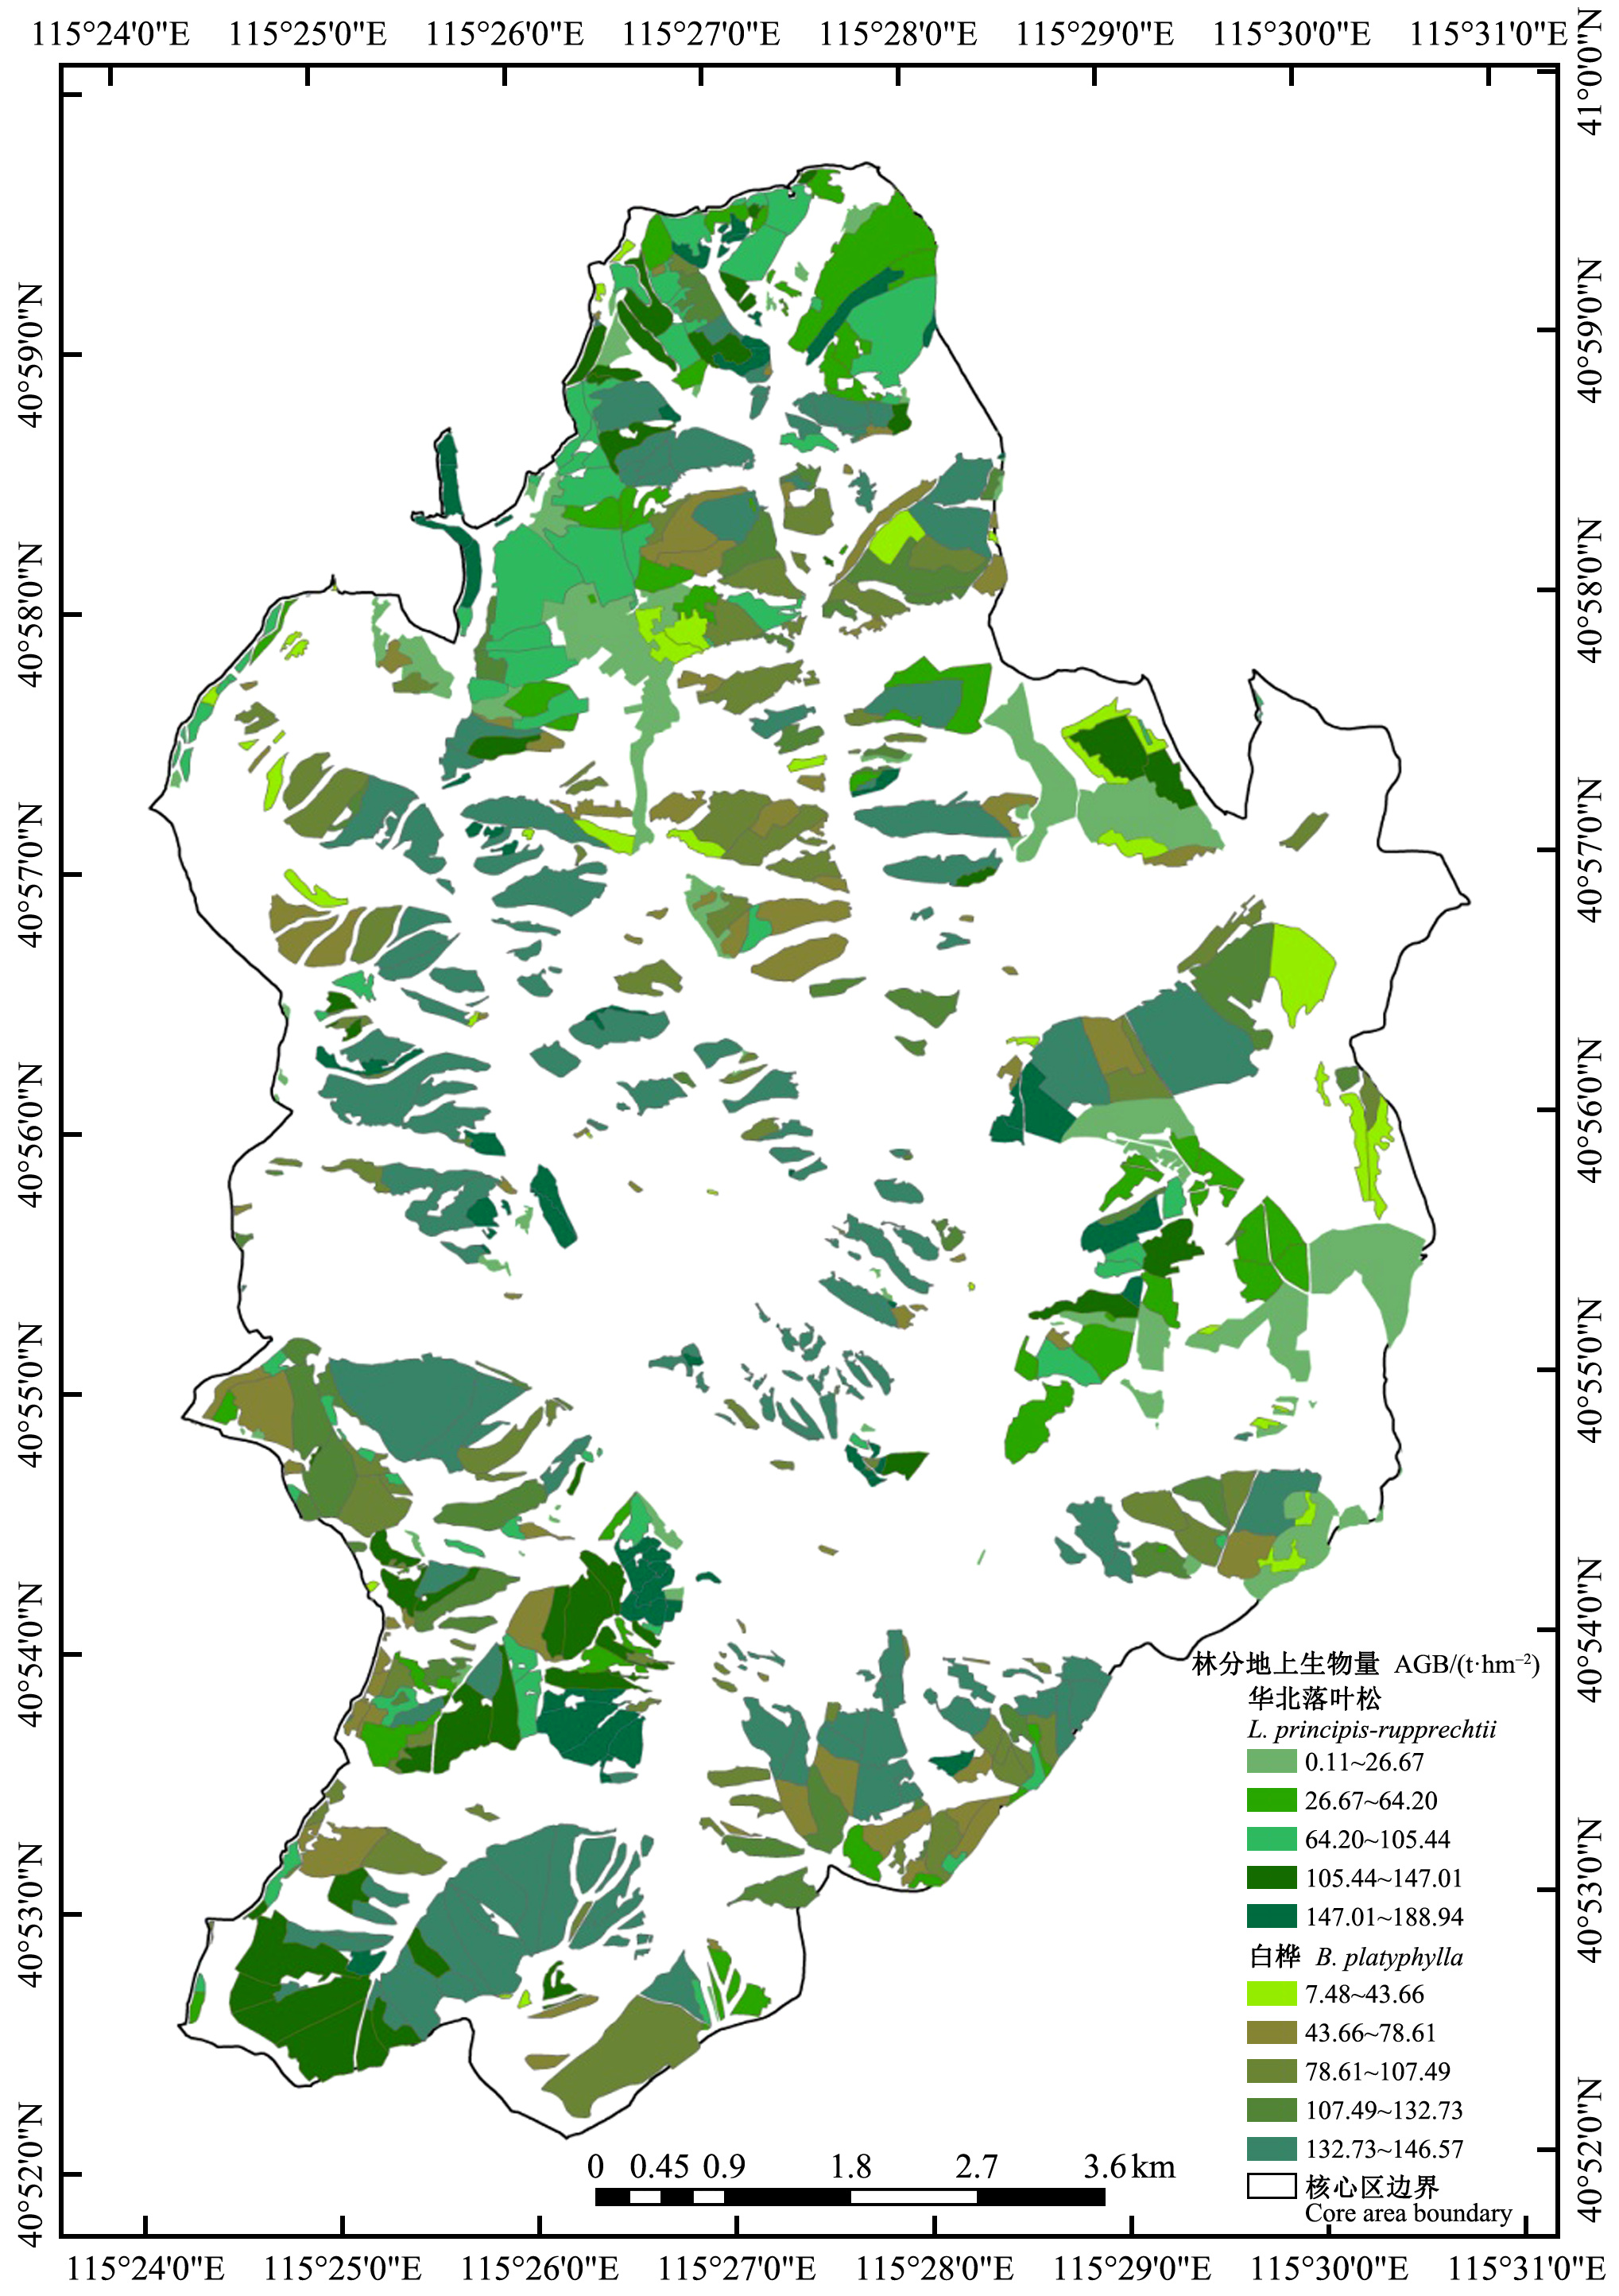
Table 8
Fitting results of the NLME biomass Model Ⅱ for Larix principis-rupprechtii and Betula platyphylla"
| 树种 Species | 训练集Training set | 验证集Verification sets | |||||
| 均方根误差 RMSE/(t·hm-2) | 确定系数 R2 | 总体相对误差 TRE(%) | 均方根误差 RMSE/(t·hm-2) | 确定系数 R2 | 总体相对误差 TRE(%) | ||
| 华北落叶松Larix principis-rupprechtii | 15.81 | 0.910 | 3.48 | 22.92 | 0.795 | 7.45 | |
| 白桦Betula platyphylla | 20.26 | 0.597 | 3.15 | 23.34 | 0.440 | 4.35 | |
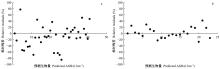
Fig.4
The relative residual maps of Larix principis-rupprechtii and Betula spp. based on model Ⅱ a: The relative residual map of Larix principis-rupprechtii based on model Ⅱ; b: the relative residual map of Betula platyphylla based on model Ⅱ."

|
符利勇, 唐守正, 张会儒, 等. 基于多水平非线性混合效应蒙古栎林单木断面积模型. 林业科学研究, 2015, 28 (1): 23- 31.
doi: 10.13275/j.cnki.lykxyj.2015.01.004 |
|
|
Fu L Y , Tang S Z , Zhang H R , et al. Multilevel nonlinear mixed-effects basal area models for individual trees of Quercus mongolica. Forest Research, 2015, 28 (1): 23- 31.
doi: 10.13275/j.cnki.lykxyj.2015.01.004 |
|
| 符利勇, 张会儒, 唐守正. 基于非线性混合模型的杉木优势木平均高. 林业科学, 2012, 48 (7): 66- 71. | |
| Fu L Y , Zhang H R , Tang S Z . Dominant height for chinese fir plantation using nonlinear mixed effects model based on linearization algorithm. Scientia Silvae Sinicae, 2012, 48 (7): 66- 71. | |
| 国家林业局. 中国森林资源报告2009—2013. 北京: 中国林业出版社, 2014. | |
| State Forestry Administration . Report on China's forest resources: 2009—2013. Beijing: China Forestry Publishing House, 2014. | |
| 国家林业局. 立木生物量模型及碳计量参数: 落叶松(LY/T 2654—2016). 北京: 中国标准出版社, 2017a. | |
| State Forestry Administration . Tree biomass models and related parameters to carbon accounting for Larix gmelinii(LY/T 2654—2016). Beijing: China Standards Publishing House, 2017a. | |
| 国家林业局. 立木生物量模型及碳计量参数: 桦树(LY/T 2659—2016). 北京: 中国标准出版社, 2017b. | |
| State Forestry Administration . Tree biomass models and related parameters to carbon accounting for Betula platyphylla(LY/T 2659—2016). Beijing: China Standards Publishing House, 2017b. | |
|
何潇, 雷渊才, 薛春泉, 等. 广东省木荷碳密度及其不确定性估计. 林业科学, 2019, 55 (11): 163- 171.
doi: 10.11707/j.1001-7488.20191118 |
|
|
He X , Lei Y C , Xue C Q , et al. Carbon density uncertainty estimates for Schima superba in Guangdong Province. Scientia Silvae Sinicae, 2019, 55 (11): 163- 171.
doi: 10.11707/j.1001-7488.20191118 |
|
|
李春明, 张会儒. 利用非线性混合模型模拟杉木林优势木平均高. 林业科学, 2010, 46 (3): 89- 95.
doi: 10.3969/j.issn.1672-8246.2010.03.020 |
|
|
Li C M , Zhang H R . Modeling dominant height for chinese fir plantation using a nonlinear mixed-effects modeling approach. Scientia Silvae Sinicae, 2010, 46 (3): 89- 95.
doi: 10.3969/j.issn.1672-8246.2010.03.020 |
|
| 李桂林, 王红, 宋音. 基于无人机机载激光雷达估算黄河三角洲孤岛刺槐林地上生物量. 中国农学通报, 2018, 34 (26): 52- 57. | |
| Li G L , Wang H , Song Y . Estimating aboveground biomass of Robinia pseudoacacia in the Yellow River Delta based on UAV airborne laser radar. Chinese Agricultural Science Bulletin, 2018, 34 (26): 52- 57. | |
| 理查德·麦克尔里思. 统计反思: 用R和Stan例解贝叶斯方法. 北京: 机械工业出版社, 2019. | |
| Richard M . Statistical rethinking of R and Stan examples for Solving Bayesian methods. Beijing: China Machine Press, 2019. | |
|
刘清旺, 谭炳香, 胡凯龙, 等. 机载激光雷达和高光谱组合系统的亚热带森林估测遥感试验. 高技术通讯, 2016, (3): 264- 274.
doi: 10.3772/j.issn.1002-0470.2016.03.006 |
|
|
Liu Q W , Tan B X , Hu K L , et al. The remote sensing experiment on airborne LiDAR and hyperspectral integrated system for subtropical forest estimation. Chinese High Technology Letters, 2016, (3): 264- 274.
doi: 10.3772/j.issn.1002-0470.2016.03.006 |
|
| 庞勇, 李增元. 基于机载激光雷达的小兴安岭温带森林组分生物量反演. 植物生态学报, 2012, 36 (10): 1095- 1105. | |
| Pang Y , Li Z Y . Inversion of biomass components of the temperate forest using airborne LiDAR technology in Xiaoxing'an Mountains, northeastern of China. Chinese Journal of Plant Ecology, 2012, 36 (10): 1095- 1105. | |
| 曲苑婷, 汪垚, 刘观潮, 等. 基于GLAS激光雷达反演森林生物量. 测绘通报, 2014, (11): 73- 77. | |
| Qu Y T , Wang Y , Liu G C , et al. The inversion of forest biomass based on GLAS laser radar. Bulletin of Surveying and Mapping, 2014, (11): 73- 77. | |
| 曾伟生, 孙乡楠, 王六如, 等. 基于机载激光雷达数据的森林蓄积量模型研建. 林业科学, 2021, 57 (2): 31- 38. | |
| Zeng W S , Sun X N , Wang L R , et al. Development of forest stand volume models based on airborne laser scanning data. Scientia Silvae Sinicae, 2021, 57 (2): 31- 38. | |
|
曾伟生, 唐守正. 立木生物量模型的优度评价和精度分析. 林业科学, 2011, 47 (11): 106- 113.
doi: 10.11707/j.1001-7488.20111117 |
|
|
Zeng W S , Tang S Z . Goodness evaluation and precision analysis of tree biomass equations. Scientia Silvae Sinicae, 2011, 47 (11): 106- 113.
doi: 10.11707/j.1001-7488.20111117 |
|
| 唐守正, 张会儒, 胥辉. 相容性生物量模型的建立及其估计方法研究. 林业科学, 2000, 36 (S1): 19- 27. | |
| Tang S Z , Zhang H R , Xu H . Study on establish and estimate method of compatible biomass model. Scientia Silvae Sinicae, 2000, 36 (S1): 19- 27. | |
| 尤号田, 邢艳秋, 王萌, 等. 小光斑激光雷达数据估测森林生物量研究进展. 森林工程, 2014, 30 (3): 39- 42. | |
| You H T , Xing Y Q , Wang M , et al. Research progress in estimation of forest biomass from small spot LiDAR data. Forest Engineering, 2014, 30 (3): 39- 42. | |
| 于颖, 范文义, 李明泽, 等. 利用大光斑激光雷达数据估测树高和生物量. 林业科学, 2010, 46 (9): 84- 87. | |
| Yu Y , Fan W Y , Li M Z , et al. Estimation of forest tree heights and biomass from GLAS data. Scientia Silvae Sinicae, 2010, 46 (9): 84- 87. | |
| Andersen H E , Reutebuch S E , McGaughey R J . A rigorous assessment of tree height measurements obtained using airborne liDAR and conventional field methods. Canadian Journal of Remote Sensing, 2006, 32 (5): 355- 366. | |
| Bouvier M , Durrieu S , Fournier R A , et al. Generalizing predictive models of forest inventory attributes using an area-based approach with airborne LiDAR data. Remote Sensing of Environment, 2015, 156, 322- 334. | |
| Dubayah R O , Drake J B . Lidar remote sensing for forestry. Journal of Forestry, 2000, 98 (6): 44- 46. | |
| Ellison A M . Bayesian inference in ecology. Ecology Letters, 2004, 7 (6): 209- 520. | |
| Ferraz A , Saatchi S , Mallet C , et al. Airborne LiDAR estimation of aboveground forest biomass in the absence of field inventory. Remote Sensing, 2016, 8 (8): 653. | |
| Field C B , Raupach M R , Victoria R . The global carbon cycle: integrating humans, climate and the natural world. Global Carbon Cycle Integrating Humans Climate & the Natural World, 2004, 6, 2389- 2390. | |
| Fu L Y , Liu Q W , Sun H , et al. Developing a system of compatible individual tree diameter and aboveground biomass prediction models using error-in-variable regression and airborne LiDAR data. Remote Sensing, 2018, 10 (2): 325. | |
| González-Ferreiro E , Diéguez-Aranda U , Miranda D . Estimation of stand variables in Pinus radiata D. Don plantations using different LiDAR pulse densities. Forestry: an International Journal of Forest Research, 2012, 85 (2): 281- 292. | |
| He Q , Chen E , An R , et al. Above-ground biomass and biomass components estimation using LiDAR data in a coniferous forest. Forests, 2013, 4 (4): 984- 1002. | |
| Jachowski N , Quak M , Friess D A , et al. Mangrove biomass estimation in southwest Thailand using machine learning. Applied Geography, 2013, 45, 311- 321. | |
| Lim K S , Treitz P M . Estimation of aboveground forest biomass from airborne discrete return laser scanner data using canopy-based quantile estimators. Scandinavian Journal of Forest Research, 2004, 19, 558- 570. | |
| MacLean G A , Krabill W B . Gross merchantable timber volume estimation using an airbome LiDAR system. Canadian Journal of Remote Sensing, 1986, 12, 7- 18. | |
| Maltamo M , Eerikainen K , Pitkanen J , et al. Estimation of timber volume and stem density based on scanning laser altimetry and expected tree size distribution functions. Remote Sensing of Environment, 2004, 90, 319- 330. | |
| Næsset E . Determination of mean tree height of forest stands using airborne laser scanner data. ISPRS Journal of Photogrammetry and Remote Sensing, 1997, 52, 49- 56. | |
| Nelson R , Krabill W , MacLean G . Determining forest canopy characteristics using airbome laser data. Remote Sensing of Environment, 1984, 15, 201- 212. | |
| Nelson R , Krabill W , Tonelli J . Estimating forest biomass and voILune using airborne laser data. Remote Sensing of Environment, 1988, 24, 247- 267. | |
| Nelson R , Oderwald R , Gregoire T G . Separating the ground and airborne laser sampling phases to estimate tropical forest basal area, volume, and biomass. Remote Sensing of Environment, 1997, 60, 311- 326. | |
| Parresol B R . Assessing tree and stand biomass: a review with examples and critical comparisons. Forest Science, 1999, 45 (4): 573- 593. | |
| Pinheiro J C , Bates D M . Mixed-effects models in S and S-plus. New York: Spring Verlag, 2000. | |
| Popescu S C . Estimating biomass of individual pine trees using airborne LiDAR. Biomass and Bioenergy, 2007, 31, 646- 655. | |
| Tian X , Su Z B , Chen E X , et al. Estimation of forest above-ground biomass using multiparameter remote sensing data over a cold and arid area. International Journal of Applied Earth Observation and Geoinformation, 2012, 14 (1): 160- 168. | |
| Xiao W , Xu S , Elberink S O , et al. Individual tree crown modeling and change detection from airborne lidar data. IEEE journal of selected topics in applied earth observations and remote sensing, 2016, 9 (8): 3467- 3477. | |
| Ye Q L , Huang P , Zhang Z , et al. Multiview learning with robust double-side twin SVM. IEEE Transactions on Cybernetics, 2021, | |
| Zhang X Q , Cao Q V , Duan A G , et al. Modeling tree mortality in relation to climate, initial planting density and competition in Chinese fir plantations using a Bayesian logistic multilevel method. Canadian Journal of Forest Research, 2017, 47 (9): 1278- 1285. | |
| Zhao K G , Popescu S , Nelson R . LiDAR remote sensing of forest biomass: a scale-invariant estimation approach using airborne Lasers. Remote Sensing of Environment, 2009, 113, 182- 196. |
| Viewed | ||||||
|
Full text |
|
|||||
|
Abstract |
|
|||||