
林业科学 ›› 2020, Vol. 56 ›› Issue (4): 1-11.doi: 10.11707/j.1001-7488.20200401
张晓玮1,2,王婧如2,王明浩2,杨毅2,赵长明2
收稿日期:2018-05-07
出版日期:2020-04-25
发布日期:2020-05-26
基金资助:Xiaowei Zhang1,2,Jingru Wang2,Minghao Wang2,Yi Yang2,Changming Zhao2
Received:2018-05-07
Online:2020-04-25
Published:2020-05-26
摘要:
目的: 以我国各地理阶梯间山地生长的云杉属12个树种为对象,探讨限制云杉地理分布和驱动各树种沿经纬度分布差异的关键气候因子,以阐明影响我国云杉属各树种地理分布格局形成的主导气候因子。方法: 在长期野外考察积累和查阅中国数字植物标本馆标本信息的基础上,于云杉属12个树种的地理分布范围内选取389个样点,并利用地理信息系统技术(ArcGIS)获取各样点的主要气候数据。通过方差分析、变异系数比较确定限制云杉树种地理分布范围的气候因子,基于线性回归分析、蒙特卡洛检验和冗余分析(RDA)等方法量化各气候因子对云杉树种地理分布差异的贡献大小。结果: 年均气温、月均昼夜气温差、最暖月最高气温、最冷月最低气温、年均气温变幅、年均降水量、最暖季降水量、最冷季降水量和干旱指数在12个树种分布区间存在显著差异;月均昼夜气温差和最冷季降水量的方差主要来源于树种内,其余7个气候因子的方差主要来源于树种间;变异系数分析表明,无论是云杉属整体分布区还是各树种分布区的月均昼夜气温差和最暖月最高气温变异最低,其变异系数均小于20%;经、纬度与各气候因子的线性回归分析表明,除经、纬度与月均昼夜气温差、经度与最冷季降水量不存在显著相关(P>0.05)外,经、纬度与其余各气候因子均显著相关(P < 0.05),其中,与年均气温变幅相关性最高,其次为最冷月最低气温;蒙特卡洛检验进一步表明,年均气温变幅和最冷月最低气温对我国云杉属各树种沿经纬度分布差异的解释率分别达到84%和66.8%;RDA分析显示,第1主分轴主要反映热量条件,其中重要的气候因子分别为年均气温变幅、最暖月最高气温和最冷月最低气温,其载荷值分别为0.93、-0.83和0.64,第2主分轴主要反映以年均降水量、干旱指数和最暖季降水量为主的水分情况解释的信息量,且前2主分轴对树种和树种-环境关系的累积解释率分别高达89.2%和100%。结论: 限制我国云杉属树种地理分布的主要气候因子为月均昼夜气温差和最暖月最高气温,而导致各树种沿经纬度分布存在明显地理差异的主要驱动因子为年均气温变幅和最冷月最低气温。本研究进一步证实热量是影响云杉属植物等寒温性植物地理分布格局形成的主要原因和差异来源,降水量在一定程度上只起到次要作用。
中图分类号:
张晓玮,王婧如,王明浩,杨毅,赵长明. 中国云杉属树种地理分布格局的主导气候因子[J]. 林业科学, 2020, 56(4): 1-11.
Xiaowei Zhang,Jingru Wang,Minghao Wang,Yi Yang,Changming Zhao. Dominant Climatic Factors Influencing the Geographical Distribution Pattern of Picea in China[J]. Scientia Silvae Sinicae, 2020, 56(4): 1-11.
表1
所选云杉属各树种的分布地区、经纬度范围及样点数"
| 树种Tree species | 分布地区Distribution region | 经度 Latitude (E)/(°) | 纬度 Longitude (N)/(°) | 样点数 Sample number |
| 鱼鳞云杉Picea jezoensis | 黑龙江Heilongjiang、吉林Jilin、内蒙古Inner Mongolia | 123.7-134.0 | 41.2-48.2 | 20 |
| 红皮云杉P. koraiensis | 黑龙江Heilongjiang、吉林Jilin、辽宁Liaoning | 126.5-130.5 | 41.4-47.0 | 20 |
| 白杄P. meyeri | 山西Shanxi、河北Hebei、内蒙古中部Central Inner Mongolia | 111.1-110.3 | 37.3-44.0 | 23 |
| 青杄P. wilsonii | 内蒙古中部Central Inner Mongolia、河北Hebei、山西Shanxi、陕西南部Southern Shaanxi、湖北西部Western Hubei、甘肃中南部South central Gansu | 101.6-116.8 | 33.7-40. 8 | 53 |
| 青海云杉P. crassifolia | 青海东北部Northeast Qinghai、甘肃Gansu、宁夏Ningxia、内蒙古中部Central Inner Mongolia | 100.9-104.3 | 33.6-37.8 | 34 |
| 云杉P. asperata | 陕西西南部Southwest Shaanxi、甘肃东部和南部Eastern and Southern Gansu、四川Sichuan | 101.1-104.4 | 30.3-37.8 | 33 |
| 丽江云杉 P. likiangensis var. likiangensis | 云南西北部Northwest Yunnan、四川西南部Southwest Sichuan、西藏东南部Southeast Tibet | 98.8-101.9 | 26.8-30.0 | 53 |
| 川西云杉 P. likiangensis var. rubescens | 四川南部Southern Sichuan、青海南部Southern Qinghai、西藏东部Eastern Tibet | 94.4-103.0 | 28.3-32.9 | 33 |
| 林芝云杉 P. likiangensis var. linzhiensis | 西藏东南部Southeast Tibet、云南西北部Northwest Yunnan、四川西南部Southwest Sichuan | 92.9-100.6 | 27.8-30.3 | 29 |
| 紫果云杉P. purpurea | 四川北部Northern Sichuan、甘肃南部Southern Gansu、青海Qinghai | 101.1-104.1 | 30.1-35.8 | 47 |
| 须弥云杉P. spinulosa | 西藏南部Southern Tibet | 88.5-92.0 | 27.2-30.3 | 17 |
| 长叶云杉P. smithiana | 西藏南部Southern Tibet | 81.8-86.0 | 28.0-30.0 | 27 |
表2
云杉属主要树种地理分布区的气候因子描述性统计结果"
| 气候因子Climatic factors | 平均值 Mean | SD | 95%置信区间 95% confidence interval | 最小值 Minimum | 最大值 Maximum | CV (%) | |
| 下限 Lowerbound | 上限 Upperbound | ||||||
| 年均气温Annual mean temperature/℃ | 5.92 | 2.92 | 5.63 | 6.21 | -1.40 | 13.30 | 49.35 |
| 月均昼夜气温差Monthly mean temperature difference between day and night/℃ | 13.00 | 1.45 | 12.86 | 13.15 | 8.30 | 16.40 | 11.15 |
| 最暖月最高气温Maximal temperature of the warmest month/℃ | 21.38 | 3.72 | 21.01 | 21.76 | 15.00 | 32.10 | 17.39 |
| 最冷月最低气温Minimal temperature of the coldest month/℃ | -13.36 | 6.07 | -13.96 | -12.75 | -32.20 | -0.20 | 45.43 |
| 年均气温变幅Temperature annual range/℃ | 34.74 | 7.93 | 33.95 | 35.53 | 22.30 | 56.70 | 22.82 |
| 年均降水量Annual precipitation/mm | 691.70 | 187.10 | 673.10 | 710.40 | 277.00 | 1 310.00 | 27.10 |
| 最暖季降水量Precipitation of the warmest quarter/mm | 403.40 | 123.70 | 391.10 | 415.70 | 184.00 | 883.00 | 30.70 |
| 最冷季降水量Precipitation of the coldest quarter/mm | 16.20 | 7.40 | 15.50 | 16.90 | 4.00 | 41.00 | 45.90 |
| 干旱指数Aridity index | 17.74 | 4.36 | 17.30 | 18.17 | 7.94 | 29.63 | 24.59 |
表3
云杉属各树种地理分布区的气候因子特点①"
| 气候因子 Climatic factors | 项目 Item | 鱼鳞云杉 Picea jezoensis | 红皮云杉 P.koraiensis | 白杄 P.meyeri | 青杄 P.wilsonii | 云杉 P.asperata | 青海云杉 P.crassifolia | 丽江云杉 P.likiangensis var.likiangensis | 川西云杉 P.likiangensis var.rubescens | 林芝云杉 P.likiangensis var.linzhiensis | 紫果云杉 P.purpurea | 长叶云杉 P.smithiana | 须弥云杉 P.spinulosa |
| 年均气温 Annual mean temperature/℃ | 平均值Mean | 2.47a | 2.83ab | 5.20d | 7.99e | 5.24d | 3.66bc | 6.99d | 4.73cd | 7.70e | 3.97c | 9.86f | 9.76f |
| SD | 1.70 | 0.89 | 2.93 | 3.15 | 1.73 | 1.71 | 1.80 | 1.20 | 1.33 | 1.77 | 1.51 | 0.98 | |
| CV | 68.83 | 31.45 | 56.35 | 39.42 | 33.02 | 46.72 | 25.75 | 25.37 | 17.27 | 44.58 | 15.31 | 10.04 | |
| 月均昼夜气温差Monthly mean temperature difference between day and night/℃ | 平均值Mean | 12.52bc | 12.60bc | 12.56bc | 12.03b | 14.41d | 12.96c | 12.61bc | 14.30d | 12.70c | 14.38d | 11.14a | 12.61bc |
| SD | 0.64 | 0.43 | 0.73 | 1.44 | 1.42 | 1.18 | 1.10 | 1.24 | 1.07 | 1.17 | 0.21 | 0.43 | |
| CV | 5.11 | 3.41 | 5.81 | 11.97 | 9.85 | 9.10 | 8.72 | 8.67 | 8.43 | 8.14 | 1.89 | 3.41 | |
| 最暖月最高气温 Maximal temperature of warmest month/℃ | 平均值Mean | 25.62f | 25.81f | 25.83f | 26.14f | 20.40de | 20.17cde | 18.16a | 18.69ab | 19.94cde | 18.98abc | 19.68bcd | 21.00e |
| SD | 1.54 | 1.29 | 2.96 | 3.68 | 1.56 | 1.81 | 1.58 | 1.57 | 1.64 | 1.74 | 1.57 | 1.06 | |
| CV | 6.01 | 5.00 | 11.46 | 14.08 | 7.65 | 8.97 | 8.70 | 8.40 | 8.22 | 9.17 | 7.98 | 5.05 | |
| 最冷月最低气温 Minimal temperature of coldest month/℃ | 平均值Mean | -25.25a | -24.71a | -18.28b | -12.63e | -13.95de | -16.26c | -8.72f | -13.22e | -8.05f | -15.37cd | -3.19h | -6.36g |
| SD | 2.81 | 1.67 | 3.49 | 4.41 | 2.67 | 2.16 | 2.64 | 1.74 | 1.78 | 2.74 | 1.75 | 1.04 | |
| CV | 11.13 | 6.76 | 19.09 | 34.92 | 19.14 | 13.28 | 30.28 | 13.16 | 22.11 | 17.83 | 54.86 | 16.35 | |
| 年均气温变幅 Temperature annual range/℃ | 平均值Mean | 50.87h | 50.52h | 44.10g | 38.77f | 34.35d | 36.44e | 26.88b | 31.91c | 28.00b | 34.34d | 22.87a | 27.35b |
| SD | 3.07 | 2.34 | 2.94 | 4.44 | 1.99 | 1.62 | 2.15 | 2.39 | 1.90 | 2.27 | 0.33 | 0.87 | |
| CV | 6.03 | 4.63 | 6.67 | 11.45 | 5.79 | 4.45 | 8.00 | 7.49 | 6.79 | 6.61 | 1.44 | 3.18 | |
| 年均降水量 Annual precipitation/mm | 平均值Mean | 671.6cd | 656.30c | 469.40a | 536.40b | 700.60cd | 500.60ab | 837.50e | 655.90c | 692.40cd | 727.80d | 957.20f | 1 028.90g |
| SD | 87.39 | 82.78 | 91.12 | 121.48 | 80.48 | 84.71 | 118.60 | 119.66 | 80.80 | 124.14 | 189.96 | 125.74 | |
| CV | 13.01 | 12.61 | 19.41 | 22.65 | 11.49 | 16.92 | 14.16 | 18.24 | 11.67 | 17.06 | 19.85 | 12.22 | |
| 最暖季降水量 Precipitation of warmest quarter/mm | 平均值Mean | 414.10e | 407.60e | 312.40b | 305.30b | 348.80c | 268.70a | 518.30f | 385.30de | 412.20e | 370.80cd | 638.90g | 622.90g |
| SD | 58.35 | 50.84 | 61.91 | 66.40 | 41.91 | 31.08 | 80.24 | 56.29 | 48.46 | 61.84 | 136.30 | 72.53 | |
| CV | 14.09 | 12.47 | 19.82 | 21.75 | 12.02 | 11.57 | 15.48 | 14.61 | 11.76 | 16.68 | 21.33 | 11.64 | |
| 最冷季降水量 Precipitation of coldest quarter/mm | 平均值Mean | 24.10f | 23.70f | 12.00ab | 13.20bcd | 15.70cde | 9.30a | 16.50de | 12.80bc | 15.40cde | 16.40de | 31.10g | 18.30e |
| SD | 6.09 | 5.93 | 4.01 | 4.76 | 3.49 | 2.57 | 7.33 | 5.35 | 8.01 | 4.95 | 2.90 | 8.82 | |
| CV | 25.27 | 25.02 | 33.42 | 36.06 | 22.23 | 27.63 | 44.42 | 41.80 | 52.01 | 30.18 | 9.32 | 48.20 | |
| 干旱指数 Aridity index | 平均值Mean | 18.98cd | 18.34bcd | 12.37a | 13.08a | 18.31bcd | 13.66a | 20.93ef | 17.40bc | 17.01b | 19.71de | 22.29f | 24.05g |
| SD | 2.61 | 2.43 | 2.78 | 2.72 | 1.82 | 2.24 | 2.69 | 3.25 | 1.85 | 3.43 | 4.12 | 2.80 | |
| CV | 13.75 | 13.25 | 22.47 | 20.8 | 9.94 | 16.40 | 12.85 | 18.68 | 10.88 | 17.40 | 18.48 | 11.64 |
表4
云杉属各树种间9个气候因子的方差分析①"
| 气候因子 Climatic factors | 平方和 Sums of squares | 均方 Mean squares | F | 方差来源 Percentage of variance (%) | ||||
| 种间 Between species | 种内 Within species | 种间a Between species | 种内b Within species | 种间 Between species | 种内 Within species | |||
| 年均气温Annual mean temperature/℃ | 1 864.28 | 1 450.30 | 169.48 | 3.85 | 44.02*** | 56.24 | 43.76 | |
| 月均昼夜气温差Monthly mean temperature difference between day and night/℃ | 352.96 | 457.60 | 32.09 | 1.21 | 26.52*** | 43.55 | 56.45 | |
| 最暖月最高气温Maximal temperature of the warmest month/℃ | 3 695.99 | 1 667.16 | 336.00 | 4.42 | 76.02*** | 68.91 | 31.09 | |
| 最冷月最低气温Minimal temperature of the coldest month/℃ | 11 452.33 | 2 862.00 | 1 041.12 | 7.59 | 137.17*** | 80.01 | 19.99 | |
| 年均气温变幅Temperature annual range/℃ | 21 876.06 | 2 517.31 | 1 988.73 | 6.68 | 297.71*** | 89.68 | 10.32 | |
| 年均降水量Annual precipitation/mm | 8 831 772.37 | 4 748 824.41 | 802 888.40 | 12 596.35 | 63.74*** | 65.03 | 34.97 | |
| 最暖季降水量Precipitation of eht warmest quarter/mm | 4 298 306.29 | 1 635 479.34 | 390 755.12 | 4 338.14 | 90.07*** | 72.44 | 27.56 | |
| 最冷季降水量Precipitation of eht coldest quarter/mm | 9 326.79 | 12 114.97 | 847.89 | 32.14 | 26.38*** | 43.50 | 56.50 | |
| 干旱指数Aridity index | 4 482.29 | 2 901.45 | 407.48 | 7.70 | 52.92*** | 60.70 | 39.30 | |
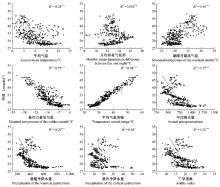
图1
我国云杉属树种地理分布经度与气候因子之间的线性回归关系 R2:线性回归的决定系数Determination coefficient of regressions; NS: P>0.05;*: P < 0.05; ***:P < 0.001.下同The same below."
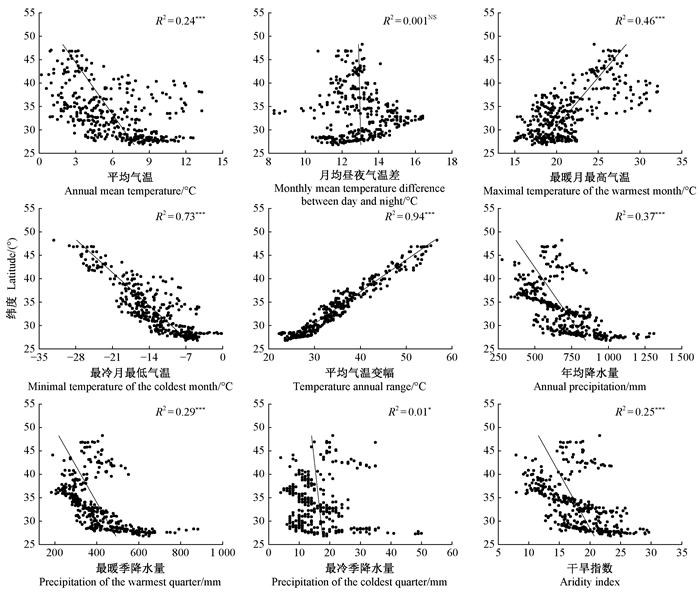
图2
中国云杉属树种地理分布纬度与各气候因子之间的回归关系"
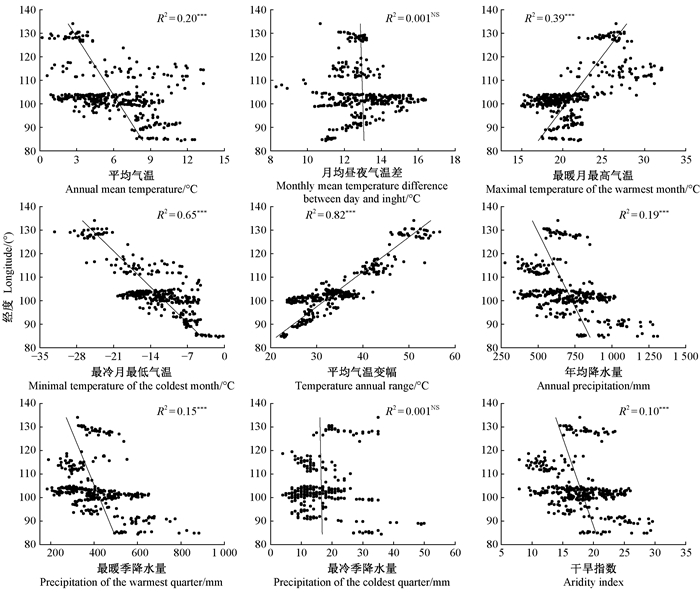
表5
各气候因子的重要性和显著性检验结果"
| 气候因子 Climatic factors | 重要性排序 Significance order | 解释量 Explained variation (%) | F | P |
| 年均气温Annual mean temperature/℃ | 5 | 20.8 | 102.87 | < 0.001 |
| 月均昼夜气温差Monthly mean temperature difference between day and night/℃ | 9 | 0.2 | 0.30 | 0.60 |
| 最暖月最高气温Maximal temperature of the warmest month/℃ | 3 | 40.2 | 262.44 | < 0.001 |
| 最冷月最低气温Minimal temperature of the coldest month/℃ | 2 | 66.8 | 785.47 | < 0.001 |
| 年均气温变幅Temperature annual range/℃ | 1 | 84.2 | 2 085.07 | < 0.001 |
| 年均降水量Annual precipitation/mm | 4 | 21.4 | 106.34 | < 0.001 |
| 最暖季降水量Precipitation of the warmest quarter/mm | 6 | 15.9 | 74.06 | < 0.001 |
| 最冷季降水量Precipitation of eht coldest quarter/mm | 8 | 0.1 | 0.94 | 0.33 |
| 干旱指数Aridity index | 7 | 13.1 | 58.98 | < 0.001 |
表6
中国云杉属树种地理分布区气候因子的RDA分析结果"
| 项目Item | 排序轴Ordination axis | |
| 轴1 Axis 1 | 轴2 Axis 2 | |
| 年均气温Annual mean temperature/℃ | -0.46 | -0.06 |
| 最暖月最高气温Maximal temperature of the warmest month/℃ | 0.64 | 0.06 |
| 最冷月最低气温Minimal temperature of the coldest month/℃ | -0.83 | -0.04 |
| 年均气温变幅Temperature annual range/℃ | 0.93 | 0.06 |
| 年均降水量Annual precipitation/mm | -0.46 | -0.38 |
| 最暖季降水量Precipitation of the warmest quarter/mm | -0.40 | -0.36 |
| 干旱指数Aridity index | -0.36 | -0.37 |
| 特征值Eigenvalues | 0.88 | 0.01 |
| 树种-环境相关性Species-environment correlations | 0.96 | 0.53 |
| 树种数据累积解释率Cumulative percentage variance of species data(%) | 88.2 | 89.2 |
| 树种-环境关系累积解释率Cumulative percentage variance of species-environment relation(%) | 99 | 100 |
| 曹玉芳, 许方, 姚敦义. 松杉类植物雌雄配子体的发育与胚胎发生. 莱阳农学院学报, 1995. 12 (3): 206- 212. | |
| Cao Y F , Xu F , Yao D Y . Tsugae plants and the development of male and female gametophyte embryogenesis. Journal of Laiyang Agriculture College, 1995. 12 (3): 206- 212. | |
| 陈飞, 王健敏, 孙宝刚, 等. 云南松的地理分布与气候关系. 林业科学研究, 2012. 25 (2): 163- 168. | |
| Chen F , Wang J M , Sun B G , et al. Relationship between geographical distribution of Pinus yunnanensis and climate. Forest Research, 2012. 25 (2): 163- 168. | |
| 雷相东, 陆元昌, 张会儒, 等. 抚育间伐对落叶松云冷杉混交林的影响. 林业科学, 2005. 41 (4): 78- 85. | |
| Lei X D , Lu Y C , Zhang H R , et al. Effects of thinning on mixed stands of Larix olgensis, Abies nephrolepis and Picea jazoensis. Scientia Silvae Sinicae, 2005. 41 (4): 78- 85. | |
| 李贺, 张维康, 王国宏. 中国云杉林的地理分布与气候因子间的关系. 植物生态学报, 2012. 36 (5): 372- 381. | |
| Li H , Zhang W K , Wang G H . Relationship between climatic factors and geographical distribution of spruce forests in China. Chinese Journal of Plant Ecology, 2012. 36 (5): 372- 381. | |
| 李莉, 李佳, 高青, 等. 昼夜温差对番茄生长发育、产量及果实品质的影响. 应用生态学报, 2015. 26 (9): 2700- 2706. | |
| Li L , Li J , Gao Q , et al. Effects of day and night temperature difference on growth development, yield and fruit quality of tomatoes. Chinese Journal of Applied Ecology, 2015. 26 (9): 2700- 2706. | |
| 李宁宁, 张爱平, 张林, 等. 气候变化下青藏高原两种云杉植物的潜在适生区预测. 植物研究, 2019. 39 (3): 395- 406. | |
| Li N N , Zhang A P , Zhang L , et al. Predicting potential distribution of two species of spruce in Qinghai-Tibet Plateau under climate change. Bulletin of Botanical Research, 2019. 39 (3): 395- 406. | |
| 李文华, 周沛村. 暗针叶林在欧亚大陆分布的基本规律及其数学模型的研究. 自然资源, 1979. 1 (1): 21- 34. | |
| Li W H , Zhou P C . The geographical distribution of the dark coniferous forest in Eurasian continent and its modeling. Natural Resources, 1979. 1 (1): 21- 34. | |
| 李晓笑, 陶翠, 王清春, 等. 中国亚热带地区4种极危冷杉属植物的地理分布特征及其与气候的关系. 植物生态学报, 2012. 36 (11): 1154- 1164. | |
| Li X X , Tao C , Wang Q C , et al. Characteristics of geographic distribution of four critically endangered species of Abies in subtropical China and its relationship with climate. Chinese Journal of Plant Ecology, 2012. 36 (11): 1154- 1164. | |
| 林玲, 段二龙, 罗建. 云杉属植物种子形态及萌发特征的种间差异. 南京林业大学学报:自然科学版, 2015. 39 (1): 62- 66. | |
| Lin L , Duan E L , Luo J . Interspecific variation in seed morphology and germination of ten plant species from Picea genus. Journal of Nanjing Forestry University:Natural Sciences Edition, 2015. 39 (1): 62- 66. | |
| 刘然, 王春晶, 何健, 等. 气候变化背景下中国冷杉属植物地理分布模拟分析. 植物研究, 2018. 38 (1): 37- 46. | |
| Liu R , Wang C J , He J , et al. Analysis of geographical distribution of Abiesin China under climate change. Bulletin of Botanical Research, 2018. 38 (1): 37- 46. | |
| 刘增力, 方精云, 朴世龙. 中国冷杉、云杉和落叶松属植物的地理分布. 地理学报, 2002. 57 (5): 577- 586. | |
| Liu Z L , Fang J Y , Piao S L . Geographical distribution of species in genera Abies, Picea and Larix in China. Acta Geographica Sinica, 2002. 57 (5): 577- 586. | |
| 马剑, 刘贤德, 金铭, 等. 祁连山青海云杉林土壤理化性质和酶活性海拔分布特征. 水土保持学报, 2019. 33 (2): 207- 213. | |
| Ma J , Liu X D , Jin M , et al. Soil physicochemical properties and enzyme activities along the altitudinal gradients in Picea crassifolia of Qilian Mountains. Journal of Soil and Water Conservation, 2019. 33 (2): 207- 213. | |
| 沈海龙, 陆天宇, 郭敏, 等. 东北三种主要造林树种枯落针叶水浸液对种子萌发的影响. 森林工程, 2019. 35 (4): 6- 13,104. | |
| Shen H L , Lu T Y , Guo M , et al. Seed germination responses to treatments of needle litter aqueous extracts of three afforestation species in Northeast China. Forest Engineering, 2019. 35 (4): 6- 13,104. | |
| 苏雪玲, 齐国亮, 郑国琦, 等. 不同产地气象因子对宁夏枸杞果实糖分积累的影响. 西北植物学报, 2015. 35 (8): 1634- 1641. | |
| Su X L , Qi G L , Zheng G Q , et al. Effect of meteorological factors of different regions on sugar accumulation in Lycium barbarum L. fruit. Acta Botanica Boreali-OccidentaliaSinica, 2015. 35 (8): 1634- 1641. | |
| 唐晓琴, 任毅华, 臧建成, 等. 冷杉梢斑螟在林芝云杉上的生物学特性. 林业科学研究, 2019. 32 (2): 60- 64. | |
| Tang X Q , Ren Y H , Zang J C , et al. Biological characteristics of Dioryctria abietella (Lepidoptera:Pyralidae) on Picea likiangensis var. linzhiensis trees. Forest Research, 2019. 32 (2): 60- 64. | |
| 王建. 中国寒温性暗针叶林分布界限温度的统计分析. 地理科学, 1990. 10 (2): 142- 149. | |
| Wang J . Statistical analysis of temperatures of both the upper and lower bounds of sub-alpine dark conifer forests in China. Scientia Geographica Sinica, 1990. 10 (2): 142- 149. | |
| 王婧如, 王明浩, 张晓玮, 等. 同倍体杂交物种紫果云杉的生态位分化及其未来潜在分布区预测. 林业科学, 2018. 54 (6): 63- 72. | |
| Wang J R , Wang M H , Zhang X W , et al. The ecological divergence and projection of future potential distribution of homoploid hybrid species Picea purpurea. Scientia Silvae Sinicae, 2018. 54 (6): 63- 72. | |
| 吴锡浩. 暗针叶林带温度研究. 科学通报, 1983. 28 (23): 1451- 1455. | |
| Wu X H . Temperature research of dark coniferous forest zone. Chinese Science Bulletin, 1983. 28 (23): 1451- 1455. | |
| 晏寒冰, 彭丽潭, 唐旭清. 基于气候变化的东北地区森林树种分布预测建模与影响分析. 林业科学, 2014. 50 (5): 132- 139. | |
| Yan H B , Peng L T , Tang X Q . Modeling and impact analysis on distribution prediction of forest tree species in Northeast China based on climate change. Scientia Silvae Sinicae, 2014. 50 (5): 132- 139. | |
| 张宁, 杨云天, 王晓勤, 等. 危害青海云杉的腮扁蜂属(膜翅目:扁蜂科)一新种. 林业科学, 2018. 54 (2): 126- 130. | |
| Zhang N , Yang Y T , Wang X Q , et al. A new species of Cephalcia Panzer (Hymenoptera:Pamphiliidae), a defoliator of Picea crassifolia. Scientia Silvae Sinicae, 2018. 54 (2): 126- 130. | |
| 中国科学院青藏高原综合科学考察队. 1985.西藏森林.北京:科学出版社. | |
| The Qinghai Tibet Plateau Comprehensive Scientific Expedition Team of the Chinese Academy of Sciences. 1985. Tibetan forest. Beijing:Science Press.[in Chinese] | |
| 中国森林编辑委员会. 中国森林, 第1卷 北京: 中国林业出版社. 1997. | |
| Committee of China Forest Comiler . China forest.Volume, Ⅰ Beijing: China Forestry Publishing House. 1998. | |
| 中国植被编辑委员会.1980.中国植被.北京:科学出版社. | |
| Chinese Vegetation Editorial Committee.1980. Vegetation of China. Beijing:Science Press.[in Chinese] | |
| Beck E H , Fettig S , Knake C , et al. Specific and unspecific responses of plants to cold and drought stress. Journal of Bioscience, 2007. 32 (3): 501- 510. | |
| Beck E H , Heim R , Hansen J . Plant resistance to cold stress:mechanisms and environmental signals triggering frost hardening and dehardening. Journal of Biosciences, 2004. 29 (4): 449- 459. | |
| Cavender-Bares J , Cortes P , Rambal S , et al. Summer and winter sensitivity of leaves and xylem to minimum freezing temperatures:a comparison of co-occurring mediterranean oaks that differ in leaf lifespan. New Phytologist, 2005. 168 (3): 597- 612. | |
| Cheng Q , Han S , Utescher T , et al. Validation of temperature-precipitation based aridity index:paleoclimatic implications. Palaeogeopraphy, Palaeoclimatology, Palaeoecology, 2013. 386 (386): 86- 95. | |
| Day M E . Influence of temperature and leaf-to-air vapor pressure deficit on net photosynthesis and stomatal conductance in red spruce (Picea rubens). Tree Physiology, 2000. 20 (1): 57- 63. | |
| Fang J Y , Kyoji Y . Climate and vegetation in China V.Effect of climatic factors on the upper limit of distribution of evergreen broadleaf forest. Ecological Research, 1991. 6 (10): 113- 125. | |
| Fang J Y , Lechowicz M J . Climatic limits for the present distribution of beech (Fagus L)species in the world.. Journal of Biogeography, 2006. 33 (10): 1804- 1819. | |
| Granda E , Scoffoni C , Rubio-Casal A E , et al. Leaf and stem physiological responses to summer and winter extremes of woody species across temperate ecosystems. Oikos, 2014. 123 (11): 1281- 1290. | |
| Hijmans R J , Cameron S E , Parra J L , et al. Very high resolution interpolated climate surfaces for global land areas. International Journal of Climatology, 2005. 25 (15): 1965- 1978. | |
| Hinesley L E . Initial growth of fraser fir seedlings at different day/night temperatures. Forest Science, 1981. 27 (3): 545- 550. | |
| Lens F , Tixier A , Cochard H , et al. Embolism resistance as a key mechanism to understand adaptive plant strategies. Current Opinion in Plant Biology, 2013. 16 (3): 287- 293. | |
| Pearce R S . Plant freezing and damage. Annual Botany, 2001. 87 (4): 417- 424. | |
| Sunoj V S J , Shroyer K J , Jagadish S V K , et al. Diurnal temperature amplitude alters physiological and growth response of maize (Zea mays L.) during the vegetative stage.. Environmental and Experimental Botany, 2016. 130 (130): 113- 121. | |
| Wang G H , Li H , Zhao H W , et al. Detecting climatically driven phylogenetic and morphological divergence among spruce (Picea) species worldwide. Biogeosciences, 2017. 14 (9): 2307- 2319. | |
| Wang M H , Wang J R , Zhang A P , et al. Functional traits related to environmental divergence in combination with phylogenetic relationship of Picea species. Dendrobiology, 2018. 80, 131- 142. | |
| Way D A , Sage R F . Elevated growth temperatures reduce the carbon gain of black spruce[Picea mariana (Mill) B.S.P.]. . Global Change Biology, 2008. 14 (3): 624- 636. | |
| Wiens J J . Speciation and ecology revisited:phylogenetic niche conservatism and the origin of species. Evolution, 2004. 58 (1): 193- 197. | |
| Wu Y , Liu Q , He H , et al. Effects of light and temperature on seed germination of Picea asperata and Betula albo-sinensis. The Journal of Applied Ecology, 2004. 15 (12): 2229- 2232. | |
| Xu Z L , Zhao C Y , Feng Z D . A study of the impact of climate change on the potential distribution of Qinghai spruce (Picea crassifolia) in Qilian Mountains. Acta EcologicaSinica, 2009. 29 (5): 278- 285. | |
| Yang W J , Wang Y H , Webb A A , et al. Influence of climatic and geographic factors on the spatial distribution of Qinghai spruce forests in the dryland Qilian Mountains of Northwest China. Science of the Total Environment, 2018. 612, 1007- 1017. | |
| Yelenosky G , Guy C L . Freezing tolerance of Citrus, Spinach, and Petunia leaf tissue-osmotic adjustment and sensitivity to freeze induced cellular dehydration. Plant Physiology, 1989. 89 (2): 444- 451. | |
|
Zhang X W , Wang J R , Ji M F , et al. Higher thermal acclimation potential of respiration but not photosynthesis in two alpine Picea taxa in contrast to two lowland congeners. PLoS ONE, 2015. 10 (4): e0123248.
doi: 10.1371/journal.pone.0123248 |
|
| Zhang X W , Chen L T , Wang J R , et al. Photosynthetic acclimation to long-term high temperature and soil drought stress in two spruce species (Picea crassifolia and P wilsonii) used for afforestation.. Journal of Forestry Research, 2018. 29 (2): 363- 372. | |
| Zhang Y , Kong Z C , Yan S , et al. Fluctuation of Picea timberline and paleo-environment on the northern slope of Tianshan mountains during the late Holocene. Chinese Science Bulletin, 2006. 51 (14): 1747- 1756. |
| [1] | 邓磊,朱春云,于世川,祁银燕,张文辉,杜盛,关晋宏. 祁连山青海云杉中龄林混交度对细根形态特征的影响[J]. 林业科学, 2020, 56(1): 191-200. |
| [2] | 庄义琳, 周金星, 吴秀芹, 曹建华, 章维鑫. 2001—2016年喀斯特断陷盆地植被变化及其驱动因素[J]. 林业科学, 2019, 55(9): 177-184. |
| [3] | 依巴代提·木合旦尔, 伊丽米努尔, 张毓涛, 刘康. 天山云杉体细胞胚的成熟及萌发条件[J]. 林业科学, 2019, 55(8): 176-183. |
| [4] | 赵志江, 郭文霞, 康东伟, 崔莉, 赵联军, 李俊清. 川西亚高山岷江冷杉和紫果云杉径向生长对气候因子的响应[J]. 林业科学, 2019, 55(7): 1-16. |
| [5] | 申静霞, 袁秀锦, 李迈和, 于飞海, 王雪, 刘录, 贺云龙, 雷静品. 土壤温度和水分变化对川西云杉幼苗氮和磷含量的影响[J]. 林业科学, 2019, 55(4): 31-41. |
| [6] | 兰洁,雷相东,张毓涛. 天山中部雪岭云杉林多功能权衡与协同关系[J]. 林业科学, 2019, 55(11): 9-18. |
| [7] | 王婧如, 王明浩, 张晓玮, 孙杉, 赵长明. 同倍体杂交物种紫果云杉的生态位分化及其未来潜在分布区预测[J]. 林业科学, 2018, 54(6): 63-72. |
| [8] | 胡兴波, 芦新建, 于洋, 贺康宁. 基于热扩散法的青海云杉冠层导度模拟[J]. 林业科学, 2018, 54(3): 8-18. |
| [9] | 白雪, 范泽鑫. 哀牢山中山湿性常绿阔叶林水青树年轮宽度对气候变化的响应[J]. 林业科学, 2018, 54(3): 161-167. |
| [10] | 张宁, 杨云天, 王晓勤, 刘萌萌, 魏美才. 危害青海云杉的腮扁蜂属(膜翅目:扁蜂科)一新种[J]. 林业科学, 2018, 54(2): 126-130. |
| [11] | 冯宜明, 李毅, 曹秀文, 刘锦乾, 齐瑞, 赵阳, 陈学龙. 甘肃南部不同密度云杉人工幼林的林分结构特征及土壤理化性质[J]. 林业科学, 2018, 54(10): 20-30. |
| [12] | 王立祥, 刘晓博, 任利利, 石娟, 骆有庆. 松树蜂入侵的混交林中针叶树种内生真菌多样性[J]. 林业科学, 2017, 53(9): 81-89. |
| [13] | 梁瀛, 李吉玫, 赵凤君, 张毓涛, 孔婷婷, 努尔古丽·马坎. 天山中部天山云杉林地表可燃物载量及其影响因素[J]. 林业科学, 2017, 53(12): 153-160. |
| [14] | 武星煜, 辛恒, 刘海秀, 杨启青, 魏美才. 危害青海云杉的阿扁蜂属(膜翅目:扁蜂科)一新种[J]. 林业科学, 2016, 52(9): 103-106. |
| [15] | 张雷, 于澎涛, 王彦辉, 王顺利, 刘贤德. 祁连山北坡青海云杉中龄林生物量随海拔的变化[J]. 林业科学, 2015, 51(8): 1-7. |
| 阅读次数 | ||||||
|
全文 |
|
|||||
|
摘要 |
|
|||||