
林业科学 ›› 2026, Vol. 62 ›› Issue (9): 110-123.doi: 10.11707/j.1001-7488.LYKX20260323
焦岩1,崔桂鹏1,2,*( ),卢琦1,3(),肖春蕾4
收稿日期:2026-05-25
修回日期:2026-07-28
出版日期:2026-09-10
发布日期:2026-09-16
通讯作者:
崔桂鹏
E-mail:cuigp@caf.ac.cn;luqi@caf.ac.cn
基金资助:
Yan Jiao1,Guipeng Cui1,2,*(),Qi Lu1,3(),Chunlei Xiao4
Received:2026-05-25
Revised:2026-07-28
Online:2026-09-10
Published:2026-09-16
Contact:
Guipeng Cui
E-mail:cuigp@caf.ac.cn;luqi@caf.ac.cn
摘要:
目的: 以察汗淖尔为例,分析主要气象因子对我国内陆河尾闾湖水面面积变化的相对贡献,为全球气候变化背景下半干旱区内陆湖泊的生态修复和水资源管理提供参考。方法: 基于1984—2025年察汗淖尔湖面面积和同期气象数据,综合采用趋势检验、突变点分析、多元回归归因等方法,定量识别湖泊面积变化特征及其驱动机制。结果: 1) 1984—2025年察汗淖尔年最大湖面面积均值为29.34 km2,湖面变化呈现显著阶段性,可划分为相对稳定期(1984—2004年)、持续萎缩期(2005—2023年)和快速扩张期(2024—2025年),湖面面积均值分别为36.78、18.16和57.35 km2。湖面在2022年萎缩至近42年来最小,但仅间隔3年后在2025年扩张至近42年来最大。2) 以湖泊年最大水面面积变化量(ΔArea)为响应的气象因子模型可解释约43%的水面年际波动,降水为最主要的正向驱动。降水贡献占比由1984—2004年的62.4%升至2005—2023年的70.1%,2024—2025年极端降水年进一步升至91.3%,降水对湖泊水面年际变化的相对解释作用逐渐增强。降水敏感性分析表明,湖面面积对降水变化的响应强度呈阶段性增强趋势,降水每增加100 mm,湖面面积在1984—2004、2005—2023、2005—2025年平均分别增加4.94、6.00、9.09 km2。3) 1984—2025年察汗淖尔流域植被覆盖度总体波动上升,并与降水量和湖面面积均呈显著正相关。4) 残差分解表明,2005—2023年主要气象因子之外的因素对湖泊面积变化影响占比增加。结论: 1984—2025年察汗淖尔湖面面积萎缩受自然和人为因素双重影响,降水、气温、潜在蒸散发、风速和太阳辐照度等气象因子的年际变化难以解释湖面持续萎缩的全部幅度。人为农业灌溉取水、地下水开采以及水文连通性变化可能对湖面萎缩具有重要作用,但其贡献仍需进一步定量验证。极端降水使湖面面积短期内快速扩张,可能为全流域开展“三北”等生态工程提供阶段性窗口期和机遇期。
中图分类号:
焦岩,崔桂鹏,卢琦,肖春蕾. “三北”地区典型内陆湖察汗淖尔1984—2025年水面面积变化及驱动因子[J]. 林业科学, 2026, 62(9): 110-123.
Yan Jiao,Guipeng Cui,Qi Lu,Chunlei Xiao. Changes in Water Surface Area and Their Driving Factors in Chahan Nur, a Typical Inland Lake in the Three-North Region, 1984—2025[J]. Scientia Silvae Sinicae, 2026, 62(9): 110-123.

图1
2025年9月察汗淖尔遥感影像与水体提取边界叠加验证 红色线表示基于Landsat-NDWI阈值分割法提取的水体边界。"


图2
1984—2025年察汗淖尔年最大水体面积"
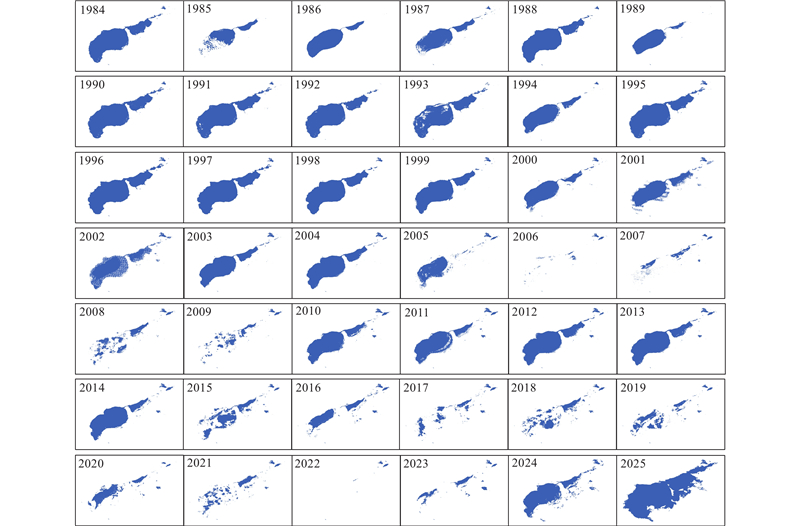

图3
1984—2025年察汗淖尔水面面积及其气象因子的变化"
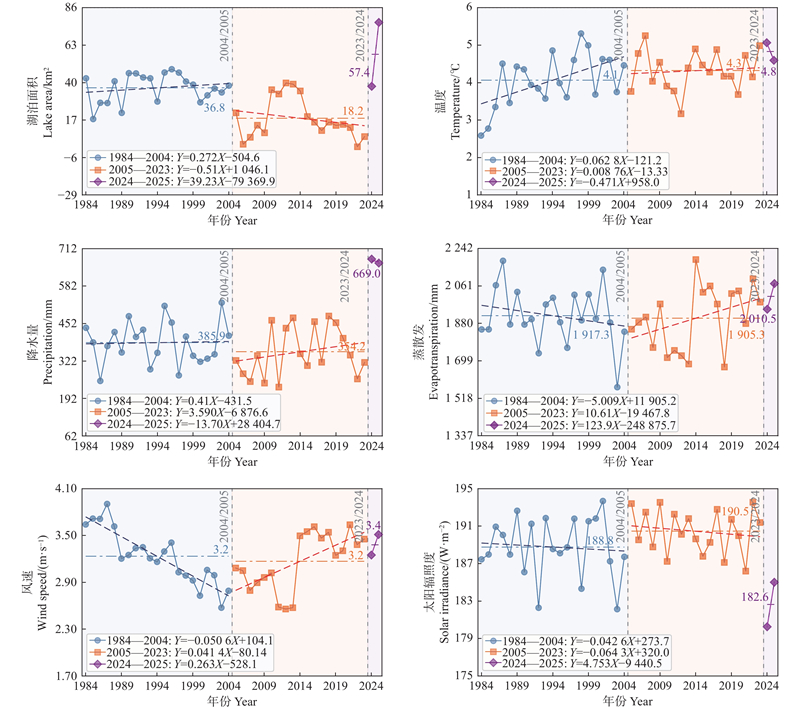
表1
不同年份的气象因子对察汗淖尔湖面变化的贡献占比"
| 年份 Year | 降水 Precipitation | 蒸散发 Evapotranspiration | 温度 Temperature | 太阳 辐照度 Solar irradiance | 风速 Wind |
| 1984—2004 | 62.4 | 12.0 | 14.0 | 0.9 | 10.7 |
| 2005—2023 | 70.1 | 12.3 | 8.2 | 0.5 | 8.8 |
| 2024—2025 | 91.3 | 2.9 | 3.6 | 0.6 | 1.6 |

图4
1984—2025年察汗淖尔水面面积年际变化量及其气象因子散点图"
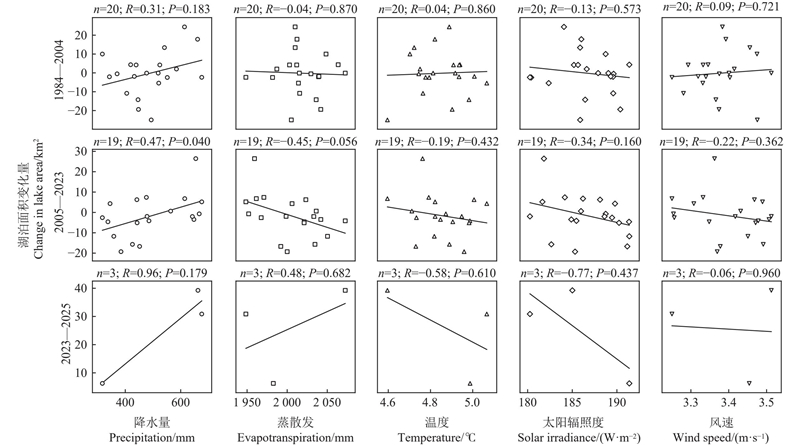
表2
降水敏感性变化的机制检验"
| Year 年份 | ΔArea 响应强度 ΔArea response intensity/ [km2·(100 mm)?1] | 95%置信区间 95% confidence interval/ [km2·(100 mm)?1] | P | 显著程度 Level of significance |
| 1984— 2004 | 4.94 | ?7.69~17.57 | 0.444 | 不显著 Not significant |
| 2005— 2023 | 6.00 | ?1.05~13.06 | 0.095 | 一般显著 Moderately significant |
| 2005— 2025 | 9.09 | 3.13~15.04 | 0.003 | 显著正相关 Significantly positively correlated |

图5
1984—2025年察汗淖尔流域植被覆盖度与湖面面积年际变化对比"


图6
1984—2025年察汗淖尔流域植被覆盖度与降水年际变化对比"


图7
1984—2025年察汗淖尔湖面年际变化量与气象归因模型预测值之差"


图8
察汗淖尔流域湖泊、地下水与农业生态指标长期变化特征"


图9
不同气象因子在当年模型与2年叠加模型中的贡献率对比"

| 陈俊鹏, 鱼腾飞, 王之君, 等. 黑河下游额济纳河水漫溢的时空演变及其影响因素. 水资源与水工程学报, 2024, 35 (5): 90- 99. | |
| Chen J P, Yu T F, Wang Z Y, et al. Spatial and temporal evolution of Ejina river overflow and its influencing factors in the lower reaches of the Heihe River. Journal of Water Resources & Water Engineering, 2024, 35 (5): 90- 99. | |
| 陈丽霞, 付建平, 陆 军, 等. 内蒙古查干淖尔湿地夏季鸟类组成和变化趋势. 林业科学, 2020, 56 (1): 145- 153. | |
| Chen L X, Fu J P, Lu J, et al. Composition and changing trends of birds in summer in the Qagan Nur Wetland of Inner Mongolia. Scientia Silvae Sinicae, 2020, 56 (1): 145- 153. | |
|
陈 鹏, 张 冰, 马 荣, 等. 坝上高原察汗淖尔湖泊面积变化及驱动要素分析. 科学技术与工程, 2023, 23 (26): 11108- 11117.
doi: 10.3969/j.issn.1671-1815.2023.26.007 |
|
|
Chen P, Zhang B, Ma R, et al. Analysis of lake area change and driving factors in Chahannur on Bashang Plateau. Science Technology and Engineering, 2023, 23 (26): 11108- 11117.
doi: 10.3969/j.issn.1671-1815.2023.26.007 |
|
| 陈永富, 刘 华, 邹文涛, 等. 三江源高寒湿地动态变化趋势分析. 林业科学, 2012, 48 (10): 70- 76. | |
| Chen Y F, Liu H, Zou W T, et al. Analysis of dynamic change trend of alpine wetlands in Three Rivers’ Source region. Scientia Silvae Sinicae, 2012, 48 (10): 70- 76. | |
|
崔桂鹏, 党宏忠, 熊 伟, 等. 对“三北”工程区退化林修复策略的思考. 林业科学, 2025, 61 (1): 10- 16.
doi: 10.11707/j.1001-7488.LYKX20240502 |
|
|
Cui G P, Dang H Z, Xiong W, et al. Thoughts on restoration strategies of degraded plantations in the area of China’s Great Green Wall Project. Scientia Silvae Sinicae, 2025, 61 (1): 10- 16.
doi: 10.11707/j.1001-7488.LYKX20240502 |
|
|
崔桂鹏, 肖春蕾, 雷加强, 等. 大国治理: 中国荒漠化防治的战略选择与未来愿景. 中国科学院院刊, 2023, 38 (7): 943- 955.
doi: 10.16418/j.issn.1000-3045.20230706002 |
|
|
Cui G P, Xiao C L, Lei J Q, et al. China’s governance: strategy choice and future vision for combating desertification. Bulletin of Chinese Academy of Sciences, 2023, 38 (7): 943- 955.
doi: 10.16418/j.issn.1000-3045.20230706002 |
|
|
樊宝敏, 董 源, 张钧成, 等. 中国历史上森林破坏对水旱灾害的影响: 试论森林的气候和水文效应. 林业科学, 2003 (3): 136- 142.
doi: 10.3321/j.issn:1001-7488.2003.03.022 |
|
|
Fan B M, Dong Y, Zhang J C, et al. Effects on flood and drought since the destruction of forests in China: a discussion on hydro-climatic effects of forest. Scientia Silvae Sinicae, 2003 (3): 136- 142.
doi: 10.3321/j.issn:1001-7488.2003.03.022 |
|
|
傅伯杰, 刘焱序, 王 帅, 等. 科学改善荒漠化地区人与自然关系. 中国科学院院刊, 2024, 39 (12): 2027- 2036.
doi: 10.16418/j.issn.1000-3045.20240714001 |
|
|
Fu B J, Liu Y X, Wang S, et al. Scientifically improving human-nature relationship in desertification areas. Bulletin of Chinese Academy of Sciences, 2024, 39 (12): 2027- 2036.
doi: 10.16418/j.issn.1000-3045.20240714001 |
|
|
傅伯杰, 刘焱序, 王 帅, 等. “治可治之沙、需治之沙”, 科学推进荒漠化防治. 中国科学院院刊, 2026, 41 (3): 490- 498.
doi: 10.3724/j.issn.1000-3045.20260127001 |
|
|
Fu B J, Liu Y X, Wang S, et al. Combatting desertification scientifically: where feasible, where necessary. Bulletin of Chinese Academy of Sciences, 2026, 41 (3): 490- 498.
doi: 10.3724/j.issn.1000-3045.20260127001 |
|
|
高彦哲, 阿拉腾图娅, 昙 娜, 等. 2000—2020年蒙古高原湖泊变化及其影响因素分析. 干旱区地理, 2023, 46 (2): 191- 200.
doi: 10.12118/j.issn.1000-6060.2022.424 |
|
|
Gao Y Z, Alatengtuya, Tan N, et al. Lake changes and their influence factors in the Mongolian Plateau from 2000 to 2020. Arid Land Geography, 2023, 46 (2): 191- 200.
doi: 10.12118/j.issn.1000-6060.2022.424 |
|
|
何明珠, 高 鑫, 赵振勇, 等. 咸海生态危机: 荒漠化趋势与生态恢复防控对策. 中国科学院院刊, 2021, 36 (2): 130- 140.
doi: 10.16418/j.issn.1000-3045.20201214001 |
|
|
He M Z, Gao X, Zhao Z Y, et al. Ecological restoration and countmeasures against desertification crisis in Aral Sea region. Bulletin of the Chinese Academy of Sciences, 2021, 36 (2): 130- 140.
doi: 10.16418/j.issn.1000-3045.20201214001 |
|
|
霍天赐, 颜 伟, 马晓飞. 内陆河尾闾湖泊水域面积变化及驱动因素研究: 以台特玛湖地区为例. 国土资源遥感, 2020, 32 (3): 149- 156.
doi: 10.6046/gtzyyg.2020.03.20 |
|
|
Huo T C, Yan W, Ma X F. A study of the variation and driving factors of the water area of the terminal lake of inland river: a case study of Taitema Lake region. Remote Sensing for Land & Resources, 2020, 32 (3): 149- 156.
doi: 10.6046/gtzyyg.2020.03.20 |
|
|
纪 平, 邵全琴, 王 敏, 等. 中国三北防护林工程第二阶段生态效益综合评价. 林业科学, 2022, 58 (11): 31- 48.
doi: 10.11707/j.1001-7488.20221104 |
|
|
Ji P, Shao Q Q, Wang M, et al. Monitoring and assessment of ecological benefits of the shelter forest program in The Three-North Region during 2001-2020. Scientia Silvae Sinicae, 2022, 58 (11): 31- 48.
doi: 10.11707/j.1001-7488.20221104 |
|
|
孔维远, 崔桂鹏, 高 攀, 等. “三北”工程的林草科技探索与实践. 林业科学, 2025, 61 (7): 72- 82.
doi: 10.11707/j.1001-7488.LYKX20250302 |
|
|
Kong W Y, Cui G P, Gao P, et al. Forestry science and technology innovation and application in the Great Green Wall Project of China. Scientia Silvae Sinicae, 2025, 61 (7): 72- 82.
doi: 10.11707/j.1001-7488.LYKX20250302 |
|
|
李保国, 马黎春, 蒋平安, 等. 罗布泊 “大耳朵” 干盐湖区地形特征与干涸时间讨论. 科学通报, 2008, 53 (3): 327- 334.
doi: 10.3321/j.issn:0023-074X.2008.03.009 |
|
|
Li B G, Ma L C, Jiang P A, et al. Discussion on the geomorphological characteristics and desiccation timing of the “Big Ear” dry salt lake area in Lop Nur. Chinese Science Bulletin, 2008, 53 (3): 327- 334.
doi: 10.3321/j.issn:0023-074X.2008.03.009 |
|
|
李长龙, 王 燕, 高志海, 等. 2000—2020年中国荒漠化潜在发生范围区林草覆被时空变化特征. 地理学报, 2022, 77 (11): 2803- 2816.
doi: 10.11821/dlxb202211008 |
|
|
Li C L, Wang Y, Gao Z H, et al. Spatial and temporal characteristics of forest and grass cover in the potential range of desertification in China from 2000 to 2020. Acta Geographica Sinica, 2022, 77 (11): 2803- 2816.
doi: 10.11821/dlxb202211008 |
|
|
李晓松, 杨恒聪, 卢 琦, 等. 基于遥感大数据的“三北”可持续发展评估: 指标、数据与方法. 林业科学, 2026, 62 (7): 50- 60.
doi: 10.11707/j.1001-7488.LYKX20250566 |
|
|
Li X S, Yang H C, Lu Q, et al. Sustainable development assessment of “Three-North” based on big remote sensing data: indicator, data, and method. Scientia Silvae Sinicae, 2026, 62 (7): 50- 60.
doi: 10.11707/j.1001-7488.LYKX20250566 |
|
|
孟子君. 张家口察汗淖尔流域多年降水情况分析. 地下水, 2023, 45 (5): 246- 247, 263.
doi: 10.19807/j.cnki.DXS.2023-05-080 |
|
|
Meng Z J. Analysis of multi-year precipitation in the Chahan Nur Basin, Zhangjiakou. Underground Water, 2023, 45 (5): 246- 247, 263.
doi: 10.19807/j.cnki.DXS.2023-05-080 |
|
|
王浩轩, 黄 峰, 郭利丹, 等. 咸海萎缩速率变化及驱动因素分析. 水文, 2023, 43 (3): 107- 111.
doi: 10.19797/j.cnki.1000-0852.20210495 |
|
|
Wang H X, Huang F, Guo L D, et al. Analysis of shrinking rate variation and its driving factors of the Aral Sea. Journal of China Hydrology, 2023, 43 (3): 107- 111.
doi: 10.19797/j.cnki.1000-0852.20210495 |
|
|
颜长珍, 李 森, 逯军峰, 等. 1975—2015年腾格里沙漠湖泊面积与数量. 中国沙漠, 2020, 40 (4): 183- 189.
doi: 10.7522/j.issn.1000-694X.2020.00045 |
|
|
Yan C Z, Li S, Lu J F, et al. Lake number and area in the tengger desert during 1975—2015. Journal of Desert Research, 2020, 40 (4): 183- 189.
doi: 10.7522/j.issn.1000-694X.2020.00045 |
|
|
杨 柳, 闫 峰, 王艳姣. 科尔沁和浑善达克沙地植被覆盖度时空变化及驱动力. 林业科学, 2025, 61 (11): 70- 79.
doi: 10.11707/j.1001-7488.LYKX20240686 |
|
|
Yang L, Yan F, Wang Y J. Spatiotemporal variations characteristics and driving forces of vegetation coverage in the Horqin and Otindag sandy lands. Scientia Silvae Sinicae, 2025, 61 (11): 70- 79.
doi: 10.11707/j.1001-7488.LYKX20240686 |
|
|
杨维西. 全球变化中的中国干旱区: 响应与趋势. 林业科学, 2008, 44 (8): 124- 130.
doi: 10.3321/j.issn:1001-7488.2008.08.022 |
|
|
Yang W X. China’s arid regions in the global change: response and trend. Scientia Silvae Sinicae, 2008, 44 (8): 124- 130.
doi: 10.3321/j.issn:1001-7488.2008.08.022 |
|
|
叶朝霞, 陈亚宁, 张淑花. 不同情景下干旱区尾闾湖泊生态水位与需水研究: 以黑河下游东居延海为例. 干旱区地理, 2017, 40 (5): 951- 957.
doi: 10.13826/j.cnki.cn65-1103/x.2017.05.004 |
|
|
Ye Z X, Chen Y N, Zhang S H. Ecological water level and water demand of the rump lake in arid land under different scenarios: a case of east Juyanhai at the downstream of Heihe River. Arid Land Geography, 2017, 40 (5): 951- 957.
doi: 10.13826/j.cnki.cn65-1103/x.2017.05.004 |
|
|
于晓燕, 高雅娴, 魏光普, 等. 内蒙古自治区植被恢复力时空格局及其对极端气候的响应. 林业科学, 2025 (9): 48- 58.
doi: 10.11707/j.1001-7488.LYKX20230763 |
|
|
Yu X Y, Gao Y X, Wei G P, et al. Spatio-temporal pattern of vegetation resilience and its response to extreme climate in Inner Mongolia Autonomous Region. Scientia Silvae Sinicae, 2025 (9): 48- 58.
doi: 10.11707/j.1001-7488.LYKX20230763 |
|
|
袁泽雨, 许 行, 任 怡, 等. 2001—2021年“三北”工程区植被韧性分布特征及其驱动因素. 林业科学, 2025, 61 (7): 182- 191.
doi: 10.11707/j.1001-7488.LYKX20240683 |
|
|
Yuan Z Y, Xu H, Ren Y, et al. Distribution characteristics of vegetation resilience and its driving factors in the Three-North Shelterbelt Forest Program region from 2001 to 2021. Scientia Silvae Sinicae, 2025, 61 (7): 182- 191.
doi: 10.11707/j.1001-7488.LYKX20240683 |
|
|
张 华, 张 兰, 赵传燕. 极端干旱区尾闾湖生态需水估算: 以东居延海为例. 生态学报, 2014, 34 (8): 2102- 2108.
doi: 10.5846/stxb201306171720 |
|
|
Zhang H, Zhang L, Zhao C Y. Ecological water requirement estimation of the rump lake in an extreme arid region of East Juyanhai. Acta Ecologica Sinica, 2014, 34 (8): 2102- 2108.
doi: 10.5846/stxb201306171720 |
|
| 赵 丹, 石建省, 聂洪峰, 等. 察汗淖尔: 典型萎缩湖泊的生态困境及保护修复. 地球, 2021 (1): 52- 57. | |
| Zhao D, Shi J S, Nie H F, et al. Chahan Nur: ecological challenges of a typical shrinking lake and its conservation and restoration. Earth, 2021 (1): 52- 57. | |
|
赵 军, 杨建霞, 朱国锋. 生态输水对青土湖周边区域植被覆盖度的影响. 干旱区研究, 2018, 35 (6): 1251- 1261.
doi: 10.13866/j.azr.2018.06.01 |
|
|
Zhao J, Yang J X, Zhu G F. Effect of ecological water conveyance on vegetation coverage in surrounding area of the Qingtu Lake. Arid Zone Research, 2018, 35 (6): 1251- 1261.
doi: 10.13866/j.azr.2018.06.01 |
|
|
郑群芳, 庞建壮, 张祎帆, 等. “三北” 工程区植被水分利用效率的时空变化特征. 林业科学, 2026, 62 (2): 75- 84.
doi: 10.11707/j.1001-7488.LYKX20240823 |
|
|
Zheng Q F, Pang J Z, Zhang Y F, et al. Spatiotemporal variation characteristics of vegetation water use efficiency in the Three-North Shelterbelt Forest Program region. Scientia Silvae Sinicae, 2026, 62 (2): 75- 84.
doi: 10.11707/j.1001-7488.LYKX20240823 |
|
|
周尚哲, 崔桂鹏, 高 攀, 等. 关于荒漠生态系统健康评价的新思考. 陆地生态系统与保护学报, 2024, 4 (4): 49- 57.
doi: 10.12356/j.2096-8884.2024-0059 |
|
|
Zhou S Z, Cui G P, Gao P, et al. New thinking on desert ecosystem health assessment. Terrestrial Ecosystem and Conservation, 2024, 4 (4): 49- 57.
doi: 10.12356/j.2096-8884.2024-0059 |
|
|
卓 静, 朱延年, 王 娟, 等. 红碱淖面积时空演变规律及保护措施成效. 中国沙漠, 2019, 39 (4): 195- 203.
doi: 10.7522/j.issn.1000-694X.2019.00052 |
|
|
Zhuo J, Zhu Y N, Wang J, et al. Spatio-temporal change of water area in Hongjiannao Lake and the effectiveness of protection measures. Journal of Desert Research, 2019, 39 (4): 195- 203.
doi: 10.7522/j.issn.1000-694X.2019.00052 |
|
|
Bai J, Chen X, Li J L, et al. Changes in the area of inland lakes in arid regions of central Asia during the past 30 years. Environmental Monitoring and Assessment, 2011, 178 (1): 247- 256.
doi: 10.1007/s10661-010-1686-y |
|
| Cao Z G, Melack J M, Liu M, et al. 2023. Shifts, trends, and drivers of lake color across China since the 1980s. Geophysical Research Letters, 50(8): e2023GL103225. | |
|
Chen C, Park T, Wang X H, et al. China and India lead in greening of the world through land-use management. Nature Sustainability, 2019, 2 (2): 122- 129.
doi: 10.1038/s41893-019-0220-7 |
|
|
Coe M T, Foley J A. Human and natural impacts on the water resources of the Lake Chad basin. Journal of Geophysical Research: Atmospheres, 2001, 106 (D4): 3349- 3356.
doi: 10.1029/2000JD900587 |
|
|
Ellis E C, Malhi Y, Ritchie H, et al. An aspirational approach to planetary futures. Nature, 2025, 642 (8069): 889- 899.
doi: 10.1038/s41586-025-09080-1 |
|
| Lensky N G, Dvorkin Y, Lyakhovsky V, et al. 2005. Water, salt, and energy balances of the Dead Sea. Water Resources Research, 41(12): 2005WR004084. | |
|
Micklin P. The future Aral Sea: hope and despair. Environmental Earth Sciences, 2016, 75 (9): 844.
doi: 10.1007/s12665-016-5614-5 |
|
|
Miguez-Macho G, Fan Y. A global humidity index with lateral hydrologic flows. Nature, 2025, 644 (8076): 413- 419.
doi: 10.1038/s41586-025-09359-3 |
|
|
Samant R, Prange M. Climate-driven 21st century Caspian Sea level decline estimated from CMIP6 projections. Communications Earth & Environment, 2023, 4, 357.
doi: 10.1038/s43247-023-01017-8 |
|
|
Scordo F, Seitz C, Buria L, et al. Climatic and human impacts on Patagonian terminal lakes. Science of the Total Environment, 2025, 966, 178714.
doi: 10.1016/j.scitotenv.2025.178714 |
|
| Tao S L, Fang J Y, Zhao X, et al. Rapid loss of lakes on the Mongolian Plateau. Proceedings of the National Academy of Sciences of the United States of America, 2015, 112 (7): 2281- 2286. | |
|
Veh G, Wang B G, Zirzow A, et al. Progressively smaller glacier lake outburst floods despite worldwide growth in lake area. Nature Water, 2025, 3 (3): 271- 283.
doi: 10.1038/s44221-025-00388-w |
|
|
Wang C Y, Wang M M, Xie M J, et al. Climate extremes intensify global lake eutrophication by increasing the stress resistance of harmful bloom-forming algae. Nature Communications, 2026, 17, 2859.
doi: 10.1038/s41467-026-69529-3 |
|
| Weyhenmeyer G A, Chukwuka A V, Anneville O, et al. 2024. Global lake health in the anthropocene: societal implications and treatment strategies. Earth’s Future, 12(4): e2023EF004387. | |
|
Wurtsbaugh W A, Miller C, Null S E, et al. Decline of the world’s saline lakes. Nature Geoscience, 2017, 10 (11): 816- 821.
doi: 10.1038/ngeo3052 |
|
|
Yang J X, Zhao J, Zhu G F, et al. Effects of ecological water conveyance on soil salinization in the Shiyang River Basin’s terminal lake: qingtu lake: area. Sustainability, 2022, 14 (16): 10311.
doi: 10.3390/su141610311 |
|
|
Yao F F, Livneh B, Rajagopalan B, et al. Satellites reveal widespread decline in global lake water storage. Science, 2023, 380 (6646): 743- 749.
doi: 10.1126/science.abo2812 |
|
|
Zhang Y, Zhu G F, Ma H Y, et al. Effects of ecological water conveyance on the hydrochemistry of a terminal lake in an inland river: a case study of qingtu lake in the Shiyang River Basin. Water, 2019, 11 (8): 1673.
doi: 10.3390/w11081673 |
| [1] | 王丽薇,王宏超,李颖,张燕,池秀莲,孙楷. “三北”工程区药用植物物种多样性特征及其对区域发展的启示[J]. 林业科学, 2026, 62(7): 12-26. |
| [2] | 郑群芳,庞建壮,张祎帆,吴小云,张勤,许行,许杨,张志强. “三北”工程区植被水分利用效率的时空变化特征[J]. 林业科学, 2026, 62(2): 75-84. |
| [3] | 孔维远,崔桂鹏,高攀,崔梦淳,却晓娥,封焕英,卢琦. “三北”工程的林草科技探索与实践[J]. 林业科学, 2025, 61(7): 72-82. |
| 阅读次数 | ||||||
|
全文 |
|
|||||
|
摘要 |
|
|||||

