
Scientia Silvae Sinicae ›› 2021, Vol. 57 ›› Issue (10): 36-48.doi: 10.11707/j.1001-7488.20211004
Previous Articles Next Articles
Jiaqi Ding1,3,Wenli Huang1,2,*,Yingchun Liu4,Yang Hu5
Received:2020-09-18
Online:2021-10-25
Published:2021-12-11
Contact:
Wenli Huang
CLC Number:
Jiaqi Ding,Wenli Huang,Yingchun Liu,Yang Hu. Estimation of Forest Aboveground Biomass in Northwest Hunan Province Based on Machine Learning and Multi-Source Data[J]. Scientia Silvae Sinicae, 2021, 57(10): 36-48.
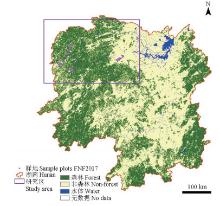
Fig.1
Study area and sample plots distribution"
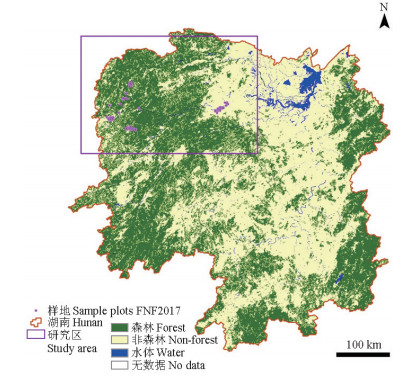
Table 1
Survey of sample plot data"
| 类型 Type | 数量 Count | Dmin | Dmax | Davg | Dstd | Hmin | Hmax | Havg | Hstd | Nmin | Nmax | Navg | Nstd |
| 栎属Quercus sp. | 41 | 6.9 | 33.0 | 13.7 | 5.2 | 4.6 | 20.1 | 10.1 | 3.7 | 13.0 | 158.0 | 55.7 | 33.6 |
| 杉木Cunninghamia lanceolata | 39 | 7.8 | 39.1 | 16.9 | 8.3 | 5.3 | 27.4 | 12.1 | 5.3 | 8.0 | 104.0 | 49.5 | 32.3 |
| 马尾松Pinus massoniana | 39 | 3.8 | 32.2 | 14.8 | 6.4 | 2.9 | 18.6 | 10.6 | 3.8 | 9.0 | 116.0 | 41.9 | 24.4 |
| 杨属Populus sp. | 27 | 6.4 | 22.6 | 11.7 | 3.8 | 4.8 | 14.9 | 8.7 | 3.1 | 10.0 | 155.0 | 55.8 | 32.9 |
| 柏木Cupressus funebris | 41 | 6.2 | 44.1 | 15.2 | 7.4 | 4.8 | 28.4 | 11.0 | 4.8 | 7.0 | 170.0 | 59.0 | 43.0 |
| 湿地松Pinus elliottii | 50 | 5.8 | 41.2 | 17.0 | 7.9 | 5.5 | 23.8 | 11.9 | 4.2 | 7.0 | 131.0 | 42.1 | 31.2 |
| 樟Cinnamomum camphora | 39 | 5.3 | 29.8 | 14.9 | 6.5 | 3.6 | 19.7 | 11.2 | 4.2 | 10.0 | 207.0 | 54.8 | 39.6 |
| 针叶混Coniferous mixed forests | 43 | 5.4 | 34.6 | 14.6 | 6.9 | 4.2 | 23.8 | 10.2 | 3.9 | 9.0 | 206.0 | 55.0 | 44.2 |
| 针阔混Coniferous and broad-leaved mixed forests | 39 | 3.8 | 51.8 | 16.4 | 10.5 | 3.0 | 32.7 | 12.0 | 6.3 | 4.0 | 177.0 | 55.1 | 41.2 |
| 阔叶混Broad-leaved mixed forests | 35 | 4.0 | 44.1 | 15.3 | 7.3 | 3.0 | 26.7 | 11.5 | 4.5 | 5.0 | 159.0 | 62.1 | 40.6 |
| 总计Total | 393 | 3.8 | 51.8 | 15.2 | 7.4 | 2.9 | 32.7 | 11.0 | 4.5 | 4.0 | 207.0 | 52.7 | 37.0 |
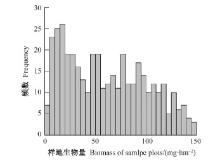
Fig.2
Biomass distribution of sample plots"
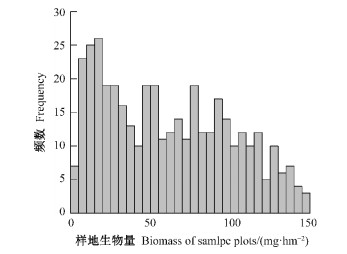
Table 2
Optical remote sensing data index (sorted by original value)"
| 波段/指数 Band/index | 统计量 Statistical variables |
| Blue | min max avmin25 av75max av2575 |
| Green | |
| Red | |
| NIR | |
| SWIR1 | |
| SWIR2 | |
| NDVI =(NIR-Red)/(NIR+Red) | |
| NS1=(NIR-SWIR1)/(NIR+SWIR1) | |
| NS2=(NIR-SWIR2)/(NIR+SWIR2) | |
| SVVI |
Table 3
Optical remote sensing data index (sorted by reference value)"
| 波段Band | 参考值 Reference value | 统计量 Statistical variables |
| Blue | NDVI =(NIR-Red)/(NIR+Red) NS2=(NIR-SWIR2)/(NIR+SWIR2) LST | min max |
| Green | ||
| Red | ||
| NIR | ||
| SWIR1 | ||
| SWIR2 |
Table 4
SAR data index"
| 数据Data | 指标 Index | 波段 Band | 极化方式 Polarization mode | 意义Meaning |
| Sentinel-1 | s1vv | C | VV | 均值Mean value |
| s1vh | C | VH | 均值Mean value | |
| s1vvmd | C | VV | 中值Median value | |
| s1vhmd | C | VH | 中值Median value | |
| s1vvsd | C | VV | 标准差Standard deviation | |
| s1vhsd | C | VH | 标准差Standard deviation | |
| S1NPDI | (VV-VH)/(VV+VH) | — | 归一化极化差分指数 Normalized polarization difference index | |
| PALSAR-2 | p2hh | L | HH | 均值Mean value |
| p2hv | L | HV | 均值Mean value | |
| P2NPDI | (HH-HV)/(HH+HV) | — | 归一化极化差分指数 Normalized polarization difference index |
Table 5
Characteristic variables selected by random forest method"
| 数据Data | 指标Index | 意义Meaning |
| Landsat-8 | l8tcwgd | 缨帽变换湿度、绿度分量差值 Difference of humidity and greenness components of tassel cap transformation |
| l8rminSVVI | SVVI指数最小值对应的Red波段值 Red band value corresponding to the minimum value of SVVI index | |
| l8gminSVVI | SVVI指数最小值对应的Green波段值 Green band value corresponding to the minimum value of SVVI index | |
| l8r | Red波段较小四分位数-较大四分位数年均值 Lower quartile-larger quartile annual average value of Red band | |
| l8g | Green波段较小四分位数-较大四分位数年均值 Lower quartile-larger quartile annual average value of Green band | |
| l8NS1av75max | NS1指数较大四分位数-最大值年均值 Larger quartile-maximum annual average value of NS1 index | |
| l8rminLST | LST最小值对应的Red波段值 Red band value corresponding to the LST minimum | |
| l8gminLST | LST最小值对应的Green波段值 Green band value corresponding to the LST minimum | |
| l8SVVIav75max | SVVI指数较大四分位数-最大值年均值 Larger quartile-maximum annual average value of SVVI index | |
| l8b25min | Blue波段最小值-较小四分位数年均值 Minimum-lower quartile annual average value of Blue band | |
| PALSAR-2 | p2hv | HV极化后向散射系数 Backward scattering coefficient for HV polarization |
| p2hh | HH极化后向散射系数 Backward scattering coefficient for HH polarization | |
| DEM | dem | 高程值 Elevation value |
Table 6
Characteristic variables selected by stepwise regression method"
| 数据Data | 类型Type | 指标Indices |
| Landsat-8 | 光谱信息Spectral information | l8r、l8evi2、l8NS2av2575、l8nir75smax、l8NS1av2575、l8NS1min、l8sw1max、l8sw1minLST、l8rminSVVI、l8sw1minRN、l8rmin、l8NS2max、l8bmin |
| 纹理特征Texture features | l8gvari、l8gmean、l8rvari、l8ghomo、l8rmean | |
| PALSAR-2 | 后向散射系数Backward scattering coefficient | p2hv |
Table 7
Independent variable coefficient of multiple linear regression"
| 自变量 Independent variable | 系数 Coefficient | 标准误差 Standard error | 显著性 Significance | 自变量 Independent variable | 系数 Coefficient | 标准误差 Standard error | 显著性 Significance | |
| 截距项 Intercept | 61.257 | 1.487 | *** | l8NS1av2575 | 45.445 | 15.106 | ** | |
| l8gvari | 96.107 | 28.876 | *** | l8NS1min | 43.395 | 14.736 | ** | |
| l8gmean | -94.852 | 26.539 | *** | l8sw1max | 38.757 | 12.013 | ** | |
| l8r | 83.455 | 21.171 | *** | l8sw1minLST | 30.399 | 8.085 | *** | |
| l8evi2 | 70.506 | 16.158 | *** | l8rminSVVI | -29.941 | 8.482 | *** | |
| l8rvari | -69.783 | 21.690 | ** | l8sw1minRN | 25.676 | 9.619 | ** | |
| l8NS2av2575 | -60.002 | 17.280 | *** | l8rmin | -25.067 | 8.087 | ** | |
| l8nir75smax | -52.524 | 14.170 | *** | l8NS2max | -19.598 | 7.398 | ** | |
| l8ghomo | -51.937 | 18.538 | ** | l8bmin | 16.899 | 4.382 | *** | |
| l8rmean | 49.109 | 18.891 | ** | p2hv | 8.215 | 1.931 | *** |
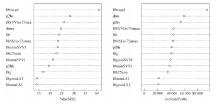
Fig.3
The influence evaluation of independent variables for the random forest model"
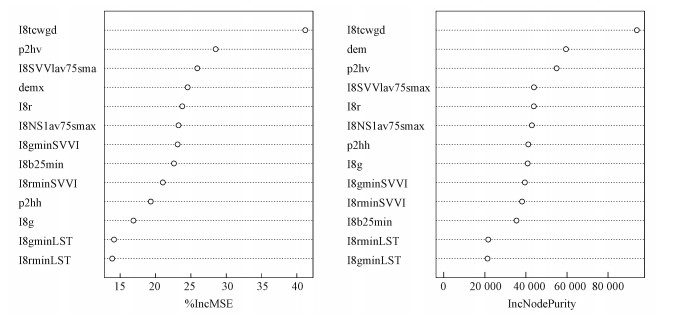
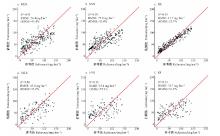
Fig.4
Performance of different model on training sets(a, b, c) and test sets(d, e, f)"
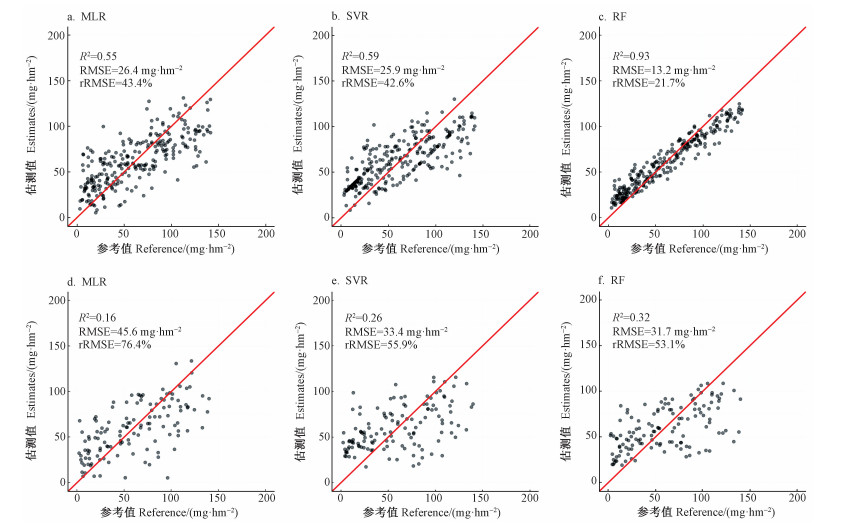
Table 8
Evaluation results of different models"
| 算法Algorithm | 训练集 Training set | 测试集 Test set | |||||
| RMSE | rRMSE | R2 | RMSE | rRMSE | R2 | ||
| MLR | 30.9 | 50.5 | 0.39 | 32.6 | 54.1 | 0.30 | |
| RF | 12.8 | 21.1 | 0.93 | 30.1 | 51.3 | 0.42 | |
| SVR | 26.1 | 43.3 | 0.55 | 32.8 | 55.3 | 0.25 | |
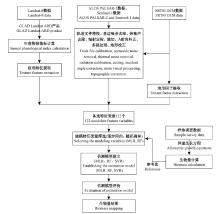
Fig.5
Technical flowchart of regional biomass mapping"
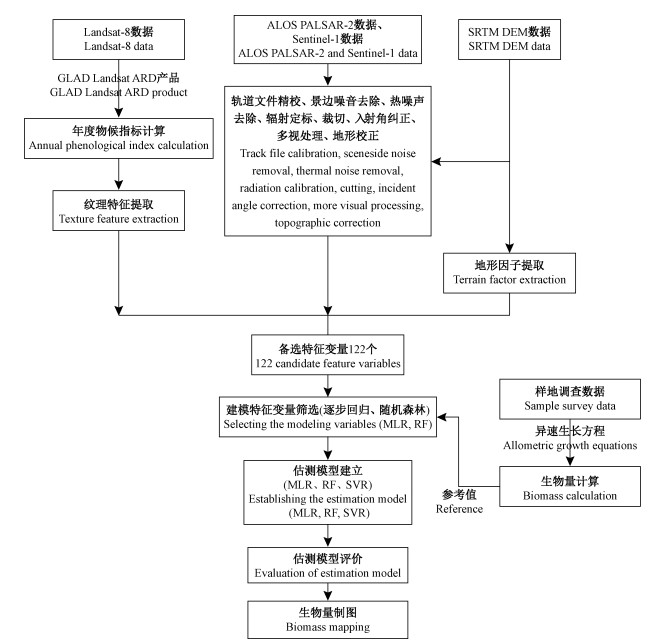
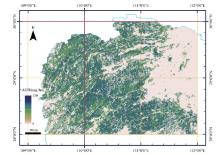
Fig.6
Biomass map of northwest Hunan Province, China"
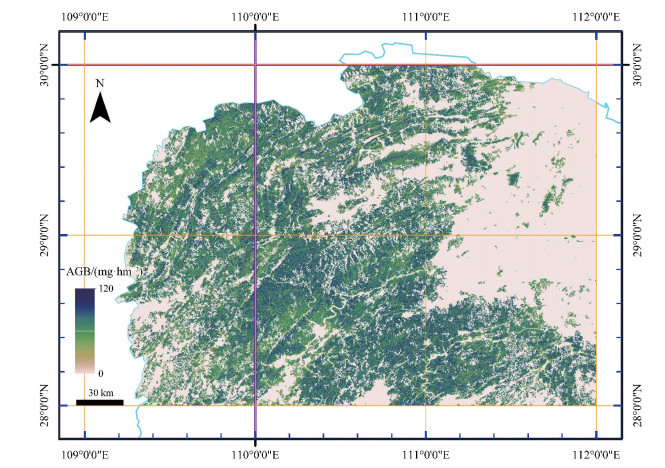
Table 9
Comparison of biomass mapping products"
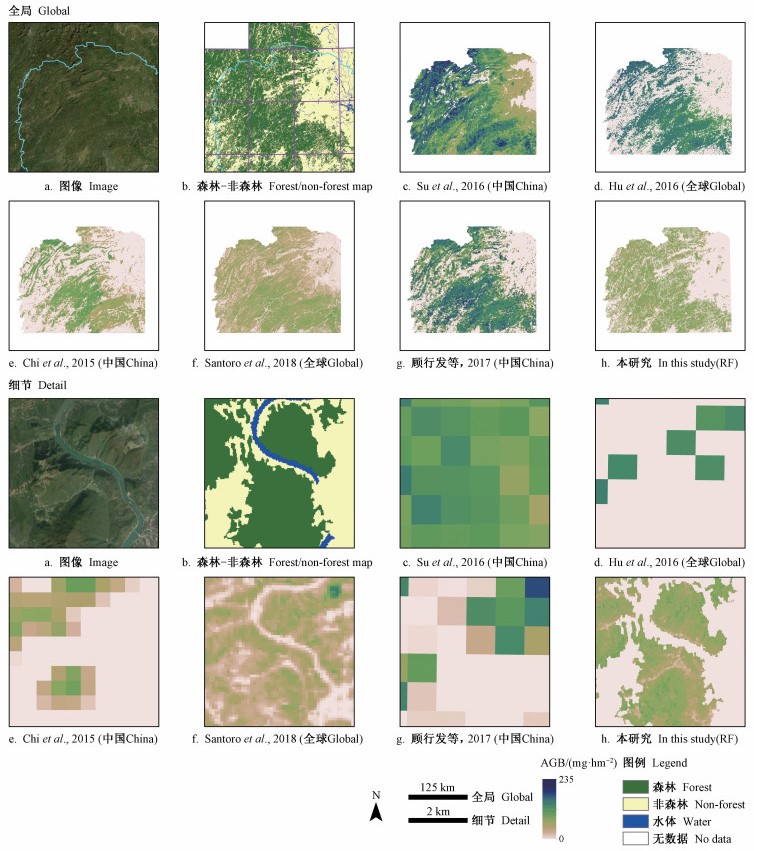
| 文献 Reference | 范围 Coverage | 年份 Year | 遥感数据源 Remote sensing data source | 分辨率 Resolution/m | 检验指标 Evaluation index | 研究区内生物量 Biomass in the study area/(mg·hm-2) | ||
| 均值 Mean value | 最大值 Maximum value | 标准差 Standard deviation | ||||||
| 中国China | 2004 | GLAS、MODIS | 1 000 | 调整R2(全国为0.75)、RMSE(热带常绿阔叶林为45.86 mg·hm-2) Radj2 (0.75 nationally), RMSE (45.86 mg·hm-2 for tropical evergreen broadleaf forest) | 101.9 | 231.9 | 51.2 | |
| 全球Global | 2004 | GLAS、MODIS | 1 000 | 调整R2(全球为0.56)、RMSE(全球为87.53 mg·hm-2) Radj2 (0.56 globally), RMSE (87.53 mg·hm-2 globally) | 65.9 | 184.0 | 69.3 | |
| 中国China | 2006 | GLAS、MODIS | 500 | 相对误差(湖南省为22.07%)Relative error (22.07% for Hunan Province) | 32.5 | 137.7 | 37.1 | |
| 全球Global | 2010 | GLAS、ASAR、PALSAR、MODIS、Landsat | 100 | 标准误差Standard error | 43.0 | 170.0 | 27.7 | |
| 中国China | 2015 | PALSAR、MODIS、Landsat | 1 000 | 相对精度(与第八次全国森林调查结果相比为73.9%)Relative accuracy (73.9% compared to the results of the 8th national forest survey) | 74.1 | 209.9 | 63.1 | |
| 本研究In this study(RF) | 湘西北部Northwest Hunan Province, China | 2017 | PALSAR-2、Sentinel-1、Landsat | 25 | RMSE=30.1 mg·hm-2, rRMSE=51.3%, R2=0.42 | 37.5 | 119.0 | 35.9 |
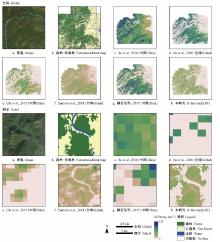
Fig.7
Comparison of biomass mapping products"
| 曹春香, 倪希亮, 陈伟, 等. 森林地上生物量遥感诊断. 北京: 科学出版社, 2015. | |
| Cao C X , Ni X L , Chen W , et al. Remote sensing diagnosis of aboveground biomass in forests. Beijing: Science Press, 2015. | |
| 董金金. 2014. 基于PSO-SVM的森林地上生物量遥感估测与空间分析——以泰山景区为例. 泰安: 山东农业大学硕士学位论文. | |
| Dong J J. 2014. Remote sensing estimation and spatial distribution analysis of forest above ground biomass based on PSO-SVM: a case study for Mount Tai Scenic. Tai'an: MS thesis of Shandong Agricultural University. [in Chinese] | |
| 顾行发, 汪克. 中国可持续发展遥感监测报告(2016). 北京: 社会科学文献出版社, 2017. | |
| Gu X F , Wang K . China sustainable development remote sensing monitoring report (2016). Beijing: Social Sciences Literature Press, 2017. | |
| 湖南省统计局. 湖南统计年鉴. 北京: 中国统计出版社, 2019. | |
| Hunan Provincial Bureau of Statistics . Hunan statistical yearbook. Beijing: China Statistics Press, 2019. | |
| 廖凯涛, 齐述华, 王成, 等. 结合GLAS和TM卫星数据的江西省森林高度和生物量制图. 遥感技术与应用, 2018, 33 (4): 713- 720. | |
| Liao K T , Qi S H , Wang C , et al. Estimation of forest aboveground biomass and canopy height in Jiangxi Province using GLAS and landsat TM images. Remote Sensing Technology and Application, 2018, 33 (4): 713- 720. | |
| 刘茜, 杨乐, 柳钦火, 等. 森林地上生物量遥感反演方法综述. 遥感学报, 2015, 19 (1): 62- 74. | |
| Liu Q , Yang L , Liu Q H , et al. Review of forest above ground biomass inversion methods based on remote sensing technology. Journal of Remote Sensing, 2015, 19 (1): 62- 74. | |
| 罗云建, 王效科, 逯非. 中国主要林木生物量模型手册. 北京: 中国林业出版社, 2015. | |
| Luo Y J , Wang X K , Lu F . Manual of major forest biomass models in China. Beijing: China Forestry Publishing House, 2015. | |
| 蒙诗栎, 庞勇, 张钟军, 等. WorldView-2纹理的森林地上生物量反演. 遥感学报, 2017, 21 (5): 812- 824. | |
| Meng S L , Pang Y , Zhang Z J , et al. Estimation of aboveground biomass in a temperate forest using texture information from WorldView-2. Journal of Remote Sensing, 2017, 21 (5): 812- 824. | |
| 庞勇, 李增元, 陈博伟, 等. 星载激光雷达森林探测进展及趋势. 上海航天, 2019, 36 (3): 20- 27. | |
| Pang Y , Li Z Y , Chen B W , et al. Statas and development of space borne LiDAR applications in forestry. Shanghai Aerospace, 2019, 36 (3): 20- 27. | |
|
庞勇, 李增元, 陈尔学, 等. 激光雷达技术及其在林业上的应用. 林业科学, 2005, 41 (3): 129- 136.
doi: 10.3321/j.issn:1001-7488.2005.03.022 |
|
|
Pang Y , Li Z Y , Chen E X , et al. LiDAR remote sensing technology and its application in forestry. Forestry Science, 2005, 41 (3): 129- 136.
doi: 10.3321/j.issn:1001-7488.2005.03.022 |
|
| 吴一戎. 多维度合成孔径雷达成像概念. 雷达学报, 2013, 2 (2): 135- 142. | |
| Wu Y R . Concept of multidimensional space joint-observation SAR. Journal of Radars, 2013, 2 (2): 135- 142. | |
| 徐伟义, 金晓斌, 杨绪红, 等. 中国森林植被生物量空间网格化估计. 自然资源学报, 2018, 33 (10): 1725- 1741. | |
| Xu W Y , Jin X B , Yang X H , et al. The estimation of forest vegetation biomass in China in spatial grid. Journal of Natural Resources, 2018, 33 (10): 1725- 1741. | |
|
Asner G P . Cloud cover in Landsat observations of the Brazilian Amazon. International Journal of Remote Sensing, 2001, 22 (18): 3855- 3862.
doi: 10.1080/01431160010006926 |
|
|
Astola H , Häme T , Sirro L , et al. Comparison of Sentinel-2 and Landsat 8 imagery for forest variable prediction in boreal region. Remote Sensing of Environment, 2019, 223, 257- 273.
doi: 10.1016/j.rse.2019.01.019 |
|
| Chen G , Hay G J , Zhou Y L . Estimation of forest height, biomass and volume using support vector regression and segmentation from LiDAR transects and Quickbird imagery. 2010 18th International Conference on Geoinformatics, 2010, 1- 4. | |
|
Chi H , Sun G Q , Huang J L , et al. National forest aboveground biomass mapping from ICESat/GLAS Data and MODIS imagery in China. Remote Sensing, 2015, 7, 5534- 5564.
doi: 10.3390/rs70505534 |
|
|
Foody G M , Boyd D S , Cutler M E J . Predictive relations of tropical forest biomass from Landsat TM data and their transferability between regions. Remote Sensing of Environment, 2003, 85 (4): 463- 474.
doi: 10.1016/S0034-4257(03)00039-7 |
|
| Güner Ş T , Çömez A , Özkan K . Predicting soil and forest floor carbon stocks in Western Anatolian Scots pine stands, Turkey. African Journal of Agricultural Research, 2012, 7 (28): 4075- 4083. | |
|
Hu T Y , Su Y J , Xue B L , et al. Mapping global forest aboveground biomass with spaceborne LiDAR, optical imagery, and forest inventory data. Remote Sensing, 2016, 8 (7): 565.
doi: 10.3390/rs8070565 |
|
|
Hu Y , Xu X L , Wu F Y , et al. Estimating forest stock volume in Hunan Province, China, by integrating in situ plot data, Sentinel-2 images, and linear and machine learning regression models. Remote Sensing, 2020, 12 (1): 186.
doi: 10.3390/rs12010186 |
|
|
Kramer P J . Carbon dioxide concentration, photosynthesis, and dry matter production. BioScience, 1981, 31 (1): 29- 33.
doi: 10.2307/1308175 |
|
|
Li C , Li M Y , Liu J , et al. Comparative analysis of seasonal Landsat 8 images for forest aboveground biomass estimation in a subtropical forest. Forests, 2019b, 11 (1): 45.
doi: 10.3390/f11010045 |
|
|
Li C , Li Y C , Li M Y . Improving forest aboveground biomass (AGB) estimation by incorporating crown density and using Landsat 8 OLI images of a subtropical forest in western Hunan in central China. Forests, 2019a, 10 (2): 104.
doi: 10.3390/f10020104 |
|
| Li X J , Du H Q , Mao F J , et al. Estimating bamboo forest aboveground biomass using EnKF-assimilated MODIS LAI spatiotemporal data and machine learning algorithms. Agricultural and Forest Meteorology, 2018, 256, 445- 457. | |
| Olson J S, Watts J A, Allison L J. 1983. Carbon in live vegetation of major world ecosystems. Oak Ridge National Laboratory for the Office of Health and Environmental Research, U. S. Dept. of Energy. | |
| Qi W L , Saarela S , Armston J , et al. Forest biomass estimation over three distinct forest types using TanDEM-X InSAR data and simulated GEDI LiDAR data. Remote Sensing of Environment, 2019, 232, 111283. | |
| Santoro M , Cartus O , Mermoz S , et al. A detailed portrait of the forest aboveground biomass pool for the year 2010 obtained from multiple remote sensing observations. EGUGA, 2018, 18932. | |
| Schlamadinger B , Bird N , Johns T , et al. A synopsis of land use, land-use change and forestry (LULUCF) under the Kyoto Protocol and Marrakech Accords. Environmental Science & Policy, 2007, 10 (4): 271- 282. | |
| Shimada M , Itoh T , Motooka T , et al. New global forest/non-forest maps from ALOS PALSAR data (2007—2010). Remote Sensing of Environment, 2014, 155, 13- 31. | |
| Su Y J , Guo Q H , Xue B L , et al. Spatial distribution of forest aboveground biomass in China: estimation through combination of spaceborne LiDAR, optical imagery, and forest inventory data. Remote Sensing of Environment, 2016, 173, 187- 199. | |
| Wittke S , Yu X , Karjalainen M , et al. Comparison of two-dimensional multitemporal Sentinel-2 data with three-dimensional remote sensing data sources for forest inventory parameter estimation over a boreal forest. International Journal of Applied Earth Observation and Geoinformation, 2019, 76, 167- 178. | |
| Woodwell G , Whittaker R , Reiners W , et al. The biota and the world carbon budget. Science, 1978, 199 (4325): 141- 146. | |
| Xia H , Zhao W , Li A , et al. Subpixel inundation mapping using landsat-8 OLI and UAV data for a wetland region on the Zoige Plateau, China. Remote Sensing, 2017, 9 (1): 31. |
| [1] | Jiaqi You,Mingze Li,Wenyi Fan,Ying Quan,Bin Wang,Zhukun Mo,Zixiao Zhu. Stand Type Identification Based on Hyperspectral and LiDAR Data [J]. Scientia Silvae Sinicae, 2021, 57(5): 119-129. |
| [2] | Ying Pan,Mingming Ding,Jie Lin,Qiao Dai,Geng Guo,Linlin Cui. Inversion of Forest Leaf Area Index Based on PROSAIL Model and Multi-Angle Remote Sensing Data [J]. Scientia Silvae Sinicae, 2021, 57(4): 90-106. |
| Viewed | ||||||
|
Full text |
|
|||||
|
Abstract |
|
|||||