
Scientia Silvae Sinicae ›› 2020, Vol. 56 ›› Issue (6): 142-151.doi: 10.11707/j.1001-7488.20200614
• Discussion • Previous Articles Next Articles
Bin Zhang,Jiehua Lü*
Received:2019-05-17
Online:2020-06-25
Published:2020-07-17
Contact:
Jiehua Lü
CLC Number:
Bin Zhang,Jiehua Lü. Spatial Effects Analysis for Factor Inputs Driving, Industrial Structure Upgrading and Forestry Economic Growth: A Case Study of Heilongjiang Key State-Owned Forest Region[J]. Scientia Silvae Sinicae, 2020, 56(6): 142-151.
Table 1
Descriptive statistical results of variables"
| 变量Variables | 样本量Samples | 极小值Min. | 极大值Max. | 均值Mean | 标准差SD |
| 林业总产值Forestry gross output / 104yuan | 600 | 13 437.00 | 180 618.12 | 61 840.83 | 33 316.44 |
| 劳动力Labor / person | 600 | 1 381.00 | 14 842.00 | 5 282.59 | 1 959.43 |
| 林业投资Forest investment / 104yuan | 600 | 2 671.49 | 68 680.23 | 13 905.42 | 10 274.82 |
| 森林管护面积Forest management area / hm2 | 600 | 70 597.00 | 751 283.00 | 226 426.55 | 119 985.06 |
| 产业结构升级Industrial structure upgrading | 600 | 1.31 | 2.00 | 1.77 | 0.16 |
Fig.1
Global auto-correlation Moran scatter distribution of forestry gross output growth rate(ΔY/Y) in 2017 Fig.(b) is the Moran scatter distribution map which is redrawn after eliminating 3 outliers in Fig.(a). "
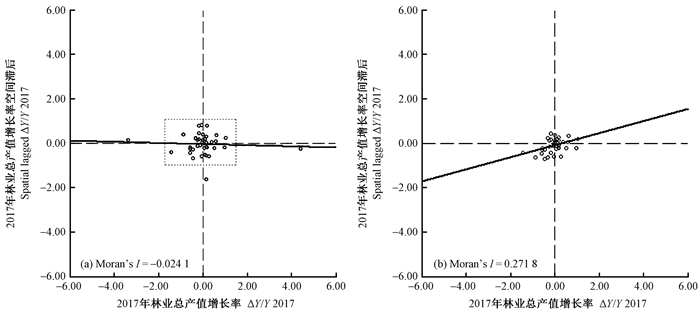
Table 2
Global auto-correlation and cross-correlation Moran indexes (Adjusted)"
| 年份Year | 自关联Auto-correlation | 交叉关联Cross-correlation | ||||
| ΔY/Y-ΔY/Y | ΔY/Y-ΔL/L | ΔY/Y-ΔK/K | ΔY/Y-lnF | ΔY/Y-ISU | ||
| 2004 | -0.144 1** | -0.120 4* | 0.136 7** | 0.109 2** | 0.150 3*** | |
| 2005 | 0.002 6* | -0.112 1** | 0.072 5** | 0.168 6*** | 0.134 4*** | |
| 2006 | 0.164 9*** | 0.146 8* | 0.235 7*** | -0.056 4*** | -0.079 0 | |
| 2007 | 0.230 0*** | -0.123 8** | 0.226 2*** | -0.122 7** | 0.081 2* | |
| 2008 | 0.210 2** | -0.353 4*** | 0.138 6*** | -0.090 0 | 0.084 6 | |
| 2009 | 0.319 2*** | 0.171 7** | 0.302 4*** | -0.201 5** | 0.070 5 | |
| 2010 | 0.145 0** | -0.177 7*** | 0.234 1*** | 0.122 3** | 0.120 2** | |
| 2011 | 0.224 7*** | -0.176 2*** | 0.260 4*** | 0.306 1*** | 0.420 3*** | |
| 2012 | 0.264 9*** | -0.201 3*** | 0.203 3*** | -0.069 1* | 0.299 3** | |
| 2013 | 0.182 1*** | -0.508 5*** | 0.162 5*** | 0.148 5* | 0.327 3*** | |
| 2014 | 0.245 1** | -0.111 3** | 0.323 9*** | 0.194 7** | 0.329 0*** | |
| 2015 | 0.268 4*** | 0.095 3* | 0.323 6*** | 0.126 7** | 0.196 1*** | |
| 2016 | 0.351 8*** | -0.251 1*** | 0.088 7** | 0.080 8** | 0.139 5** | |
| 2017 | 0.271 8*** | -0.540 1*** | 0.241 5*** | 0.309 6*** | 0.093 7*** | |
| 均值Mean | 0.195 7 | -0.161 6 | 0.210 7 | 0.073 3 | 0.169 1 | |
Table 3
Local Moran indexes and classifications"
| 林业局Bureaus | ΔY/Y-ΔY/Y | ΔY/Y-ΔL/L | ΔY/Y-ΔK/K | ΔY/Y-lnF | ΔY/Y-ISU |
| 大海林Dahailin | -0.053 3d | -0.086 4d | 0.075 0a | 0.015 7 | -0.008 8 |
| 柴河Chaihe | -0.075 1c | 0.088 8b | -0.041 3c | -0.014 1 | 0.044 2b |
| 东京城Dongjingcheng | 0.020 3 | -0.377 9d | -0.000 4d | 0.164 8a | 0.031 7 |
| 穆棱Muling | 0.002 8a | 0.002 6 | 0.016 9a | 0.006 0a | 0.000 8 |
| 绥阳Suiyang | 0.045 0 | -0.454 1d | 0.688 5a | -0.086 9 | 0.304 0a |
| 海林Hailin | -0.000 5 | 0.019 4b | 0.008 1b | -0.012 5c | 0.006 0b |
| 林口Linkou | 0.232 6a | -0.995 9d | -0.147 5 | 0.404 3a | -0.516 8d |
| 八面通Bamiantong | 0.043 5a | -0.094 7d | 0.025 1a | 0.166 9a | -0.055 7d |
| 桦南Huanan | 0.001 0 | -0.007 1d | -0.004 3d | -0.006 7d | 0.005 7a |
| 双鸭山Shuangyashan | 0.001 0 | 0.288 3a | -0.086 1d | 0.020 9 | 0.085 4a |
| 鹤立Heli | -0.160 2d | 0.156 7 | -0.007 4 | 0.148 5 | -0.165 5d |
| 鹤北Hebei | 0.030 6b | -0.036 7c | 0.023 1b | -0.003 2 | 0.078 9b |
| 东方红Dongfanghong | -0.028 0c | 0.018 8 | 0.064 3 | 0.114 4 | -0.130 1c |
| 迎春Yingchun | -0.028 0 | -0.119 2d | 0.035 8a | 0.184 4a | 0.082 8 |
| 清河Qinghe | -0.034 1 | 0.071 1b | 0.007 8 | -0.163 6c | -0.055 4 |
| 双丰Shuangfeng | -0.073 5c | -0.091 8 | -0.007 0 | 0.011 6 | -0.102 0 |
| 铁力Tieli | -1.103 4d | 1.601 2a | -1.513 1d | -3.982 6d | 1.195 0a |
| 桃山Taoshan | -0.046 6c | -0.020 5c | 0.009 3 | 0.022 7b | 0.038 0b |
| 朗乡Langxiang | 0.034 7b | 0.005 0 | 0.005 1 | 0.101 0b | -0.016 2 |
| 南岔Nancha | 0.254 7b | -0.071 5 | 0.215 5b | 0.455 0b | 0.381 6b |
| 金山屯Jinshantun | 0.312 0b | -0.008 9 | 0.149 0b | -0.282 8c | 0.249 2b |
| 美溪Meixi | 0.582 7b | -0.583 8c | 0.332 5b | 0.386 2b | 0.500 0b |
| 乌马河Wumahe | -0.338 4c | -0.758 4c | 0.330 5b | 0.372 8b | 0.036 4 |
| 翠峦Cuiluan | -0.133 3c | -0.132 0c | 0.046 4b | 0.041 3b | -0.083 4c |
| 友好Youhao | 0.151 3b | -0.241 4c | 0.046 1 | 0.129 8b | -0.150 7c |
| 上甘岭Shangganling | 0.011 3 | -0.098 0c | 0.008 5 | -0.048 5c | -0.047 7c |
| 五营Wuying | 0.130 1b | -0.364 7c | 0.115 5 | 0.006 6 | 0.095 4b |
| 红星Hongxing | 0.109 3b | -0.416 3c | -0.125 5c | -0.112 4 | -0.139 7c |
| 新青Xinqing | -0.014 5d | 0.006 7 | 0.002 0 | -0.000 5 | 0.004 0 |
| 汤旺河Tangwanghe | -0.196 5d | 0.658 6a | -0.003 9 | -0.238 3d | 0.130 7 |
| 乌伊岭Wuyiling | 0.019 3a | 0.047 2a | -0.085 8d | -0.002 3 | 0.010 7 |
| 山河屯Shanhetun | -0.250 8d | -0.258 0d | -0.057 5 | 0.015 1 | -0.010 7 |
| 苇河Weihe | -0.449 9c | 1.750 9b | 1.803 5b | -1.119 4c | -0.653 3 |
| 亚布力Yabuli | -0.084 6d | -0.181 4d | 0.015 4 | 0.007 8 | -0.071 2d |
| 方正Fangzheng | 0.208 8a | -0.541 5d | -0.065 9 | 0.425 7a | -0.152 7d |
| 兴隆Xinglong | -0.113 4d | -0.118 4d | 0.013 2 | -0.321 2d | -0.375 0d |
| 绥棱Suiling | 0.139 3a | 0.154 3a | -0.054 5d | 0.109 1a | 0.100 6a |
| 通北Tongbei | 0.014 1a | 0.021 2 | -0.031 8d | 0.108 3a | 0.033 8a |
| 沾河Zhanhe | -0.036 7d | 0.129 2a | -0.056 3d | 0.010 1 | 0.060 5a |
| 带岭Dailing | -0.065 4c | -0.160 9c | 0.003 6 | 0.070 9b | 0.024 7 |
| 正Positive | 20 | 16 | 24 | 25 | 23 |
| 负Negative | 20 | 24 | 16 | 15 | 17 |
| a | 7 | 6 | 5 | 8 | 7 |
| b | 8 | 4 | 8 | 8 | 8 |
| c | 8 | 10 | 2 | 5 | 5 |
| d | 9 | 11 | 8 | 4 | 6 |
Table 4
Panel regression results of forestry economic growth"
| 变量Variables | 普通面板回归模型OLS | 空间自回归模型SAR | 空间误差模型SEM | 空间杜宾模型SDM | |||||||||||
| 混合Mixed | 固定Fixed | 随机Random | 混合Mixed | 固定Fixed | 随机Random | 混合Mixed | 固定Fixed | 随机Random | 混合Mixed | 固定Fixed | 随机Random | ||||
| Constant | 3.905 8***(5.936 3) | -2.595 5 (-1.337 3) | 3.351 6***(3.090 8) | 1.104 6 (1.555 5) | -1.751 5 (-1.176 4) | — | 4.843 6***(8.344 4) | 4.473 0***(2.970 5) | — | 6.113 0***(4.656 6) | -5.793 6**(-2.086 2) | — | |||
| lnL | 0.171 9***(3.226 3) | -0.301 3***(-5.427 5) | -0.247 7***(-4.787 7) | 0.212 8***(4.303 4) | -0.137 6***(-3.202 7) | -0.335 4***(-5.900 0) | 0.227 2***(4.375 7) | -0.078 6*(-1.658 2) | -0.007 0(-0.156 8) | 0.225 3***(4.394 8) | -0.051 4(-1.147 4) | -0.119 7**(-2.181 0) | |||
| lnK | 0.431 0***(15.172 8) | 0.251 3***(14.673 0) | 0.267 6***(15.766 1) | 0.335 8***(11.398 2) | 0.118 8***(8.121 6) | 0.317 4***(14.814 2) | 0.423 5***(12.381 5) | 0.153 2***(7.073 9) | 0.166 7***(7.673 8) | 0.272 3***(6.650 0) | 0.075 4***(3.414 7) | 0.112 1***(3.983 6) | |||
| lnF | 0.043 1 (1.081 6) | 0.954 1***(6.344 7) | 0.413 1***(5.130 7) | 0.073 7**(1.973 1) | 0.488 6***(4.210 2) | 0.878 9***(16.059 1) | 0.021 5(0.578 2) | 0.338 1***(2.830 2) | 0.645 8***(16.853 6) | 0.001 1(0.028 7) | 0.385 3***(3.295 3) | 0.439 6***(4.443 6) | |||
| ISU | 0.556 6***(4.480 6) | 1.161 2***(13.839 2) | 1.192 2***(14.560 9) | 0.240 7**(2.082 3) | 0.529 1***(7.328 2) | 1.486 5***(13.946 2) | -0.059 9(-0.429 9) | 0.760 6***(7.131 9) | 0.805 0***(7.694 1) | -0.614 6***(-4.096 8) | 0.287 5***(2.582 1) | 0.283 4**(2.008 4) | |||
| W*lnY | 0.322 0***(8.562 8) | 0.530 0***(18.328 4) | -0.236 1***(-5.983 1) | 0.343 0***(8.658 7) | 0.431 0***(11.973 1) | -0.236 1***(-5.044 3) | |||||||||
| spat.aut. | 0.424 0***(11.384 1) | 0.630 0***(23.056 7) | 0.620 4***(21.808 2) | ||||||||||||
| teta | 0.124 3***(6.366 7) | 4.722 5***(4.693 3) | 0.113 8***(6.359 9) | ||||||||||||
| W*lnL | -0.270 7***(-3.757 5) | -0.296 0***(-4.386 0) | -0.586 8***(-7.509 8) | ||||||||||||
| W*lnK | -0.020 7(-0.429 4) | 0.066 7***(2.623 0) | 0.212 2***(6.548 7) | ||||||||||||
| W*lnF | -0.163 7**(-2.428 1) | 0.650 0***(3.490 2) | 0.711 4***(6.291 6) | ||||||||||||
| W*ISU | 1.229 4***(6.827 3) | 0.218 6*(1.671 7) | 1.074 2***(6.570 4) | ||||||||||||
| R2 | 0.402 9 | 0.834 5 | 0.657 2 | 0.482 7 | 0.902 0 | 0.764 9 | 0.360 4 | 0.759 7 | 0.876 4 | 0.571 3 | 0.905 8 | 0.835 7 | |||
| Hausman test | 76.031 2*** | 834.740 9*** | 8.544 8 | 536.686 9*** | |||||||||||
| log likelihood | -326.796 4 | 58.084 4 | — | -296.353 3 | 176.993 3 | -47.214 8 | -291.492 0 | 113.945 5 | 13.223 9 | -241.672 8 | 202.487 9 | 60.316 7 | |||
| LM-SAR | 14.868 0*** | 23.595 5*** | 90.688 6*** | 1 259.643 9*** | 602.937 1*** | 1 178.770 4*** | |||||||||
| LM-SEM | 2.695 3 | 5.361 9** | 123.560 3*** | 127.674 1*** | 362.618 9*** | 0.274 5 | |||||||||
| R-LM-SAR | 38.432 0*** | 52.673 6*** | 24.570 4*** | 3 917.972 5*** | 240.461 6*** | 1 463.112 0*** | |||||||||
| R-LM-SEM | 26.259 3*** | 34.440 0*** | 57.442 0*** | 2 786.002 7*** | 0.143 3 | 284.616 0*** | |||||||||
| LR-SAR | 0.566 8 | 1.341 6 | -284.597 3 | ||||||||||||
| LR-SEM | 6.414 5 | 30.328 2*** | -255.442 3 | ||||||||||||
| Wald-SAR | 51.176 2*** | 50.860 2*** | 193.647 6*** | ||||||||||||
| Wald-SEM | 46.529 4*** | 141.874 5*** | 143.734 8*** | ||||||||||||
Table 5
Decomposition of marginal effects in spatial Durbin model"
| 指标Indices | 本地效应Local effects | 溢出效应Spillover effects | 总效应Total effects |
| lnL | -0.112 4**(-2.419 5) | -0.500 5***(-4.828 1) | -0.612 9***(-4.908 7) |
| lnK | 0.094 7***(4.574 3) | 0.154 1***(5.509 7) | 0.248 8***(9.757 7) |
| lnF | 0.540 2***(4.299 9) | 1.282 4***(4.419 9) | 1.822 6***(5.053 9) |
| ISU | 0.346 2***(3.302 0) | 0.541 7***(3.652 8) | 0.887 9***(6.500 1) |
|
才琪, 陈绍志, 赵荣. 中央林业投资与林业经济增长的互动关系. 林业科学, 2015. 519, 126- 133.
doi: 10.3969/j.issn.1006-1126.2015.02.007 |
|
|
Cai Q , Chen S Z , Zhao R . Interaction relationship between central forestry investment and forestry economic growth in China. Scientia Silvae Sinicae, 2015. 519, 126- 133.
doi: 10.3969/j.issn.1006-1126.2015.02.007 |
|
| 曹玉昆, 黄显乔, 朱震锋. 基于偏离-份额法的国有林区产业结构分析. 林业经济问题, 2018. 382, 1- 6, 98. | |
| Cao Y K , Huang X Q , Zhu Z F . Analysis of industrial structure in SFR based on the shift share method. Issues of Forestry Economics, 2018. 382, 1- 6, 98. | |
| 程鹏飞, 李婕, 张红丽, 等. 林业产业集聚、林业经济增长及其空间溢出效应——基于2004-2015年省际面板数据的空间计量分析. 安徽农业大学学报, 2018. 456, 1063- 1070. | |
| Cheng P F , Li J , Zhang H L , et al. Forest industry agglomeration, forest economic growth and its space spillover effect——Based on the spatial analysis of the marginal panel data from 2004 to 2015. Journal of Anhui Agricultural University, 2018. 456, 1063- 1070. | |
| 胡晨沛. 中国省域林业生产要素产出弹性测度——基于空间计量经济模型的实证研究. 林业经济问题, 2017. 374, 74- 78, 109. | |
| Hu C P . Measuring output elasticity of China's provincial forestry production factors:an empirical study based on spatial econometric model. Issues of Forestry Economics, 2017. 374, 74- 78, 109. | |
| 孔凡斌, 廖文梅. 中国林业市场化进程的林业经济增长效应. 中国农村经济, 2013. 299, 87- 96. | |
| Kong F B , Liao W M . The economic growth effect of forestry in the process of forestry marketization in China. Chinese Rural Economy, 2013. 299, 87- 96. | |
| 李研, 张大红. 要素投入对林业经济增长影响的实证分析. 统计与决策, 2018. 3415, 133- 135. | |
| Li Y , Zhang D H . Empirical analysis of the impact of factors input on forestry economic growth. Statistics & Decision, 2018. 3415, 133- 135. | |
| 刘铁铎, 张越杰. 东北三省林业产业经济增长与结构优化研究. 社会科学战线, 2018. 416, 256- 260. | |
| Liu T D , Zhang Y J . Study on economic growth and structural optimization of forestry industry in northeast China. Social Science Front, 2018. 416, 256- 260. | |
| 罗小锋, 王泽均, 李兆亮, 等. 林业产业结构变动及其经济贡献的比较分析. 统计与决策, 2017. 3314, 93- 97. | |
| Luo X F , Wang Z J , Li Z L , et al. A comparative analysis of forestry industrial structure changes and its economic contribution. Statistics & Decision, 2017. 3314, 93- 97. | |
| 潘启英, 杨卫东. 基于2000-2014年数据的黑龙江省森工林区林业经济增长实证研究. 中国林业经济, 2018. 256, 9- 11, 18. | |
| Pan Q Y , Yang W D . Empirical study on forestry economic growth of forest industry region in Heilongjiang province based on data from 2000 to 2014. China Forestry Economics, 2018. 256, 9- 11, 18. | |
| 谭益民, 张双全. 森林旅游业与经济增长的关系研究. 中南林业科技大学学报, 2012. 3211, 136- 138. | |
| Tan Y M , Zhang S Q . Studies on correlation between forest tourism and economic growth. Journal of Central South University of Forestry & Technology, 2012. 3211, 136- 138. | |
| 汪浩. 林业产业集聚与经济增长的关系研究. 统计与决策, 2011. 273, 140- 141. | |
| Wang H . Study on the relationship between forestry industry agglomeration and economic growth. Statistics & Decision, 2011. 273, 140- 141. | |
| 魏素豪, 宗刚. 我国林业产业集聚的空间计量分析. 统计与决策, 2017. 338, 130- 133. | |
| Wei S H , Zong G . Spatial econometric analysis of forestry industry agglomeration in China. Statistics & Decision, 2017. 338, 130- 133. | |
|
魏肖杰, 张敏新. 中国林业产业集聚影响因素作用机制的实证研究——基于空间杜宾模型. 资源开发与市场, 2018. 3412, 1731- 1737.
doi: 10.3969/j.issn.1005-8141.2018.12.016 |
|
|
Wei X J , Zhang M X . Empirical study on mechanism of factors influencing Chinese forestry industrial agglomeration——Based on spatial Durbin model SDM. Resource Development & Market, 2018. 3412, 1731- 1737.
doi: 10.3969/j.issn.1005-8141.2018.12.016 |
|
| 徐德云. 产业结构升级形态决定、测度的一个理论解释及验证. 财政研究, 2008. 291, 46- 49. | |
| Xu D Y . A theoretical explanation and verification of industrial structure upgrading form decision and measurement. Public Finance Research, 2008. 291, 46- 49. | |
| 赵晓光, 田博林. 黑龙江省国有林区经济差异的空间统计分析. 林业经济问题, 2016. 363, 203- 208. | |
| Zhao X G , Tian B L . Exploratory spatial data analysis of the forestry regional economic disparities in the reemployment of Heilongjiang province. Issues of Forestry Economics, 2016. 363, 203- 208. | |
| 赵晓光, 赵佳欢. 黑龙江省国有重点林区林业经济发展影响因素的空间面板实证分析. 浙江林业科技, 2017. 375, 54- 60. | |
| Zhao X G , Zhao J H . Spatial panel analysis on factors influencing forestry economic development in key state-owned forested areas in Heilongjiang province. Journal of Zhejiang Forestry Science and Technology, 2017. 375, 54- 60. | |
|
钟艳, 李湘玲, 史常亮. 东北地区林业产业结构变动对林业经济增长的贡献. 资源开发与市场, 2011. 2711, 1006- 1009.
doi: 10.3969/j.issn.1005-8141.2011.11.014 |
|
|
Zhong Y , Li X L , Shi C L . Contribution of change in forestry industrial structure to economic growth in northeast China. Resource Development & Market, 2011. 2711, 1006- 1009.
doi: 10.3969/j.issn.1005-8141.2011.11.014 |
|
| Anselin L . Local indicators of spatial association-LISA. Geographical Analysis, 1995. 272, 93- 115. | |
| Elhorst J P . Spatial econometrics from cross-sectional data to spatial panels. New York: Springer. 2014. | |
| Karlsson M , Wolf A . Using an optimization model to evaluate the economic benefits of industrial symbiosis in the forest industry. Journal of Cleaner Production, 2008. 1614, 1536- 1544. | |
| Kies U , Klein D , Schulte A . Germany's forest cluster:exploratory spatial data analysis of regional agglomerations and structural change in wood-based employment. Ultramicroscopy, 2010. 601, 137- 152. | |
| Klein D , Kies U , Schulte A . Regional employment trends of wood-based industries in Germany's forest cluster:a comparative shift-share analysis of post-reunification development. European Journal of Forest Research, 2009. 1283, 205- 219. | |
| LeSage J P , Pace R K . Introduction to spatial econometrics. Boca Raton: CRC Press. 2009. | |
|
Moran P A P . Notes on continuous stochastic phenomena. Biometrika, 1950. 37, 17- 23.
doi: 10.1093/biomet/37.1-2.17 |
|
| Sandberg D , Vasiri M , Trischler J , et al. The role of the wood mechanical industry in the Swedish forest industry cluster. Scandinavian Journal of Forest Research, 2014. 294, 352- 359. |
| [1] | Liao Wenmei. Analysis on the Industrial Structure Evolutions and Its Differences of the Forest Economic Growth from 1995 to 2011 of 13 Provinces (Autonomous Regions) in the Southern Collective Forest Region of China [J]. Scientia Silvae Sinicae, 2014, 50(8): 131-140. |
| Viewed | ||||||
|
Full text |
|
|||||
|
Abstract |
|
|||||