
林业科学 ›› 2025, Vol. 61 ›› Issue (3): 86-99.doi: 10.11707/j.1001-7488.LYKX20240355
杨甫禹,张弥*( ),肖薇,石婕
收稿日期:2024-06-11
出版日期:2025-03-25
发布日期:2025-03-27
通讯作者:
张弥
E-mail:zhangm.80@nuist.edu.cn
基金资助:
Fuyu Yang,Mi Zhang*(),Wei Xiao,Jie Shi
Received:2024-06-11
Online:2025-03-25
Published:2025-03-27
Contact:
Mi Zhang
E-mail:zhangm.80@nuist.edu.cn
摘要:
目的: 分析植被光合作用模型(VPM)中关键参数最大光能利用率(ε0 )在不同气候区森林生态系统是否存在差异及其主要原因,并选择出具有普遍适用性的最大光能利用率参数化方案,以期深化对森林生态系统植被生产力估算过程中不确定性的认知,为提高模型模拟精度与降低模型参数不确定性提供参考。方法: 利用4种参数化方案——BPLUT查表法、Michealis-Menten光响应曲线方程拟合、生长季增强型植被指数最大值(EVImax)指数拟合以及Mointeith方程推导法对VPM中的最大光能利用率(ε0 )进行估算,基于4种参数化方案的估算结果对中国地区4个森林生态系统总初级生产力(GPP)进行模拟,与涡度相关观测到的总初级生产力(GPP)进行比较并结合各项模型评价指标(决定系数R2、均方根误差RMSE、一致性系数d及平均相对误差MRE)对VPM模拟结果进行评估。结果: 长白山、千烟洲、鼎湖山与西双版纳站点的ε0值分别为:(0.65±0.14)、(0.47±0.10)、(0.44±0.09)和(0.69±0.12) g·mol ?1。在季节尺度上,利用各站点最优参数化方案模拟的GPP与观测GPP相比,其均方根误差(RMSE)较最不适用的参数化方案在长白山、千烟洲、鼎湖山和西双版纳分别降低了55.1%、38.1%、48.6%和34.3%;在年际尺度上,各站点最优参数化方案模拟GPP的平均相对误差(MRE)在长白山、千烟洲、鼎湖山和西双版纳分别为?7.9%、?24.3%、?7.4%和?3.0%,小于最不适用的参数化方案模拟的结果(长白山:35.8%;千烟洲:?53.4%;鼎湖山:29.8%;西双版纳:25.4%)。结论: 不同参数化方案在同一个站点的ε0 值差异较大,且相同参数化方案下,不同站点间的ε0 值存在差异,造成这种差异的主要原因与各参数化方案本身的结构属性及不同区域水热条件差异有关。Mointeith方程推导法为长白山、千烟洲与鼎湖山地区ε0最优的参数化方案;生长季增强型植被指数最大值(EVImax)指数拟合的参数化方案在西双版纳地区最适用。
中图分类号:
杨甫禹,张弥,肖薇,石婕. VPM模型最大光能利用效率参数优化对不同森林生态系统GPP模拟的影响[J]. 林业科学, 2025, 61(3): 86-99.
Fuyu Yang,Mi Zhang,Wei Xiao,Jie Shi. Impacts of Optimizing Maximum Light Use Efficiency Parameter in VPM on GPP Simulation in Different Forest Ecosystems[J]. Scientia Silvae Sinicae, 2025, 61(3): 86-99.
表1
4个森林生态系统通量站点的基本信息"
| 项目Item | 长白山 Changbaishan | 千烟洲 Qianyanzhou | 鼎湖山 Dinghushan | 西双版纳 Xishuangbanna |
| 经纬度 Longitude and latitude | 128°28′E, 42°24′N | 115°03′E, 26°44′N | 112°30′E, 23°09′N | 101°15′E, 21°55′N |
| 海拔Elevation/m | 784 | 102 | 280 | 730 |
| 植被类型 Vegetation type | 落叶针阔混交林 Deciduous mixed coniferous-broad forests | 人工常绿针叶林 Planted evergreen coniferous forest | 常绿阔叶林 Evergreen broad-leaved forests | 季节性雨林 Seasonal rainforests |
| 优势种 Dominant species | 红松 Pinus koraiensis | 马尾松 Pinus massoniana | 木荷、厚壳桂 Schima superba、Cryptocarya chinensis | 番龙眼、千果榄仁 Pometia pinnata、Terminalia myriocarpa |
| 最大叶面积指数Maximum leaf area index | 6.1 | 3.6 | 4.0 | 6.0 |
| 林冠高度 Forest canopy height/m | 26 | 12 | 17 | 36 |
| 林龄 Forest age/a | 200 | 35 | 400 | 200 |
| 年均气温 Mean annual temperature/℃ | 3.8 | 18.3 | 22.3 | 22.5 |
| 年降水量 Mean annual precipitation/mm | 744.6 | 1 380.1 | 1 888.9 | 1 427.5 |
| 空气相对湿度 Air relative humidity(%) | 68.5 | 83.4 | 76.8 | 82.9 |
| 来源 Source |
表2
各站点VPM模型的Tmin、Tmax、Topt及LSWImax值"
| 站点 Sites | 参数Parameter | 参数Parameter | |||||
| 光合最低温度 Minimum photosynthetic temperature/℃ | 光合最高温度 Optimum photosynthetic temperature/℃ | 光合最适温度 Maximum photosynthetic temperature/℃ | 来源 Source | 生长季最大地表 水分指数 The maximum land surface water index of the growing season | 来源 Source | ||
| 长白山 Changbaishan | 0 | 35 | 20 | 0.37 | 本研究 This study | ||
| 千烟洲 Qianyanzhou | 0 | 40 | 20 | 0.34 | 本研究 This study | ||
| 鼎湖山 Dinghushan | 2 | 48 | 28 | 0.32 | 本研究 This study | ||
| 西双版纳 Xishuangbanna | 2 | 48 | 28 | 0.31 | 本研究 This study | ||
表3
各站点光响应曲线方程拟合参数值"
| 站点Sites | 年份Year | 最大光能利用率 Maximum light use efficiency/ (g·mol?1) | 最大生态系统碳总交换速率 Maximum gross ecosystem carbon exchange rate/ (g·m?2s?1) | 生态系统呼吸速率 Ecosystem respiration rate/ (g·m?2s?1) | R2 |
| 长白山 Changbaishan | 2007 | 0.92±0.02 | 0.33 | 9.27E?02 | 0.79 |
| 2008 | 0.71±0.02 | 0.35 | 1.09E?01 | 0.80 | |
| 2009 | 0.91±0.02 | 0.33 | 8.73E?02 | 0.78 | |
| 2010 | 0.78±0.03 | 0.30 | 8.45E?02 | 0.70 | |
| 千烟洲 Qianyanzhou | 2007 | 0.34±0.01 | 0.31 | 7.64E?02 | 0.78 |
| 2008 | 0.32±0.02 | 0.32 | 8.73E?02 | 0.78 | |
| 2009 | 0.33±0.01 | 0.31 | 7.64E?02 | 0.77 | |
| 2010 | 0.36±0.01 | 0.34 | 8.18E?02 | 0.80 | |
| 鼎湖山 Dinghushan | 2007 | 0.35±0.04 | 0.36 | 6.00E?02 | 0.81 |
| 2008 | 0.33±0.06 | 0.27 | 3.55E?02 | 0.61 | |
| 2009 | 0.33±0.01 | 0.18 | 4.09E?02 | 0.52 | |
| 2010 | 0.33±0.02 | 0.12 | 5.18E?02 | 0.66 | |
| 西双版纳 Xishuangbanna | 2007 | 0.66±0.03 | 0.25 | 8.18E?02 | 0.28 |
| 2008 | 0.77±0.04 | 0.24 | 7.91E?02 | 0.35 | |
| 2009 | 0.51±0.03 | 0.25 | 8.45E?02 | 0.38 | |
| 2010 | 0.85±0.04 | 0.25 | 7.64E?02 | 0.31 |
表4
文献调研站点相关信息"
| 站点所在地 Sites Location | 森林类型 Forest type | 研究时段 Start-stop year | 最大光能利用率 Maximum light use efficiency /(g·mol?1) | 生长季增强型植被 指数最大值 Maxmium enhanced vegetation index of the growing season | 来源 Source |
| 中国 China | 常绿针叶林Evergreen needleleaf forest | 2008 | 0.57 | 0.46 | |
| 中国 China | 落叶阔叶林 Deciduous broad-leaved forest | 2008 | 0.40 | 0.52 | |
| 中国 China | 落叶阔叶林 Deciduous broad-leaved forest | 2008 | 0.65 | 0.52 | |
| 中国 China | 混交林 Mixed forest | 2003—2005 | 0.73 | 0.62 | |
| 中国 China | 常绿阔叶林 Evergreen broad-leaved forest | 2003 | 0.36 | 0.49 | |
| 中国 China | 常绿针叶林Evergreen needleleaf forest | 2003 | 0.38 | 0.53 | |
| 中国 China | 常绿阔叶林 Evergreen broad-leaved forest | 2003 | 0.70 | 0.58 | |
| 美国America | 落叶阔叶林 Deciduous broad-leaved forest | 2003—2006 | 0.53 | 0.70 | |
| 美国America | 常绿针叶林Evergreen needleleaf forest | 1998—2002 | 0.48 | 0.56 | |
| 巴西 Brazil | 常绿阔叶林 Evergreen broad-leaved forest | 2001—2003 | 0.54 | 0.68 | |
| 美国America | 落叶阔叶林 Deciduous broad-leaved forest | 2004—2005 | 0.49 | 0.72 | |
| 加拿大 Canada | 常绿针叶林Evergreen needleleaf forest | 2001—2005 | 0.46 | 0.64 | |
| 加拿大 Canada | 混交林 Mixed forest | 2003—2005 | 0.49 | 0.63 | |
| 加拿大 Canada | 常绿针叶林Evergreen needleleaf forest | 2001—2005 | 0.30 | 0.35 | |
| 加拿大 Canada | 常绿针叶林Evergreen needleleaf forest | 2001—2006 | 0.25 | 0.40 | |
| 加拿大 Canada | 常绿针叶林Evergreen needleleaf forest | 2003—2005 | 0.40 | 0.38 | |
| 加拿大 Canada | 常绿针叶林Evergreen needleleaf forest | 2004—2005 | 0.26 | 0.40 | |
| 加拿大 Canada | 常绿针叶林Evergreen needleleaf forest | 2003—2005 | 0.57 | 0.52 | |
| 加拿大 Canada | 混交林 Mixed forest | 2003—2005 | 0.38 | 0.42 | |
| 美国America | 落叶阔叶林 Deciduous broad-leaved forest | 2004—2005 | 0.59 | 0.72 | |
| 美国America | 常绿针叶林Evergreen needleleaf forest | 2000—2006 | 0.36 | 0.38 | |
| 美国America | 常绿针叶林Evergreen needleleaf forest | 2005—2006 | 0.50 | 0.32 | |
| 美国America | 混交林 Mixed forest | 2000—2006 | 0.73 | 0.69 | |
| 美国America | 混交林 Mixed forest | 2000—2004 | 0.57 | 0.59 | |
| 美国America | 混交林 Mixed forest | 2000—2004 | 0.52 | 0.57 | |
| 美国America | 常绿阔叶林 Evergreen broad-leaved forest | 2000—2006 | 0.52 | 0.48 | |
| 美国America | 混交林 Mixed forest | 2001—2005 | 0.40 | 0.61 | |
| 美国America | 落叶阔叶林 Deciduous broad-leaved forest | 2002—2005 | 0.63 | 0.69 | |
| 美国America | 常绿针叶林Evergreen needleleaf forest | 2004—2005 | 0.37 | 0.25 | |
| 美国America | 落叶阔叶林 Deciduous broad-leaved forest | 2000—2005 | 0.61 | 0.76 | |
| 美国America | 落叶阔叶林 Deciduous broad-leaved forest | 2004—2006 | 0.70 | 0.72 | |
| 美国America | 常绿针叶林Evergreen needleleaf forest | 2000—2003 | 0.31 | 0.37 | |
| 美国America | 落叶阔叶林 Deciduous broad-leaved forest | 2004—2005 | 0.79 | 0.69 | |
| 美国America | 常绿阔叶林 Evergreen broad-leaved forest | 2000—2004 | 0.38 | 0.51 | |
| 美国America | 混交林 Mixed forest | 2002—2006 | 0.55 | 0.52 | |
| 美国America | 落叶阔叶林 Deciduous broad-leaved forest | 2000—2003 | 0.64 | 0.69 | |
| 美国America | 落叶阔叶林 Deciduous broad-leaved forest | 2000—2006 | 0.71 | 0.74 | |
| 美国America | 混交林 Mixed forest | 2002—2005 | 0.59 | 0.56 | |
| 美国America | 常绿针叶林Evergreen needleleaf forest | 2000—2006 | 0.38 | 0.48 | |
| 美国America | 混交林 Mixed forest | 2001—2005 | 0.60 | 0.64 | |
| 加拿大 Canada | 常绿针叶林Evergreen needleleaf forest | 2000—2005 | 0.29 | 0.46 | |
| 美国America | 落叶阔叶林 Deciduous broad-leaved forest | 2002—2002 | 0.66 | 0.69 | |
| 美国America | 常绿针叶林Evergreen needleleaf forest | 2000—2000 | 0.30 | 0.30 | |
| 加拿大 Canada | 常绿针叶林Evergreen needleleaf forest | 2003—2005 | 0.53 | 0.51 | |
| 美国America | 常绿针叶林Evergreen needleleaf forest | 2004—2005 | 0.53 | 0.26 | |
| 加拿大 Canada | 常绿针叶林Evergreen needleleaf forest | 2000—2005 | 0.60 | 0.51 | |
| 加拿大 Canada | 常绿针叶林Evergreen needleleaf forest | 2001—2005 | 0.28 | 0.40 | |
| 加拿大 Canada | 常绿针叶林Evergreen needleleaf forest | 2001—2005 | 0.32 | 0.44 | |
| 加拿大 Canada | 常绿针叶林Evergreen needleleaf forest | 2000—2005 | 0.26 | 0.28 | |
| 美国America | 常绿针叶林Evergreen needleleaf forest | 2003—2005 | 0.50 | 0.38 | |
| 美国America | 常绿针叶林Evergreen needleleaf forest | 2003—2003 | 0.36 | 0.38 | |
| 加拿大 Canada | 常绿针叶林Evergreen needleleaf forest | 2000—2005 | 0.29 | 0.33 |

图1
最大光能利用率与生长季增强型植被指数最大值关系的指数拟合"


图2
4个森林站点不同参数化方案估算的ε0值 虚线代表各站点不同参数化方案估算的ε0均值 The dashed line meant the mean value of ε0 estimated by different parameterization schemes at each site;不同大写字母代表不同站点ε0均值之间的差异显著(P<0.05)Different capital letters meant significant differences in mean value of ε0 across sites at 0.05 level; 不同小写字母表示同一站点不同参数化方案之间估算的ε0值差异显著(P<0.05)Different small letters meant significant differences in ε0 estimated by different parameterization schemes at the same site at 0.05 level."
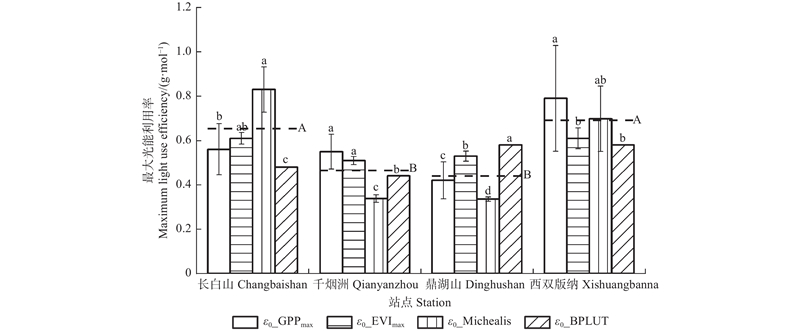

图3
2007—2010年4个森林站点不同参数化方案下VPM模拟的GPP与观测的GPP季节变化动态对比 GPPEC:GPP 8天观测总值 8 day total gross primary productivity based on observation;GPPVPM(ε0_GPPmax):ε0_GPPmax参数化方案下VPM模型GPP 8天模拟总值 8 day total gross primary productivity predicted by VPM model on ε0_GPPmax parameterization scheme; GPPVPM(ε0_EVImax):ε0_EVImax参数化方案下VPM模型GPP 8天模拟总值 8 day total gross primary productivity predicted by VPM model on ε0_EVImax parameterization scheme; GPPVPM(ε0_Michealis):ε0_Michealis参数化方案下VPM模型GPP 8天模拟总值 8 day total gross primary productivity predicted by VPM model on ε0_Michealis parameterization scheme; GPPVPM(ε0_BPLUT):ε0_BPLUT参数化方案下VPM模型GPP 8天模拟总值 8 day total gross primary productivity predicted by VPM model on ε0_BPLUT parameterization scheme."
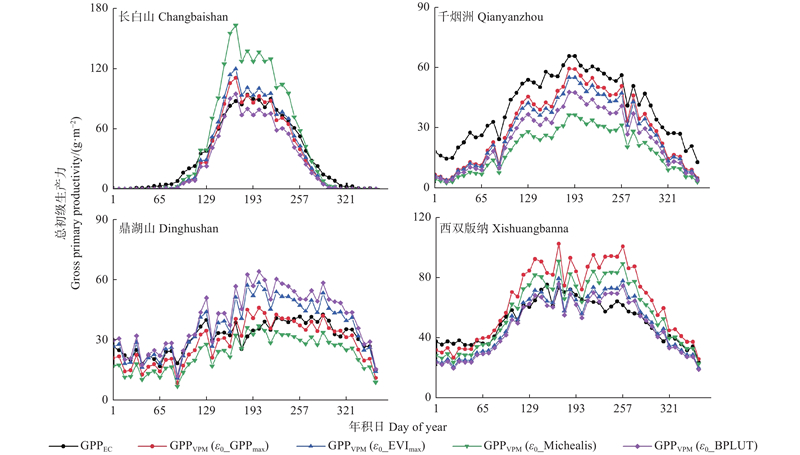

图4
4个森林站点不同参数化方案下VPM模拟的GPP与观测GPP的对比 模型模拟性能评价指标分别为决定系数(R2)、均方根误差(RMSE)、一致性系数(d)以及相应方案的拟合方程斜率(k) The coefficient of determination (R2), root mean square error (RMSE),the Willmott’s index of agreement (d), and slope of the fitted equation (k) were used to evaluate model performance;虚线为1∶1线The dashed black lines denote the 1:1 lines;不同颜色的实线代表不同参数化方案的回归曲线The solid lines with different colors denote the regression lines of various parameterization scheme; 每个评价指标的下标数字1,2,3,4分别代表Mointeith方程推导法、生长季增强型植被指数最大值(EVImax)指数拟合、Michealis-Menten光响应曲线方程拟合及BPLUT查表法这4种参数化方案The subscript numbers 1,2,3, and 4 of each evaluation indicators represent Mointeith equation estimation method, Maxmiun enhanced vegetation index (EVImax) of the growing season exponential fitting, Michealis-Menten light response curve equation fitting, and BPLUT look-up table method, respectively."
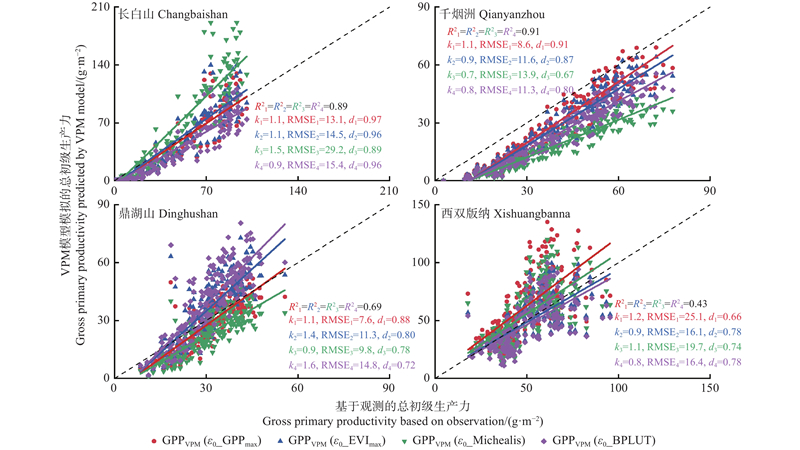
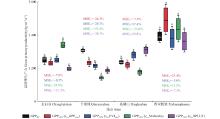
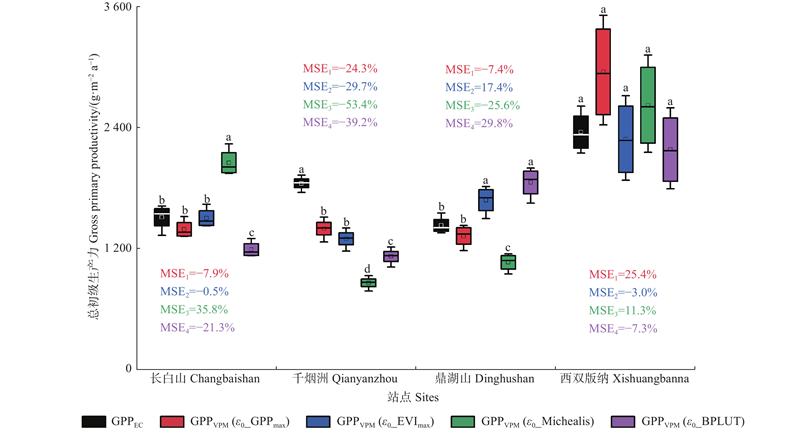
图5
4个森林站点不同参数化方案模拟GPP年总量与观测GPP年总量对比分析 箱体上框线与下框线分别代表75%分位数与25%分位数 Upper box edge and lower box ege represents75% percentile and 25% percentile; 每个箱体中的小方块代表GPP年均值 Small square of box representsannual average GPP value; 箱体中的横线代表中位数 Centerline of box represents median; 箱体上下的延伸线代表最大值与最小值 Extended lines above and below the box represents maximum and minimum values;小写字母表示同一站点不同参数化方案模拟GPP年总量之间存在显著差异(P<0.05) Small letters represents significant difference in annual GPP predicted by different parameterization schemes at 0.05 level;MRE:各参数化方案模拟GPP年总量与观测GPP年总量的平均相对误差Mean relative error between GPP predicted by VPM based on different parameterization schemes and GPP based on observation."
| 常晓晴, 邢艳秋, 王馨慧, 等. 3PG碳生产模型在长白山阔叶红松林总初级生产力估算中的应用. 应用生态学报, 2019, 30 (5): 1599- 1607. | |
| Chang X Q, Xing Y Q, Wang X H, et al. Application of 3PG carbon production model in the gross primary productivity estimation of broadleaved Korean pine forest in Changbai Mountain. Chinese Journal of Applied Ecology, 2019, 30 (5): 1599- 1607. | |
| 戴晓琴, 王辉民, 徐明洁, 等. 2003–2010年千烟洲人工针叶林碳水通量观测数据集. 中国科学数据, 2021, 6 (1): 7- 15. | |
| Dai X Q, Wang H M, Xu M J, et al. An observation dataset of carbon and water fluxes of artificial coniferous forests in Qianyanzhou (2003–2010). Science Data Bank, 2021, 6 (1): 7- 15. | |
|
房秋兰, 沙丽清. 西双版纳热带季节雨林与橡胶林土壤呼吸. 植物生态学报, 2006, 30 (1): 97- 103.
doi: 10.3321/j.issn:1005-264X.2006.01.014 |
|
|
Fang Q L, Sha L Q. Soil respiration in a tropical seasonal rainforest and rubber plantation in Xishuangbanna Yunnan SW China. Journal of Plant Ecology, 2006, 30 (1): 97- 103.
doi: 10.3321/j.issn:1005-264X.2006.01.014 |
|
| 高德新, 王 帅, 李 琰, 等. 植被光能利用率: 模型及其不确定性. 生态学报, 2021, 41 (14): 5507- 5516. | |
| Gao D X, Wang S, Li Y, et al. Light use efficiency of vegetation: model and uncertainty. Acta Ecologica Sinica, 2021, 41 (14): 5507- 5516. | |
| 葛宏立, 张丽景. 利用MODIS数据估测毛竹林总初级生产力. 浙江农林大学学报, 2014, 31 (2): 178- 184. | |
| Ge H L, Zhang L J. Gross primary production in Phyllostachys edulis based on MODIS. Journal of Zhejiang A&F University, 2014, 31 (2): 178- 184. | |
| 贾文晓, 刘 敏, 佘倩楠, 等. 基于FLUXNET观测数据与VPM模型的森林生态系统光合作用关键参数优化及验证. 应用生态学报, 2016, 27 (4): 1095- 1102. | |
| Jia W X, Liu M, She Q N, et al. Optimization and evaluation of key photosynthesis parameters in forest ecosystems based on FLUXNET data and VPM model. Chinese Journal of Applied Ecology, 2016, 27 (4): 1095- 1102. | |
| 李登秋, 张春华, 居为民, 等. 江西省森林净初级生产力动态变化特征及其驱动因子分析. 植物生态学报, 2016, 40 (7): 45- 59. | |
| Li D Q, Zhang C H, Ju W M, et al. Forest net primary productivity dynamics and driving forces in Jiangxi Province, China. Chinese Journal of Plant Ecology, 2016, 40 (7): 45- 59. | |
| 李跃林, 闫俊华, 孟 泽, 等. 2003–2010年鼎湖山针阔叶混交林碳水通量观测数据集. 中国科学数据, 2021, 6 (1): 16- 26. | |
| Li Y L, Yan J H, Meng Z, et al. An observation dataset of carbon and water fluxes in a mixed coniferous broad-leaved forest at Dinghushan, Southern China (2003 – 2010). Science Data Bank, 2021, 6 (1): 16- 26. | |
| 刘允芬, 宋 霞, 孙晓敏, 等. 千烟洲人工针叶林CO2通量季节变化及其环境因子的影响. 中国科学(D辑: 地球科学), 2004, 34 (S2): 109- 117. | |
| Liu Y F, Song X, Sun X M, et al. Seasonal variation of CO2 flux in artificial coniferous forest in Qianyan⁃ zhou and its environmental factors. Science in China (Series D: Earth Sciences), 2004, 34 (S2): 109- 117. | |
| 起德花, 张一平, 宋清海, 等. 2003–2010年西双版纳热带季节雨林碳水和能量通量观测数据集. 中国科学数据, 2021, 6 (1): 37- 49. | |
| Qi D H, Zhang Y P, Song Q H, et al. A dataset of carbon, water and energy fluxes observed in Xishuangbanna tropical seasonal rain forest from 2003 to 2010. Science Data Bank, 2021, 6 (1): 37- 49. | |
| 石旭霞, 宋沼鹏, 侯继华, 等. 中国东部森林最大总初级生产力的时空分布特征及其影响因子. 生态学杂志, 2019, 38 (7): 1949- 1961. | |
| Shi X X, Song Z P, Hou J H, et al. Spatiotemporal patterns of the maximum primary productivity and driving factors in the eastern China’s forests. Chinese Journal of Ecology, 2019, 38 (7): 1949- 1961. | |
| 魏识广, 叶万辉, 练琚愉, 等. 南亚热带常绿阔叶林群落及其卫星样地物种多样性特征. 生态学报, 2022, 42 (11): 4515- 4523. | |
| Wei S G, Ye W H, Lian J Y, et al. Species diversity characteristics of lower subtropical evergreen broad⁃leaved forest community and its satellite. Acta Ecologica Sinica, 2022, 42 (11): 4515- 4523. | |
| 吴家兵, 关德新, 王安志, 等. 2003–2010年长白山阔叶红松林碳水通量观测数据集. 中国科学数据, 2021, 6 (1): 27- 36. | |
| Wu J B, Guan D X, Wang A Z, et al. A dataset of carbon and water flux observation in a broad-leaved red pine forest in Changbai Mountain (2003–2010). Science Data Bank, 2021, 6 (1): 27- 36. | |
| 张雷明, 于贵瑞, 孙晓敏, 等. 中国东部森林样带典型生态系统碳收支的季节变化. 中国科学(D辑: 地球科学), 2006, 36 (S1): 45- 59. | |
| Zhang L M, Yu G R, Sun X M, et al. Seasonal variation of carbon budget in a typical ecosystem of forest strips in eastern China. Science in China (Series D: Earth Sciences), 2006, 36 (S1): 45- 59. | |
| 周存宇, 周国逸, 张德强, 等. 鼎湖山森林地表CO2通量及其影响因子的研究. 中国科学(D辑: 地球科学), 2004, 34 (S2): 175- 182. | |
| Zhou C Y, Zhou G Y, Zhang D Q, et al. Research on forest floor CO2 flux and its influencing factors in Dinghu Mountain. Science in China (Series D: Earth Sciences), 2004, 34 (S2): 175- 182. | |
|
Balzarolo M, Valdameri N, Fu Y H, et al. Different determinants of radiation use efficiency in cold and temperate forests. Global Ecology and Biogeography, 2019, 28 (11): 1649- 1667.
doi: 10.1111/geb.12985 |
|
|
Beer C, Reichstein M, Tomelleri E, et al. Terrestrial gross carbon dioxide uptake: global distribution and covariation with climate. Science, 2010, 329 (5993): 834- 838.
doi: 10.1126/science.1184984 |
|
| Bonan G B, Lawrence P J, Oleson K W, et al. Improving canopy processes in the community Land Model version 4 (CLM4) using global flux fields empirically inferred from FLUXNET data. Journal of Geophysical Research, 2011, 116 (2): G02014. | |
|
Cheng Y B, Middleton E M, Hilker T, et al. Dynamics of spectral bio-indicators and their correlations with light use efficiency using directional observations at a Douglas-fir forest. Measurement Science and Technology, 2009, 20 (9): 095107.
doi: 10.1088/0957-0233/20/9/095107 |
|
| Cheng Y B, Zhang Q Y, Lyapustin A I, et al. Impacts of light use efficiency and fPAR parameterization on gross primary production modeling. Agricultural and Forest Meteorology, 2014, 189, 187- 197. | |
|
Coursolle C, Margolis, H A, Giasson M A, et al. Influence of stand age on the magnitude and seasonality of carbon fluxes in Canadian forests. Agricultural and Forest Meteorology, 2012, 165, 136- 148.
doi: 10.1016/j.agrformet.2012.06.011 |
|
|
Dragoni D, Schmid H P, Wayson C A, et al. Evidence of increased net ecosystem productivity associated with a longer vegetated season in a deciduous forest in south-central Indiana, USA. Global Change Biology, 2011, 17 (2): 886- 897.
doi: 10.1111/j.1365-2486.2010.02281.x |
|
| Feng S Q, Tang B H, Chen G K, et al. Estimating the gross primary productivity based on VPM correction model for Xishuangbanna tropical seasonal rainforest. International Journal of Remote Sensing, 2023, 45 (2): 1- 20. | |
| Goulden M L, Daube B C, Fan S M, et al. Physiological responses of a black spruce forest to weather. Journal of Geophysical Research Atmospheres, 1997, 102 (24): 28987- 28996. | |
|
Goulden M L, Mcmillan A M S, Winston G C, et al. Patterns of NPP, GPP, respiration, and NEP during boreal forest succession. Global Change Biology, 2011, 17 (2): 855- 871.
doi: 10.1111/j.1365-2486.2010.02274.x |
|
| Groenendijk M, Molen M K, Dolman A J. Seasonal variation in ecosystem parameters derived from FLUXNET data. Biogeosciences Discuss, 2009, 6 (2): 2863- 2912. | |
|
Hashimoto H, Dungan J, White M, et al. Satellite-based estimation of surface vapor pressure deficits using MODIS land surface temperature data. Remote Sensing of Environment, 2008, 112 (1): 142- 155.
doi: 10.1016/j.rse.2007.04.016 |
|
|
Heinsch F A, Running S W, Kimball J S, et al. Evaluation of remote sensing based terrestrial productivity from MODIS using regional tower eddy flux network observations. IEEE Transactions on Geoscience and Remote Sensing, 2006, 44 (7): 1908- 1925.
doi: 10.1109/TGRS.2005.853936 |
|
|
Hilker T, Gitelson A, Coops N C, et al. Tracking plant physiological properties from multi-angular tower-based remote sensing. Oecologia, 2011, 165 (4): 865- 876.
doi: 10.1007/s00442-010-1901-0 |
|
|
Hollinger D Y, Ollinger S V, Richardson A D, et al. Albedo estimates for land surface models and support for a new paradigm based on foliage nitrogen concentration. Global Change Biology, 2010, 16 (2): 696- 710.
doi: 10.1111/j.1365-2486.2009.02028.x |
|
|
Horn J E, Schulz K. Identification of a general light use efficiency model for gross primary production. Biogeosciences, 2011, 8 (4): 999- 1021.
doi: 10.5194/bg-8-999-2011 |
|
|
Keenan T F, Williams C A. The terrestrial carbon sink. Annual Review of Environment and Resources, 2018, 43 (1): 219- 243.
doi: 10.1146/annurev-environ-102017-030204 |
|
| Kergoat L, Lafont S, Arneth A, et al. Nitrogen controls plant canopy light‐use efficiency in temperate and boreal ecosystems. Journal of Geophysical Research: Biogeosciences, 2008, 113 (4): G04017. | |
|
Khanal N, Matin M A, Uddin K, et al. A comparison of three temporal smoothing algorithms to improve land cover classification: a case study from Nepal. Remote Sensing, 2020, 12 (18): 2888.
doi: 10.3390/rs12182888 |
|
|
Lasslop G, Reichstein M, Papale D, et al. Separation of net ecosystem exchange into assimilation and respiration using a light response curve approach: critical issues and global evaluation. Global Change Biology, 2010, 16 (1): 187- 208.
doi: 10.1111/j.1365-2486.2009.02041.x |
|
|
Liao Z Z, Zhou B H, Zhu J Y, et al. A critical review of methods, principles and progress for estimating the gross primary productivity of terrestrial ecosystems. Frontiers in Environmental Science, 2023, 11, 1093095.
doi: 10.3389/fenvs.2023.1093095 |
|
|
Lü Y L, Chi H, Shi P C, et al. Phenology-based maximum light use efficiency for modeling gross primary production across typical terrestrial ecosystems. Remote Sensing, 2023, 15 (16): 4002.
doi: 10.3390/rs15164002 |
|
|
Madani N, Kimball J S, Affleck D, et al. Improving ecosystem productivity modeling through spatially explicit estimation of optimal light use efficiency. Journal of Geophysical Research Biogeosciences, 2014, 119 (9): 1755- 1769.
doi: 10.1002/2014JG002709 |
|
|
Madani N, Kimball J S, Running S W. Improving global gross primary productivity estimates by computing optimum light use efficiencies using flux tower data. Journal of Geophysical Research Biogeosciences, 2017, 122 (11): 2939- 2951.
doi: 10.1002/2017JG004142 |
|
|
Migliavacca M, Reichstein M, Richardson A D, et al. Semiempirical modeling of abiotic and biotic factors controlling ecosystem respiration across eddy covariance sites. Global Change Biology, 2011, 17 (1): 390- 409.
doi: 10.1111/j.1365-2486.2010.02243.x |
|
|
Mishra A K. Retrieval of EVI from oceansat 2 data and comparison with MODIS derived EVI. Journal of The Indian Society of Remote Sensing, 2014, 42 (4): 877- 883.
doi: 10.1007/s12524-014-0369-5 |
|
| Misson L, Baldocchi D D, Black T A, et al. Partitioning forest carbon fluxes with overstory and understory eddy-covariance measurements: a synthesis based on FLUXNET data. Agricultural and Forest Meteorology, 2007, 144 (12): 14- 31. | |
|
Monteith J L. Solar radiation and productivity in tropical ecosystems. Journal of Applied Ecology, 1972, 9 (3): 747- 766.
doi: 10.2307/2401901 |
|
|
Nakaji T, Ide R, Oguma H, et al. Utility of spectral vegetation index for estimation of gross CO2 flux under varied sky conditions. Remote Sensing of Environment, 2007, 109 (3): 274- 284.
doi: 10.1016/j.rse.2007.01.006 |
|
|
Pei Y Y, Dong J W, Zhang Y, et al. Evolution of light use efficiency models: improvement, uncertainties, and imply-cations. Agricultural and Forest Meteorology, 2022, 317, 108905.
doi: 10.1016/j.agrformet.2022.108905 |
|
|
Piao S L, Ciais P, Friedlingstein P, et al. Net carbon dioxide losses of northern ecosystems in response to autumn warming. Nature, 2008, 451 (7174): 49- 52.
doi: 10.1038/nature06444 |
|
|
Piao S L, Sitch S, Ciais P, et al. Evaluation of terrestrial carbon cycle models for their response to climate variability and to CO2 trends. Global Change Biology, 2013, 19 (7): 2117- 2132.
doi: 10.1111/gcb.12187 |
|
|
Prince S D, Goward S N. Global primary production: a remote sensing approach. Journal of Biogeography, 1995, 22, 815.
doi: 10.2307/2845983 |
|
|
Running S W, Nemani R, Heinsch F, et al. A continuous satellite-derived measure of global terrestrial primary production. BioScience, 2004, 54 (6): 547- 560.
doi: 10.1641/0006-3568(2004)054[0547:ACSMOG]2.0.CO;2 |
|
|
Saito M, Maksyutov S, Hirata R, et al. An empirical model simulating diurnal and seasonal CO2 flux for diverse vegetation types and climate conditions. Biogeosciences, 2009, 6 (4): 585- 599.
doi: 10.5194/bg-6-585-2009 |
|
|
Srinet R, Nandy S, Watham T, et al. Coupling earth observation and eddy covariance data in light use efficiency based model for estimation of forest productivity. Geocarto International, 2022, 37 (25): 7716- 7732.
doi: 10.1080/10106049.2021.1983032 |
|
|
Sun G, Alstad K, Chen J, et al. A general predictive model for estimating monthly ecosystem evapotranspiration. Ecohydrology, 2011, 4 (2): 245- 255.
doi: 10.1002/eco.194 |
|
| Sun Z Y, Wang X F, Zhang X R, et al. Evaluating and comparing remote sensing terrestrial GPP models for their response to climate variability and CO2 trends. Science of The Total Environment, 2019, 668 (8): 696- 713. | |
|
Wang H B, Xin L, Ma M G, et al. Improving estimation of gross primary production in dryland ecosystems by a model data fusion approach. Remote Sensing, 2019, 11 (3): 225.
doi: 10.3390/rs11030225 |
|
|
Wang H S, Jia G S, Fu C B, et al. Deriving maximal light use efficiency from coordinated flux measurements and satellite data for regional gross primary production modeling. Remote Sensing of Environment, 2010a, 114 (10): 2248- 2258.
doi: 10.1016/j.rse.2010.05.001 |
|
| Wang K, Dickinson R E, Wild M, et al. Evidence for decadal variation in global terrestrial evapotranspiration between 1982 and 2002: 1. model development. Journal of Geophysical Research: Atmospheres, 2010b, 115 (20): D20112. | |
|
Wang L C, Zhu H J, Lin A W, et al. Evaluation of the latest MODIS GPP products across multiple biomes using global eddy covariance flux data. Remote Sensing, 2017, 9 (5): 418.
doi: 10.3390/rs9050418 |
|
|
Wu C Y, Munger J W, Niu Z, et al. Comparison of multiple models for estimating gross primary production using MODIS and eddy covariance data in Harvard Forest. Remote Sensing of Environment, 2010, 114 (12): 2925- 2939.
doi: 10.1016/j.rse.2010.07.012 |
|
| Wu J B, Xiao X M, Guan D X, et al. Estimation of the gross primary production of an old-growth temperate mixed forest using eddy covariance and remote sensing. International Journal of Remote Sensing, 2009, 30 (5): 463- 479. | |
| Wu Z F. Assessment of eco-climatic suitability and climate change impacts of/on broad-leaved Korean pine forest in northeast China. The Journal of Applied Ecology, 2003, 14 (5): 771- 775. | |
|
Xiao X M, Hollinger D, Aber J, et al. Satellite-based modeling of gross primary production in an evergreen needleleaf forest. Remote Sensing of Environment, 2004a, 89 (4): 519- 534.
doi: 10.1016/j.rse.2003.11.008 |
|
|
Xiao X M, Zhang Q Y, Braswell B, et al. Modeling gross primary production of temperate deciduous broadleaf forest using satellite images and climate data. Remote Sensing of Environment, 2004b, 91 (2): 256- 270.
doi: 10.1016/j.rse.2004.03.010 |
|
|
Xiao X M, Zhang Q Y, Saleska S, et al. Satellite-based modeling of gross primary production in a seasonally moist tropical evergreen forest. Remote Sensing of Environment, 2005, 94 (1): 105- 122.
doi: 10.1016/j.rse.2004.08.015 |
|
| Yang D, Xu X L, Xiao F J, et al. Improving modeling of ecosystem gross primary productivity through reoptimizeng temperature restrictions on photosynthesis. Science of The Total Environments, 2021, 788 (3): 147805. | |
|
Yi C X, Ricciuto D, Li R, et al. Climate control of terrestrial carbon exchange across biomes and continents. Environmental Research Letters, 2010, 5 (3): 034007.
doi: 10.1088/1748-9326/5/3/034007 |
|
|
Yu G R, Zhang L M, Sun X M, et al. Environmental controls over carbon exchange of three forest ecosystems in eastern China. Global Change Biology, 2008, 14 (11): 2555- 2571.
doi: 10.1111/j.1365-2486.2008.01663.x |
|
|
Yu Q Z, Wang S Q, Mickler R A, et al. Narrowband bio-indicator monitoring of temperate forest carbon fluxes in northeastern China. Remote Sensing, 2014, 6 (9): 8986- 9013.
doi: 10.3390/rs6098986 |
|
|
Yuan W P, Liu D, Dong W J, et al. Multiyear precipitation reduction strongly decreases carbon uptake over northern China. Journal of Geophysical Research Biogeosciences, 2014, 119 (5): 881- 896.
doi: 10.1002/2014JG002608 |
|
| Yuan W P, Liu S G, Zhou G S, et al. Deriving a light use efficiency model from eddy covariance flux data for predicting daily gross primary production across biomes. Agricultural and Forest Meteorology, 2007, 143 (3): 189- 207. | |
| Yuan W P, Zheng Y, Piao S L, et al. Increased atmospheric vapor pressure deficit reduces global vegetation growth. Sience Advances, 2019, 5 (8): eaax1396. | |
| Zhang J Y, Wu L Y, Huang G, et al. Relationships between large-scale circulation patterns and carbon dioxide exchange by a deciduous forest. Journal of Geophysical Research Atmospheres, 2011, 116 (4): D04102. | |
|
Zhang Y, Xiao X M, Wu X C, et al. Data descriptor: a global moderate resolution dataset of gross primary production of vegetation for 2000-2016. Scientific Data, 2017, 4, 170165.
doi: 10.1038/sdata.2017.165 |
|
|
Zhou X W, Xin Q C. Improving satellite-based modelling of gross primary production in deciduous broadleaf forests by accounting for seasonality in light use efficiency. International Journal of Remote Sensing, 2019, 40 (3): 931- 955.
doi: 10.1080/01431161.2018.1519285 |
| [1] | 管崇帆,高翔,李志鹏,胡晓创,胡美均,张劲松,孟平,蔡金峰,孙守家. 辽西地区樟子松人工林生产力和水分利用效率对气候变化的响应及预测[J]. 林业科学, 2024, 60(7): 28-39. |
| [2] | 李鑫豪,张德怀,张赵森,李建,曹俊,隗骥超,吴晓朦,田赟,刘鹏,于海群. 北京密云油松人工林碳通量组分季节变化及其对环境因子的响应[J]. 林业科学, 2023, 59(7): 35-44. |
| [3] | 万家鸣,律江,石云,许行,张志强. 散射辐射对杨树人工林生态系统总初级生产力的影响[J]. 林业科学, 2023, 59(5): 1-10. |
| 阅读次数 | ||||||
|
全文 |
|
|||||
|
摘要 |
|
|||||