
林业科学 ›› 2026, Vol. 62 ›› Issue (7): 38-49.doi: 10.11707/j.1001-7488.LYKX20250384
黄宏超1,雷相东1,*( ),国红1,罗光成1,2,何潇1
收稿日期:2025-06-11
出版日期:2026-07-10
发布日期:2026-07-16
通讯作者:
雷相东
E-mail:xdlei@ifirit.ac.cn
基金资助:
Hongchao Huang1,Xiangdong Lei1,*(),Hong Guo1,Guangcheng Luo1,2,Xiao He1
Received:2025-06-11
Online:2026-07-10
Published:2026-07-16
Contact:
Xiangdong Lei
E-mail:xdlei@ifirit.ac.cn
摘要:
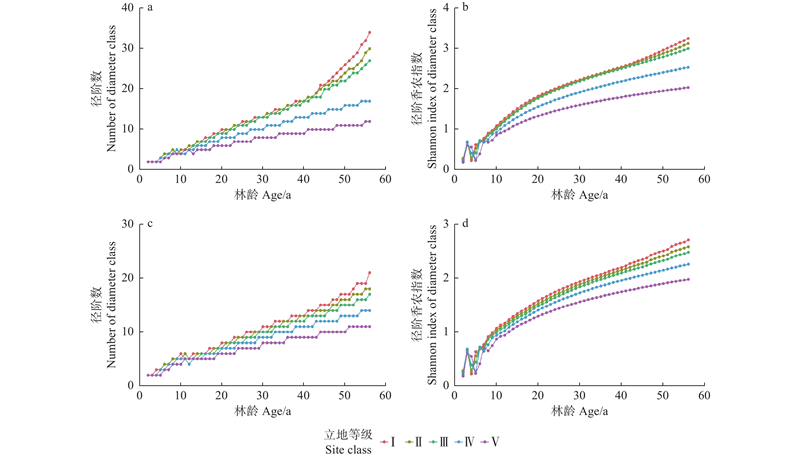
目的: 提出一种基于过程生长模型和优化算法估计林分潜在生产力的新方法,为立地质量评价和森林经营提供科学依据。方法: 基于长白落叶松纯林连续观测样地数据校准3-PGmix模型,应用决定系数(R2)、平均绝对误差(MAE)、均方根误差(RMSE)和相对均方根误差(rRMSE)评价模型性能;设置蓄积连年生长量和5年定期平均生长量最大2种目标情景,采用粒子群优化算法求解不同立地等级下林分蓄积生产力最大值和对应的最优林分密度,在此基础上通过Weibull分布函数的尺度和形状参数模型得到对应的最优直径结构。结果: 1) 在校准数据和验证数据中,3-PGmix模型模拟的长白落叶松人工林的平均胸径、株数密度、蓄积量和地上生物量与样地实测值一致性较好,决定系数均大于0.86,相对均方根误差均小于16%。2) 基准年龄30年时,长白落叶松人工林连年生长量和5年定期平均生长量最大时5个立地等级的蓄积潜在生产力分别为4.50~8.11和4.53~8.18 m3·hm?2a?1。3) 达到蓄积潜在生产力时的径阶数量随林龄增加单调递增,径阶香农指数在生长前期经波动变化后也呈现出增加趋势,且立地等级越高二者数值越大。结论: 结合过程模型3-PGmix与粒子群优化算法可以实现蓄积潜在生产力的估计,弥补传统方法未考虑林分自稀疏和气候因素影响的不足,为林分潜在生产力估计提供了一种新的方法。
中图分类号:
黄宏超,雷相东,国红,罗光成,何潇. 基于3-PGmix过程生长模型和优化算法的长白落叶松人工林潜在生产力估计[J]. 林业科学, 2026, 62(7): 38-49.
Hongchao Huang,Xiangdong Lei,Hong Guo,Guangcheng Luo,Xiao He. Estimation of Potential Productivity of Larix olgensis Plantations Based on 3-PGmix Process-Based Model and Optimization Algorithm[J]. Scientia Silvae Sinicae, 2026, 62(7): 38-49.

表1
长白落叶松人工林样地林分因子统计表①"
| 统计量 Statistics | 林龄 Stand age/a | 平均胸径 Mean DBH/cm | 平均树高 Mean height/m | 株数密度 Stem density/ (trees·hm?2) | 林分蓄积量 Stand volume/ (m3·hm?2) | 地上生物量 Stem biomass/ (t·hm?2) | 树叶生物量 Foliage biomass/ (t·hm?2) | 树根生物量 Root biomass/ (t·hm?2) |
| 平均值 Mean | 30 | 14.2 | 13.9 | 1 203 | 124.96 | 67.79 | 3.68 | 12.16 |
| 标准差 Standard deviation | 9 | 3.8 | 3.8 | 693 | 55.86 | 30.31 | 1.40 | 10.94 |
| 最小值 Minimum | 9 | 6.5 | 5.0 | 317 | 15.68 | 8.43 | 0.68 | 1.62 |
| 最大值 Maximum | 56 | 26.5 | 26.1 | 4 033 | 281.53 | 152.12 | 7.20 | 26.53 |
表2
长白落叶松人工林3-PGmix模型参数"
| 参数 Parameters | 符号 Symbol | 单位 Unit | 参数值 Values | 方法 Methods |
| 当胸径为2 cm时的树叶和地上生物量比 Foliage:stem partitioning ratio at DBH=2 cm | p2 | — | 0.69 | 优化 Optimization |
| 当胸径为20 cm时的树叶和地上生物量比 Foliage:stem partitioning ratio at DBH=20 cm | p20 | — | 0.14 | 优化 Optimization |
| 地上生物量与胸径的关系常数 Constant in the stem mass and DBH relationship | aS | — | 0.11 | 拟合 Fitting |
| 地上生物量与胸径的幂指数 Power in the stem mass and DBH relationship | nS | — | 2.429 | 拟合 Fitting |
| NPP分配到根的最大比例 Maximum fraction of NPP to roots | ηRx | — | 0.67 | 优化 Optimization |
| NPP分配到根的最小比例 Minimum fraction of NPP to roots | ηRn | — | 0.44 | 优化 Optimization |
| 最大叶凋落速率 Maximum litterfall rate | γFx | 每月Month?1 | 0.03 | 优化 Optimization |
| 叶凋落速率达1/2时林龄 Age at which litterfall rate has median value | tγF | 月数 Months | 24 | |
| 月均根周转率 Average monthly root turnover rate | γR | 每月 Month?1 | 0.023 | 优化 Optimization |
| 叶生长月份 If deciduous, leaves are produced at end of this month | leafP | 月 Month | 5 | |
| 叶凋落月份 If deciduous, leaves all fall at start of this month | leafL | 月 Month | 10 | |
| 生长最低温度 Minimum temperature for growth | Tmin | ℃ | ?5 | |
| 生长最适温度 Optimum temperature for growth | Topt | ℃ | 16 | |
| 生长最高温度 Maximum temperature for growth | Tmax | ℃ | 38 | |
| 霜冻损失生产力天数Days production lost per frost day | kF | 天数 Days | 0.3 | 优化 Optimization |
| 肥力为0时m的值Value of m when FR = 0 | m0 | — | 0.1 | 优化 Optimization |
| 肥力为0时fN的值Value of fN when FR = 0 | fN0 | — | 0.8 | 优化 Optimization |
| 最大林龄 Maximum stand age used in age modifier | tx | 年 Years | 160 | |
| 林龄最大时死亡率 Mortality rate for large age | γNx | %·a?1 | 2 | 优化 Optimization |
| 当林分密度为 Maximum stem biomass per tree at | wSx | kg·tree?1 | 144 | 拟合 Fitting |
| 自稀疏幂指数 Power in self-thinning rule | nm | — | 1.22 | 拟合 Fitting |
| 初期比叶面积 Specific leaf area at age 0 | σ0 | m2·kg?1 | 8.4 | 优化 Optimization |
| 成熟林比叶面积 Specific leaf area for mature leaves | σ1 | m2·kg?1 | 4.6 | 优化 Optimization |
| 比叶面积达(σ0 +σ1)/2时林龄 Age at which specific leaf area = (σ0 +σ1)/2 | tσ | 年 Years | 10 | 优化 Optimization |
| 冠层量子效率 Canopy quantum efficiency | αCx | mol·mol?1 | 0.048 5 | 优化 Optimization |
| 树高关系常数 Constant in the stem height relationship | aH | — | 1.1 | 拟合 Fitting |
| 胸径在树高关系中的幂指数 Power of DBH in the stem height relationship | nHB | — | 0.83 | 拟合 Fitting |
| 材积关系常数 Constant in the stem volume relationship | aV | — | 0.000 2 | 拟合 Fitting |
| 胸径在材积关系中的幂指数 Power of DBH in the stem volume relationship | nVB | — | 2.434 | 拟合 Fitting |
图1
长白落叶松各林分因子模型模拟值与观测值比较 绿色散点表示校准数据的实测值与模型模拟值分布,橙色散点表示验证数据的实测值与模型模拟值分布,黑色虚线表示斜率为1截距为0的直线,红色实线为拟合直线。"
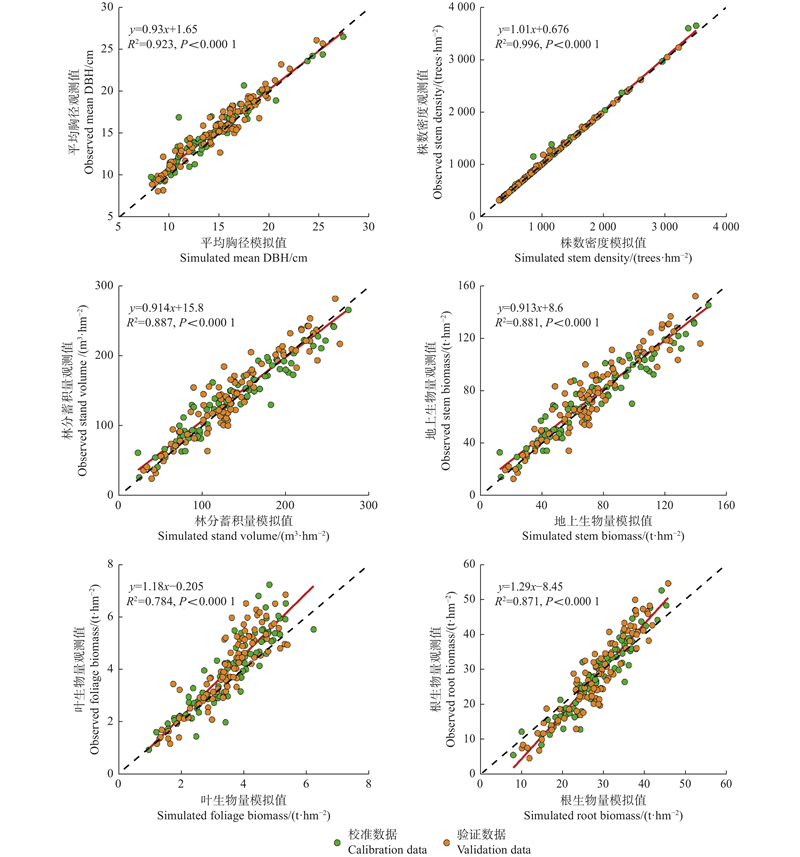
表3
各林分因子实测值与3-PGmix模型模拟值的校准和验证精度"
| 数据类型 Datasets | 林分因子 Stand factors | 决定系数 Determination coefficient (R2 ) | 平均绝对误差 Mean absolute error (MAE) | 均方根误差 Root mean square error (RMSE) | 相对均方根误差 Relative root mean square error (rRMSE) |
| 校准数据 Calibration data | 平均胸径Mean DBH | 0.88 | 0.61 | 1.20 | 7.80 |
| 株数密度Stem density | 0.99 | 0.18 | 52.36 | 4.81 | |
| 蓄积量Stand volume | 0.88 | 1.43 | 17.87 | 12.89 | |
| 地上生物量Stem biomass | 0.88 | 1.52 | 9.99 | 13.25 | |
| 叶生物量Foliage biomass | 0.72 | 3.93 | 0.74 | 18.90 | |
| 根生物量Root biomass | 0.86 | 1.70 | 3.85 | 13.92 | |
| 验证数据 Validation data | 平均胸径Mean DBH | 0.90 | 0.61 | 1.19 | 7.76 |
| 株数密度Stem density | 0.99 | 0.04 | 26.54 | 2.39 | |
| 蓄积量Stand volume | 0.87 | 2.03 | 21.10 | 14.86 | |
| 地上生物量Stem biomass | 0.86 | 2.12 | 11.67 | 15.19 | |
| 叶生物量Foliage biomass | 0.62 | 5.76 | 0.87 | 21.83 | |
| 根生物量Root biomass | 0.81 | 2.90 | 5.03 | 17.86 |
图2
3种方案情景下不同立地等级最大蓄积生长量及对应株数密度变化 红色、绿色和蓝色曲线分别表示每5年优化、逐年优化和自然生长情景下最大蓄积生长量及株数密度变化。"
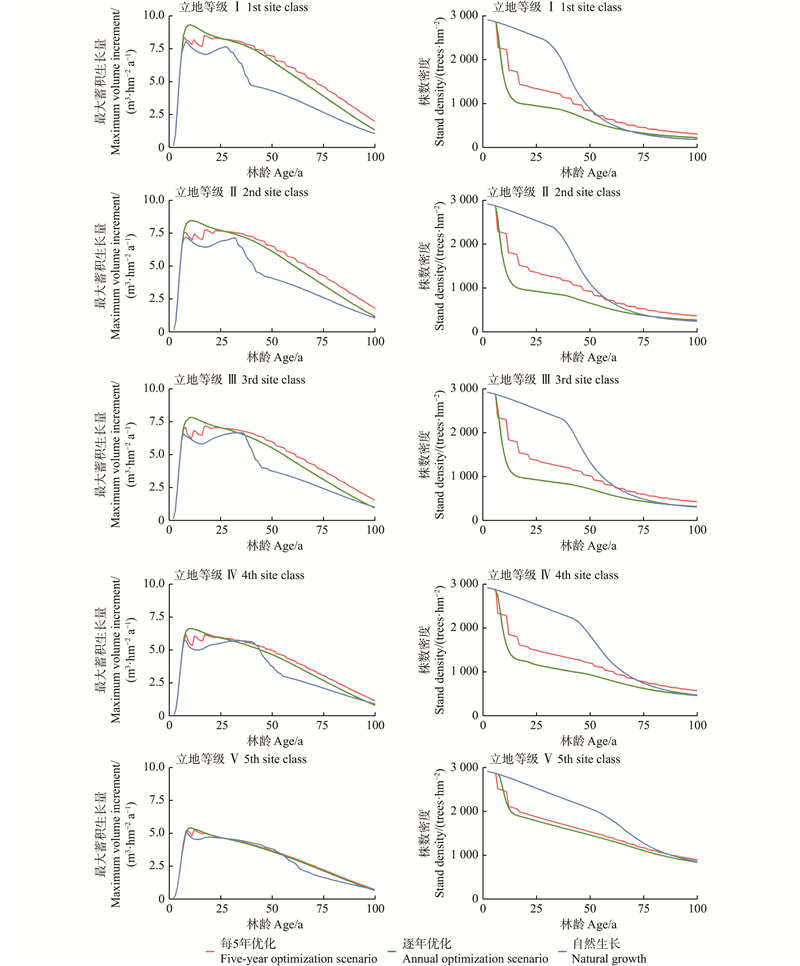
表4
林龄30年不同方案情景下长白落叶松蓄积潜在生产力(蓄积连年生长量)、株数密度和单木材积"
| 方案情景Scenario | 指标 Indicator | 立地等级 Site class | ||||
| Ⅰ | Ⅱ | Ⅲ | Ⅳ | Ⅴ | ||
| 逐年优化 Annual optimization scenario | 蓄积潜在生产力Potential volume productivity/(m3·hm?2a?1) | 8.11 | 7.49 | 6.83 | 5.72 | 4.50 |
| 株数密度Stand density/(trees·hm?2) | 920 | 885 | 884 | 1 107 | 1 721 | |
| 单木材积Individual tree volume/m3 | 0.20 | 0.19 | 0.18 | 0.12 | 0.066 | |
| 每5年优化 Five-year optimization scenario | 蓄积潜在生产力Potential volume productivity/(m3·hm?2a?1) | 8.18 | 7.57 | 6.94 | 5.85 | 4.53 |
| 株数密度Stand density/(trees·hm?2) | 1 294 | 1 282 | 1 295 | 1 426 | 1 808 | |
| 单木材积Individual tree volume/m3 | 0.14 | 0.12 | 0.11 | 0.092 | 0.062 | |
| 自然生长 Natural growth | 蓄积连年生长量Annual volume increment/(m3·hm?2a?1) | 7.26 | 7.06 | 6.60 | 5.68 | 4.56 |
| 株数密度Stand density/(trees·hm?2) | 2 414 | 2 437 | 2 437 | 2 437 | 2 437 | |
| 单木材积Individual tree volume/m3 | 0.079 | 0.070 | 0.065 | 0.055 | 0.047 | |
表5
尺度和形状参数模型的参数估计及模型评价①"
| 目标变量 Target variable | 参数 Parameter | 估计值 Estimated value | 调整决定系数 Adjusted R2 | 目标变量 Target variable | 参数 Parameter | 估计值 Estimated value | 调整决定系数 Adjusted R2 |
| 尺度参数 Scale parameter | b0 | 15.994 9*** | 0.91 | 形状参数 Shape parameter | c0 | 9.907 4*** | 0.25 |
| b1 | 7.746 1*** | c1 | ?0.245 2*** | ||||
| b2 | 1.530 2*** | c2 | ?0.209 2*** | ||||
| b3 | ?8.166 3e-4* | c3 | 6.908 3e-3*** | ||||
| — | — | c4 | ?7.192 9e-4*** |
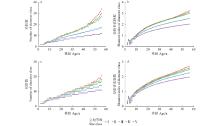
图3
达到蓄积潜在生产力条件下的径阶数量及径阶香农指数变化 a,b:逐年优化情景Annual optimization scenario;c,d:每5年优化情景 Five-year optimization scenario."
|
白 羽, 庞 勇, 夏晓运, 等. 长白落叶松解析木数据参数化3-PG模型. 林业科学, 2022, 58 (1): 98- 110.
doi: 10.11707/j.1001-7488.20220111 |
|
|
Bai Y, Pang Y, Xia X Y, et al. 3-PG model parameterization using destructive sampling data of Larix olgensis. Scientia Silvae Sinicae, 2022, 58 (1): 98- 110.
doi: 10.11707/j.1001-7488.20220111 |
|
| 孟宪宇. 2006. 测树学. 3版. 北京: 中国林业出版社. | |
| Meng X Y. 2006. Forest measurement. 3rd ed. Beijing: China Forestry Publishing House. [in Chinese] | |
|
雷相东, 符利勇, 李海奎, 等. 基于林分潜在生长量的立地质量评价方法与应用. 林业科学, 2018, 54 (12): 116- 126.
doi: 10.11707/j.1001-7488.20181213 |
|
|
Lei X D, Fu L Y, Li H K, et al. Methodology and applications of site quality assessment based on potential mean annual increment. Scientia Silvae Sinicae, 2018, 54 (12): 116- 126.
doi: 10.11707/j.1001-7488.20181213 |
|
|
段光爽, 郑亚丽, 洪 亮, 等. 基于潜在生产力的华北落叶松纯林和白桦山杨混交林立地质量评价. 林业科学, 2022, 58 (10): 1- 9.
doi: 10.11707/j.1001-7488.20221001 |
|
|
Duan G S, Zheng Y L, Hong L, et al. A potential productivity-based approach of site quality evaluation for larch pure forest and birch-aspen mixed forest. Scientia Silvae Sinicae, 2022, 58 (10): 1- 9.
doi: 10.11707/j.1001-7488.20221001 |
|
|
国 红, 雷渊才. 蒙古栎林分直径Weibull分布参数估计和预测方法比较. 林业科学, 2016, 52 (10): 64- 71.
doi: 10.11707/j.1001-7488.20161008 |
|
|
Guo H, Lei Y C. Method comparison of weibull function for estimating and predicting diameter distribution of Quercus mongolica stands. Scientia Silvae Sinicae, 2016, 52 (10): 64- 71.
doi: 10.11707/j.1001-7488.20161008 |
|
|
何 潇, 罗光成, 高文强, 等. 山西中条山林局油松纯林碳汇潜力. 林业科学, 2025, 61 (5): 74- 84.
doi: 10.11707/j.1001-7488.LYKX20240543 |
|
|
He X, Luo G C, Gao W Q, et al. Carbon sequestration potentiality of Pinus tabuliformis pure forest in Zhongtiaoshan forestry bureau of Shanxi Province. Scientia Silvae Sinicae, 2025, 61 (5): 74- 84.
doi: 10.11707/j.1001-7488.LYKX20240543 |
|
|
江希钿, 杨锦昌, 王素萍. 同龄纯林自然稀疏密度变化的研究. 林业科学, 2001, 37 (S1): 84- 89.
doi: 10.3321/j.issn:1001-7488.2001.z1.015 |
|
|
Jiang X D, Yang J C, Wang S P. A study on the self-thinning of density variation for even-aged pure stands. Scientia Silvae Sinicae, 2001, 37 (S1): 84- 89.
doi: 10.3321/j.issn:1001-7488.2001.z1.015 |
|
|
李佳怡, 阮红玉, 邱思玉, 等. 基于经验模型和机理模型的杉木人工林生物量估测对比研究. 生态学报, 2024, 44 (8): 3502- 3514.
doi: 10.20103/j.stxb.202304250868 |
|
|
Li J Y, Ruan H Y, Qiu S Y, et al. Comparative study on biomass estimation of Cunninghamia lanceolata plantations based on empirical model and mechanism model. Acta Ecologica Sinica, 2024, 44 (8): 3502- 3514.
doi: 10.20103/j.stxb.202304250868 |
|
| 罗光成, 何 潇, 雷相东, 等. 长白落叶松人工林优势高广义代数差分生长模型. 林业科学, 2024, 60 (12): 1- 12. | |
| Luo G C, He X, Lei X D, et al. Generalized algebraic differential growth model of dominant height for Larix olgensis plantations. Scientia Silvae Sinicae, 2024, 60 (12): 1- 12. | |
| 罗光成, 雷相东, 史景宁, 等. 基于潜在生产力的吉林省长白落叶松人工林立地质量评价. 北京林业大学学报, 2025, 47 (1): 1- 10. | |
| Luo G C, Lei X D, Shi J N, et al. Site quality evaluation of Larix olgensis plantations based on potential productivity in Jilin Province of northeastern China. Journal of Beijing Forestry University, 2025, 47 (1): 1- 10. | |
|
曲凌昊, 赵秀海, 张春雨. 3-PG模型在天然兴安落叶松林生长因子预测中的应用. 林业科学研究, 2022, 35 (1): 158- 165.
doi: 10.13275/j.cnki.lykxyj.2022.01.018 |
|
|
Qu L H, Zhao X H, Zhang C Y. Application of 3-PG model in the prediction of growth factors in natural Larix gmelinii forest. Forest Research, 2022, 35 (1): 158- 165.
doi: 10.13275/j.cnki.lykxyj.2022.01.018 |
|
|
夏晓运, 庞 勇, 黄庆丰, 等. 基于3-PG模型的长白落叶松生物量生长预测. 林业科学, 2021, 57 (3): 67- 78.
doi: 10.11707/j.1001-7488.20210307 |
|
|
Xia X Y, Pang Y, Huang Q F, et al. Prediction of biomass growth of Larix olgensis based on 3-PG model. Scientia Silvae Sinicae, 2021, 57 (3): 67- 78.
doi: 10.11707/j.1001-7488.20210307 |
|
| 解雅麟. 2020. 基于3-PGmix模型的气候变化和间伐对落叶松林生长收获的影响. 北京: 北京林业大学. | |
| Xie Y L. 2020. Effects of climate change and thinning on growth and yield of larch plantations based on 3-PGmix model. Beijing: Beijing Forestry University. [in Chinese] | |
|
解雅麟, 雷相东, 曾伟生. 基于3-PGmix过程模型的落叶松人工林生长过程表编制. 林业科学, 2023, 59 (12): 87- 104.
doi: 10.11707/j.1001-7488.LYKX20220837 |
|
|
Xie Y L, Lei X D, Zeng W S. Compilation of growth and yield table for larch plantations based on 3-PGmix model. Scientia Silvae Sinicae, 2023, 59 (12): 87- 104.
doi: 10.11707/j.1001-7488.LYKX20220837 |
|
| 薛海连. 2021. 基于过程模型的森林生长模拟与经营优化. 杨凌: 西北农林科技大学. | |
| Xue H L. 2021. Forest growth simulation and management optimization using process-based models. Yangling: Northwest A & F University. [in Chinese] | |
|
万 敏, 孙玉军, 孙 钊, 等. 应用3-PG模型预测杉木人工林生物量及蓄积量. 东北林业大学学报, 2023, 51 (11): 74- 79, 94.
doi: 10.3969/j.issn.1000-5382.2023.11.012 |
|
|
Wan M, Sun Y J, Sun Z, et al. Prediction of biomass and volume of Chinese fir plantation using 3-PG model. Journal of Northeast Forestry University, 2023, 51 (11): 74- 79, 94.
doi: 10.3969/j.issn.1000-5382.2023.11.012 |
|
|
王成雨, 扶欣然, 李佳怡, 等. 基于3-PGmix模拟杉木人工林轮伐期和间伐措施对蓄积量的影响. 生态学报, 2025, 45 (6): 2780- 2797.
doi: 10.20103/j.stxb.202407021537 |
|
|
Wang C Y, Fu X R, Li J Y, et al. Effects of thinning measures on rotation period and stock volume of Cunninghamia lanceolata plantations based on 3-PGmix simulations. Acta Ecologica Sinica, 2025, 45 (6): 2780- 2797.
doi: 10.20103/j.stxb.202407021537 |
|
| 王 战. 1992. 中国落叶松林. 北京: 中国林业出版社. | |
| Wang Z. 1992. Larch forests in China. Beijing: China Forestry Publishing House. [in Chinese] | |
| 张 萱. 2023. 基于3-PGmix模型的不同灌溉方式下毛白杨人工林生产力模拟及其对气候变化的响应. 北京: 北京林业大学. | |
| Zhang X. 2023. Productivity simulation of Populus tomentosa plantation under different irrigation methods and response to climate change based on 3-PGmix model. Beijing: Beijing Forestry University. [in Chinese] | |
| 周甲敏, 刘兆刚, 董灵波. 基于蓄积潜在生产力的小兴安岭阔叶混交林立地质量评价. 北京林业大学学报, 2024, 46 (12): 21- 29. | |
| Zhou J M, Liu Z G, Dong L B. Site quality evaluation of broadleaved mixed forest in Xiaoxing’an Mountains of northeastern China based on volume potential productivity. Journal of Beijing Forestry University, 2024, 46 (12): 21- 29. | |
| Allen M II, Brunner A, Antón-Fernández C, et al. The relationship between volume increment and stand density in Norway spruce plantations. Forestry, 2021, 94 (1): 151- 165. | |
| Assmann E. 1970. The principles of forest yield study. Oxford: Pergamon Press Ltd. | |
| Bryars C, Maier C, Zhao D H, et al. Fixed physiological parameters in the 3-PG model produced accurate estimates of loblolly pine growth on sites in different geographic regions. Forest Ecology and Management, 2013, 289, 501- 514. | |
| Esprey L J, Sands P J, Smith C W. Understanding 3-PG using a sensitivity analysis. Forest Ecology and Management, 2004, 193 (1/2): 235- 250. | |
| Forrester D I, Tang X L. Analysing the spatial and temporal dynamics of species interactions in mixed-species forests and the effects of stand density using the 3-PG model. Ecological Modelling, 2016, 319, 233- 254. | |
| Fu L Y, Sharma R P, Zhu G Y, et al. A basal area increment-based approach of site productivity evaluation for multi-aged and mixed forests. Forests, 2017, 8 (4): 119. | |
| Kennedy J, Eberhart R. Particle swarm optimization. Proceedings of ICNN’95-international conference on neural networks. IEEE, 1995, 4, 1942- 1948. | |
| Landsberg J, Mäkelä A, Sievänen R, et al. Analysis of biomass accumulation and stem size distributions over long periods in managed stands of Pinus sylvestris in Finland using the 3-PG model. Tree Physiology, 2005, 25 (7): 781- 792. | |
| Landsberg J J, Sands P J. 2011. Physiological ecology of forest production: principles, processes and models (Vol. 4). Amsterdam: Academic Press. | |
| Landsberg J J, Waring R H. A generalised model of forest productivity using simplified concepts of radiation-use efficiency, carbon balance and partitioning. Forest Ecology and Management, 1997, 95 (3): 209- 228. | |
| MacFarlane D W, Green E J, Valentine H T. Incorporating uncertainty into the parameters of a forest process model. Ecological Modelling, 2000, 134 (1): 27- 40. | |
| Mahnken M, Cailleret M, Collalti A, et al. Accuracy, realism and general applicability of European forest models. Global Change Biology, 2022, 28 (23): 6921- 6943. | |
| Nölte A, Meilby H, Yousefpour R. Multi-purpose forest management in the tropics: Incorporating values of carbon, biodiversity and timber in managing Tectona grandis (teak) plantations in Costa Rica. Forest Ecology and Management, 2018, 422, 345- 357. | |
| Palma J, Hakamada R, Moreira G G, et al. Using 3PG to assess climate change impacts on management plan optimization of Eucalyptus plantations: a case study in Southern Brazil. Scientific Reports, 2021, 11 (1): 2708. | |
| Pretzsch H. Stand density and growth of Norway spruce (Picea abies (L.) Karst. ) and European beech (Fagus sylvatica L.): evidence from long-term experimental plots. European Journal of Forest Research, 2005, 124 (3): 193- 205. | |
| Pretzsch H. 2008. Forest dynamics, growth and yield: from measurement to model. Verlag, Berlin, Heidelberg: Springer. | |
| Rennolls K, Geary D N, Rollinson T J D. Characterizing diameter distributions by the use of the weibull distribution. Forestry, 1985, 58 (1): 57- 66. | |
| Skovsgaard J P, Vanclay J K. Forest site productivity: a review of the evolution of dendrometric concepts for even-aged stands. Forestry, 2008, 81 (1): 13- 31. | |
| Subedi S, Fox T R, Wynne R H. Determination of fertility rating (FR) in the 3-PG model for loblolly pine plantations in the southeastern United States based on site index. Forests, 2015, 6 (9): 3002- 3027. | |
| van Oijen M. Bayesian methods for quantifying and reducing uncertainty and error in forest models. Current Forestry Reports, 2017, 3 (4): 269- 280. | |
| Wang T L, Wang G Y, Innes J L, et al. ClimateAP: an application for dynamic local downscaling of historical and future climate data in Asia Pacific. Frontiers of Agricultural Science and Engineering, 2017, 4 (4): 448- 458. | |
| Wang W F, Peng C H, Zhang S Y, et al. Development of TRIPLEX-Management model for simulating the response of forest growth to pre-commercial thinning. Ecological Modelling, 2011, 222 (14): 2249- 2261. | |
| Wei H X, Xu C Y, Ma L Y, et al. Effect of late-season fertilization on nutrient reserves and carbohydrate accumulation in bareroot Larix olgensis seedlings. Journal of Plant Nutrition, 2014, 37 (2): 279- 293. | |
| Xie Y L, Wang H Y, Lei X D. Application of the 3-PG model to predict growth of Larix olgensis plantations in northeastern China. Forest Ecology and Management, 2017, 406, 208- 218. | |
| Xie Y L, Lei X D, Shi J N. Impacts of climate change on biological rotation of Larix olgensis plantations for timber production and carbon storage in northeast China using the 3-PGmix model. Ecological Modelling, 2020a, 435, 109267. | |
| Xie Y L, Wang H Y, Lei X D. Simulation of climate change and thinning effects on productivity of Larix olgensis plantations in northeast China using 3-PGmix model. Journal of Environmental Management, 2020b, 261, 110249. | |
| Yan X R, Feng L Y, Sharma R P, et al. Evaluating forest site quality using the biomass potential productivity approach. Forests, 2023, 15 (1): 23. | |
| Yoda K, Kira T, Ogawa H, et al. 1963. Self-thinning in overcrowded pure stands under cultivated and natural conditions. Journal of Biology, Osaka City University, 14: 107−129. | |
| Zhu J J, Liu Z G, Wang H X, et al. Effects of site preparation on emergence and early establishment of Larix olgensis in montane regions of northeastern China. New Forests, 2008, 36 (3): 247- 260. |
| [1] | 王晓曼,吕建雄,李贤军,吴义强,李新功,郝晓峰,乔建政,徐康. 基于PSO-BP神经网络模型的浸胶竹束干燥过程含水率预测[J]. 林业科学, 2025, 61(5): 187-198. |
| [2] | 吴璧芸,雷相东,何潇,李玉堂. 长白山天然针阔混交林优势高估计方法及立地质量评价[J]. 林业科学, 2025, 61(2): 85-92. |
| [3] | 雷晶晶,王映霓,廖丹,包雨鑫,杨可馨,王娟. 基于哑变量的中国东北天然次生林立地质量评价[J]. 林业科学, 2025, 61(11): 92-101. |
| [4] | 罗光成,何潇,雷相东,吴璧芸,向玮. 长白落叶松人工林优势高广义代数差分生长模型[J]. 林业科学, 2024, 60(12): 1-12. |
| [5] | 范学星,张慧春,邹义萍,黄玉萍,边黎明. 基于多光谱成像与机器学习的植物叶绿素含量反演[J]. 林业科学, 2023, 59(7): 78-88. |
| [6] | 何静,李新建,朱晋梅,朱光玉. 基于最粗优势木胸径生长的湖南栎类天然林立地质量评价模型[J]. 林业科学, 2022, 58(8): 89-98. |
| [7] | 段光爽,郑亚丽,洪亮,宋新宇,符利勇. 基于潜在生产力的华北落叶松纯林和白桦山杨混交林立地质量评价[J]. 林业科学, 2022, 58(10): 1-9. |
| [8] | 张晓文,于青军,罗桂生,贾茜,吴丹妮,贾忠奎. 平泉油松建筑材林立地类型划分及立地质量评价[J]. 林业科学, 2021, 57(9): 1-12. |
| [9] | 吴恒, 党坤良, 田相林, 孙帅超, 陈书军, 赵鹏祥, 曹田健. 秦岭林区天然次生林与人工林立地质量评价[J]. 林业科学, 2015, 51(4): 78-88. |
| [10] | 张瑜, 贾黎明, 郑聪慧, 张西. 秦岭地区栓皮栎天然次生林地位指数表的编制[J]. 林业科学, 2014, 50(4): 47-54. |
| [11] | 吴舒辞;刘帅;李建军;沈学杰;王传立. 毛竹导热系数非线性拟合的PSO-BP模型[J]. 林业科学, 2012, 48(11): 87-91. |
| [12] | 段杰 马履一 贾黎明 侯雅琴 公宁宁 . 北京低山地区油松人工林立地指数表的编制及应用[J]. 林业科学, 2009, 12(3): 7-12. |
| [13] | 郭晋平 张浩宇;张芸香. 森林立地质量评价的可变生长截距模型与应用[J]. 林业科学, 2007, 43(10): 8-13. |
| [14] | 张伏全 魏汗功 陈远材. 滇西南地区龙竹立地质量评价的研究[J]. , 1994, 30(2): 104-110. |
| [15] | 杨承栋. 对我国森林立地分类与评价问题的几点看法[J]. , 1991, 27(1): 60-64. |
| 阅读次数 | ||||||
|
全文 |
|
|||||
|
摘要 |
|
|||||

