
林业科学 ›› 2026, Vol. 62 ›› Issue (10): 234-250.doi: 10.11707/j.1001-7488.LYKX20250767
• 研究论文 • 上一篇
卢素兰1,2,胡鑫慧1,戴永务1,黄培锋3,黄衍1,2,*( )
)
收稿日期:2025-12-22
出版日期:2026-10-10
发布日期:2026-10-16
通讯作者:
黄衍
E-mail:yanhuangv@126.com
基金资助:
Sulan Lu1,2,Xinhui Hu1,Yongwu Dai1,Peifeng Huang3,Yan Huang1,2,*()
Received:2025-12-22
Online:2026-10-10
Published:2026-10-16
Contact:
Yan Huang
E-mail:yanhuangv@126.com
摘要:
目的: 量化分析油茶产业“生产–加工”两阶段的空间非均衡特征、网络结构规律及其驱动因素,为优化油茶主产区分工协作、提升生产–加工协同效率提供决策参考。方法: 基于2014—2022年我国15个油茶主产省份面板数据,综合使用两阶段加性网络数据包络分析(DEA)模型、空间引力模型、社会网络分析(SNA)与二次指派程序(QAP),构建“生产?加工”双向空间关联网络,系统测度两阶段效率,刻画网络结构特征并识别空间互动的关键驱动因素。结果: 1) 油茶主产区“生产–加工”两阶段存在显著效率错位,形成“前端优、后端弱”与“前端弱、后端优”2类典型格局,原料供给平均效率(0.63)高于加工平均效率(0.60),区域要素与功能错配较为突出;2) 油茶产业空间网络呈放射型扩散结构,形成“中部生产核心–西南协同辐射–东南加工承接”布局,2014—2022年“生产→加工”网络密度由0.338升至0.386、关系数由71增至81,“加工→生产”网络密度由0.333升至0.390、关系数由70增至82,但“生产→加工”网络效率由
中图分类号:
卢素兰,胡鑫慧,戴永务,黄培锋,黄衍. 中国油茶生产–加工双向网络结构及驱动因素[J]. 林业科学, 2026, 62(10): 234-250.
Sulan Lu,Xinhui Hu,Yongwu Dai,Peifeng Huang,Yan Huang. Bidirectional Network Structure and Driving Factors of Camellia oleifera Production and Processing in China[J]. Scientia Silvae Sinicae, 2026, 62(10): 234-250.

图1
理论分析框架"

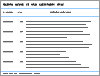
表1
油茶产业链空间关联社会网络分析(SNA)相关指标的含义"
| 分析层面 Analysis level | 社会网络分析指标Social network analysis indicators | 指标定义 Indicator definition | 内涵 Connotation |
| 整体网络特征Overall network characteristics | 网络密度 Network density | 网络中实际存在的关系数量与所有可能关系数量的比值The ratio of the actual number of relationships in the network to the total possible relationships | 衡量油茶主产省份之间空间关联的普遍性和紧密程度,值越高,省际协作更紧密Measures the universality and tightness of spatial connections among major C. oleifera producing provinces. A higher value indicates closer inter-provincial cooperation |
| 网络关系数Number of network | 网络中实际存在的关联(边)的总数量 The total number of actual connections (edges) in the network | 量化省际空间关联的总量规模,关系数增加表明跨区域协作联系在扩展Quantifies the total scale of inter-provincial spatial connections. An increase in relationships indicates the expansion of cross-regional cooperative links | |
| 平均路径长度Average path length | 网络中所有节点对之间最短路径 长度的平均值The average of the shortest path lengths between all pairs of nodes in the network | 资源/要素在省际网络中流动的平均“距离”环节数。值越低,空间流通效率越高The average "distance" (number of links) for the flow of resources/factors in the inter-provincial network. A lower value indicates higher spatial circulation efficiency | |
| 网络效率 Network efficiency | 衡量网络结构冗余度的指标(值越低,冗余连接越多)An indicator measuring network structure redundancy (lower value = more redundant connections) | 评估空间关联网络结构的精炼性,效率下降提示存在重复或低效的流通路径,可能导致效率损失Evaluates the refinement of the spatial connection network structure. A decline in efficiency suggests redundant or inefficient circulation paths, which may lead to efficiency losses | |
| 个体节点特征Individual node characteristics | 点出度 Out-degree | 某节点指向其他节点的关联数量 The number of connections from a node to other nodes | 反映该省份在网络中主动输出资源/要素或影响的强度Reflects the intensity of a province's proactive ability to export resources/factors or exert influence in the network |
| 点入度 In-degree | 某节点被其他节点指向的关联数量 The number of connections pointing to a node from other nodes | 反映该省份在网络中被动接收资源/要素或影响的强度Reflects the intensity of a province's passive reception of resources/factors or external influence in the network | |
| 度中心性 Degree centrality | 标准化后的点出度与点入度之和The standardized sum of out-degree and in-degree | 综合衡量某省份在网络中的总体连接活跃度与影响力,值越高,其枢纽地位越核心。Comprehensively measures a province's overall connection activity and influence in the network. A higher value indicates a more core hub status | |
| 接近中心性Closeness centrality | 某节点到网络中所有其他节点平均 最短路径的倒数 The reciprocal of the average shortest path from a node to all other nodes in the network | 反映某省份在双向网络中获取资源(原料/反馈)或传播影响(输出原料/反馈)的便捷性,值越高,其信息通达与协作效率越高Reflects the convenience of a province in acquiring resources (raw materials/feedback) or disseminating influence (exporting raw materials/feedback) in the bidirectional network. A higher value indicates higher information accessibility and cooperation efficiency | |
| 中介中心性Betweenness centrality | 某节点位于其他节点对之间最短 路径上的频率 The frequency with which a node lies on the shortest paths between other pairs of nodes | 识别在连接不同区域、促进跨省资源流动中起关键“桥梁”用的省份,值越高,控制力越强Identifies provinces that play a key bridging role in connecting different regions and promoting cross-provincial resource flows. A higher value indicates stronger control power | |
| 块模型分析Block Model Analysis | 净溢出板块 Net spillover block | 板块内部连接较弱,向板块外输出 资源远多于接收 A block with weak internal connections, exporting far more resources to outside the block than it receives | 主要承担资源/要素净输出职能,是空间关联网络中的主要供给源Mainly undertakes the function of net resource/factor export and serves as the primary supply source in the spatial connection network |
| 净受益板块 Net benefit block | 板块内部连接较强,接收板块外资源远多于输出A block with strong internal connections, receiving far more resources from outside the block than it exports | 主要承担资源/要素吸纳与转化职能,是空间关联网络中的主要集聚中心Mainly undertakes the function of resource/factor absorption and transformation, acting as the primary agglomeration center in the spatial connection network | |
| 双向溢出板块Bidirectional spillover block | 板块内部连接较强,与板块外联系活跃且输入输出相对均衡A block with strong internal connections, active external links, and relatively balanced input and output | 在省际协作中既输出也输入资源/要素,扮演内部协同与外部衔接的平衡角色Both exports and imports resources/factors in inter-provincial cooperation, playing a balanced role in internal coordination and external connection | |
| 经纪人板块Broker block | 板块内部连接较强,在板块间主要承担资源流动的中介传导作用A block with strong internal connections, mainly undertaking the intermediary role in resource flow between blocks | 在不同功能区域之间发挥关键的连接与协调作用,是网络连通性的重要支撑Exercises key connecting and coordinating functions between different functional regions, serving as an important support for network connectivity |
表1
两阶段加性网络 DEA 模型变量说明"
| 阶段 Stage | 变量符号 Variable symbol | 变量 Variable | 含义说明 Meaning explanation | 均值 Average | 标准差 Standard deviation | 最大值 Maximum value | 最小值 Minimum value |
| 第一阶段(生产端)Phase Ⅰ (production side) | 油茶种植面积 C. oleifera planting area/hm2 | 油茶生产环节土地要素投入规模 Scale of land input in the C. oleifera production process | 265.54 | 368.55 | 0.30 | ||
| 劳动人数投入量Labor input measured in headcount | 测算的油茶产业从业人员数量,用于衡量人力资源配置强度The estimated number of employees in the C. oleifera industry serves as a measure of the intensity of human resource allocation | 144.22 | |||||
| 资金投入量 Amount of capital investment/104 yuan | 来源于《中国林业和草原统计年鉴》中国家油茶基地投资基金,表征资本要素投入水平 Sourced from China Forestry and Grassland Statistical Yearbook, the national C. oleifera base investment fund characterizes the capital?factor input level | 23.00 | |||||
| 油茶籽产量 C. oleifera seed yield/t | 油茶生产环节的中间产出 Intermediate outputs in the C. oleifera production process | 124.00 | |||||
| 第二阶段(加工端)Phase Ⅱ (manufacturing stage) | 中小加工企业数量Number of small and medium-sized processing enterprises | 油茶加工环节的产业组织规模 Industrial organization scale in the C. oleifera processing sector | 45.58 | 52.94 | 263.00 | 1.00 | |
| 机械总动力 Total mechanical power/ 10 MW | 油茶加工环节的技术装备水平 Technical equipment level in the C. oleifera processing stage | 271.19 | 375.42 | 0.26 | |||
| 最终产出Final output | 油茶产业总产值Total output value of C. oleifera industry/ 100 million yuan | 油茶产业链整体价值创造能力 The overall value creation capability of C. oleifera industry chain | 77.37 | 134.62 | 688.63 | 0.04 |
表2
网络构建与 QAP 回归变量说明①"
| 变量类型Variable type | 变量Variable | 含义说明Explanation of meaning | 均值Average | 标准差 Standard deviation | 最大值Maximum value | 最小值Minimum value |
| 因变量Dependent variable | 油茶生产→加工/加工→生产空间关联网络C. oleifera production→processing/manufacturing→spatial production network | 油茶产业空间关联联系强度矩阵Spatial correlation matrix for the C. oleifera industry | — | — | — | — |
| 自变量Independent variable | 城镇化水平Urbanization level(%) | 各省城镇人口占总人口比重 Percentage of urban population in total population by province | 55 | 10 | 75 | 34 |
| 人均GDP GDP per capita/104yuan | 各省经济发展水平Level of economic development in each province | 5.16 | 2.26 | 12.36 | 1.29 | |
| 交通通达性 Transportation accessibility/(km·km–2) | 公路里程与省域面积之比Ratio of highway mileage to provincial area | 1.15 | 0.39 | 2.30 | 0.50 | |
| 油茶从业人员C. oleifera industry personnel | 测算的油茶产业从业人员数量,用于衡量人力资源配置强度The estimated number of employees in C. oleifera industry serves as a measure of the intensity of human resource allocation | 144.22 | ||||
| 机械总动力Total mechanical power/10 MW | 油茶加工环节的技术装备水平Technical equipment level in the C.oleifera processing stage | 271.19 | 375.42 | 0.26 | ||
| 油茶种植面积C. oleifera planting area/hm2 | 油茶生产环节土地要素投入规模 Scale of land input in the C. oleifera production process | 265.54 | 368.55 | 0.30 | ||
| 电商发展水平E-commerce sales/100 million yuan | 各省电子商务业务销售总额Provincial e-commerce transaction value | 5669.53 | ||||
| 地理邻接关系Geographical proximity | 省域之间是否存在地理邻接Geographical contiguity exists between provinces | — | — | — | — |

图2
油茶主产区2014—2022年生产效率(A)和加工效率(B)"


图3
2022年油茶产业双向空间关联网络 A: 中国油茶产业生产→加工网络 Production-to-processing network of China’s C. oleifera industry; B: 中国油茶产业加工→生产网络 Processing-to-production network of China’s C. oleifera industry."


图4
油茶产业整体网络分析指标"

表3
油茶产业生产→加工网络个体指标"
| 省(自治区、 直辖市)Province (autonomous regions, and municipalities) | 点出度 Out-degree | 点入度 In-degree | 度中心性 Degree centrality | 接近中心性 Closeness centrality | 中介中心性 Betweenness centrality | |||||||||
| 生产→ 加工 Production→ processing | 加工→ 生产 Processing→ production | 生产→ 加工 Production→ processing | 加工→ 生产 Processing→ production | 生产→ 加工 Production→ processing | 加工→ 生产 Processing→ production | 生产→ 加工 Production→ processing | 加工→ 生产 Processing→ production | 生产→ 加工 Production→ processing | 加工→ 生产 Processing→ production | |||||
| 浙江 Zhejiang | 5 | 4 | 5 | 6 | 0.67 | 0.67 | 0.59 | 0.56 | 11.52 | 7.05 | ||||
| 安徽 Anhui | 4 | 4 | 4 | 5 | 0.53 | 0.60 | 0.52 | 0.52 | 2.46 | 6.15 | ||||
| 福建 Fujian | 3 | 3 | 8 | 5 | 0.73 | 0.53 | 0.72 | 0.56 | 10.14 | 2.90 | ||||
| 江西 Jiangxi | 8 | 5 | 3 | 5 | 0.73 | 0.67 | 0.46 | 0.56 | 5.33 | 4.17 | ||||
| 河南 Henan | 2 | 4 | 7 | 7 | 0.60 | 0.73 | 0.68 | 0.64 | 4.24 | 14.06 | ||||
| 湖北 Hubei | 10 | 12 | 8 | 6 | 1.20 | 1.20 | 0.68 | 0.58 | 48.28 | 22.5 | ||||
| 湖南 Hunan | 10 | 12 | 3 | 7 | 0.87 | 1.27 | 0.52 | 0.61 | 4.16 | 30.19 | ||||
| 广东 Guangdong | 2 | 4 | 6 | 4 | 0.53 | 0.53 | 0.65 | 0.54 | 4.57 | 7.69 | ||||
| 广西 Guangxi | 6 | 6 | 5 | 5 | 0.73 | 0.73 | 0.54 | 0.52 | 15.54 | 17.28 | ||||
| 海南 Hainan | 0 | 1 | 5 | 6 | 0.33 | 0.47 | 0.58 | 0.58 | 0 | 0.50 | ||||
| 重庆 Chongqing | 8 | 7 | 5 | 7 | 0.87 | 0.93 | 0.57 | 0.67 | 9.95 | 24.61 | ||||
| 四川 Sichuan | 6 | 4 | 6 | 7 | 0.8 | 0.73 | 0.62 | 0.67 | 5.47 | 6.44 | ||||
| 贵州 Guizhou | 8 | 7 | 5 | 4 | 0.87 | 0.73 | 0.59 | 0.54 | 6.93 | 7.11 | ||||
| 云南 Yunnan | 6 | 6 | 5 | 5 | 0.73 | 0.73 | 0.57 | 0.54 | 5.04 | 8.70 | ||||
| 陕西 Shaanxi | 3 | 3 | 6 | 3 | 0.60 | 0.40 | 0.62 | 0.50 | 4.38 | 0.64 | ||||
表4
油茶生产→加工空间关联网络各板块效应溢出分析①"
| 板块 Block | 接收关系 Number of received relationships | 成员数目 Number of members | 接受板块外关系数 Number of relationships received from outside the block | 溢出板块外关系数 Number of relationships spilled over to outside the block | 期望内部 比例 Expected internal ratio (%) | 实际内部 关系比例 Actual internal relationship ratio (%) | 板块特征 Block characteristics | |||
| Ⅰ | Ⅱ | Ⅲ | Ⅳ | |||||||
| Ⅰ | 0 | 3 | 5 | 0 | 3 | 16 | 8 | 0.14 | 0.27 | 浄收益 Net benefit |
| Ⅱ | 12 | 10 | 0 | 10 | 4 | 8 | 22 | 0.21 | 0.15 | 净溢出 Net spillover |
| Ⅲ | 3 | 1 | 5 | 4 | 4 | 17 | 8 | 0.21 | 0.33 | 净收益Net benefit |
| Ⅳ | 1 | 4 | 12 | 7 | 4 | 14 | 17 | 0.21 | 0.19 | 双向溢出Bidirectional spillover |
表5
油茶生产→加工空间关联网络各板块密度矩阵与像矩阵①"
| 板块 Block | 密度矩阵 Density matrix | 像矩阵 Image matrix | |||||||
| Ⅰ | Ⅱ | Ⅲ | Ⅳ | Ⅰ | Ⅱ | Ⅲ | Ⅳ | ||
| Ⅰ | 0 | 0.25 | 0.417 | 0 | 0 | 0 | 1 | 0 | |
| Ⅱ | 1 | 0.833 | 0 | 0.625 | 1 | 1 | 0 | 1 | |
| Ⅲ | 0.25 | 0.063 | 0.417 | 0.25 | 0 | 0 | 1 | 0 | |
| Ⅳ | 0.083 | 0.25 | 1 | 0.583 | 0 | 0 | 1 | 1 | |
表6
油茶加工→生产空间关联网络各板块效应溢出分析①"
| 板块 Block | 接收关系数 Number of received relationships | 成员数目 Number of members | 接受板块外关系数 Number of relationships received from outside the block | 溢出板块外关系数 Number of relationships spilled over to outside the block | 期望内部 比例 Expected internal ratio (%) | 实际内部关系 比例 Actual internal relationship ratio (%) | 板块特征 Block characteristics | |||
| Ⅰ | Ⅱ | Ⅲ | Ⅳ | |||||||
| Ⅰ | 17 | 8 | 5 | 7 | 5 | 2 | 20 | 0.286 | 0.200 | 净溢出Net spillover |
| Ⅱ | 0 | 0 | 1 | 0 | 2 | 10 | 1 | 0.071 | 0.667 | 净收益Net benefit |
| Ⅲ | 0 | 1 | 5 | 2 | 4 | 8 | 3 | 0.214 | 0.571 | 经纪人 Broker |
| Ⅳ | 2 | 1 | 2 | 8 | 4 | 9 | 5 | 0.214 | 0.444 | 双向溢出 Bidirectional spillover |
表7
油茶加工→生产空间关联网络各板块密度矩阵与像矩阵①"
| 板块 Block | 密度矩阵 Density matrix | 像矩阵 Image matrix | |||||||
| Ⅰ | Ⅱ | Ⅲ | Ⅳ | Ⅰ | Ⅱ | Ⅲ | Ⅳ | ||
| Ⅰ | 0.177 | 0.386 | 0.105 | 0 | 0 | 1 | 0 | 0 | |
| Ⅱ | 0.023 | 0.208 | 2.349 | 0.41 | 0 | 0 | 1 | 1 | |
| Ⅲ | 0.489 | 0.543 | 1.666 | 0.325 | 1 | 1 | 1 | 0 | |
| Ⅳ | 0.018 | 0.204 | 0.338 | 1.147 | 0 | 0 | 0 | 1 | |

图5
油茶生产→加工空间关联网络四大板块之间的传递关系"


图6
油茶加工→生产空间关联网络四大板块之间的传递关系"

表8
油茶生产→加工空间关联关系的驱动因素回归结果①"
| 变量 Variable | 2014 | 2017 | 2022 |
| 城镇化 Urbanization | 0.32** | ?0.26* | ?0.048 |
| 从业人员 Employment personnel | ?0.24** | 0.219* | ?0.677* |
| 地理邻接关系 Geographical adjacency | 0.451*** | 0.259*** | 0.237*** |
| 机械化水平 Mechanical power | ?0.101 | 1.129* | 1.10** |
| 人均GDP Per capita GDP | ?0.28* | 0.151 | 0.189* |
| 种植面积Planting area | 0.284** | ?1.133* | ?0.231* |
| 电子商务水平E-commerce sales | 0.236* | 0.186** | 0.136** |
| R2 | 0.341 | 0.215 | 0.208 |
| 调整后 R2 Adjusted R2 | 0.319 | 0.192 | 0.181 |
| 样本数 Sample size | 210 | 210 | 210 |
表9
油茶加工→生产空间关联关系的驱动因素回归结果①"
| 变量 Variables | 2014 | 2017 | 2022 |
| 城镇化Urbanization | 0.213* | ?0.288* | ?0.263* |
| 地理邻接关系 Geographical adjacency | 0.463*** | 0.365*** | 0.126* |
| 机械化水平 Mechanical power | 0.144* | 0.165* | 0.204** |
| 交通通达性 Transportation accessibility | ?0.038 | ?0.126* | 0.263* |
| 人均GDP Per capita GDP | ?0.156 | 0.208* | 0.239* |
| 电子商务水平E-commerce sales | 0.04 | 0.17** | 0.15** |
| R2 | 0.258 | 0.227 | 0.136 |
| 调整后 R2 Adjusted R2 | 0.23 | 0.208 | 0.115 |
| 样本数Sample size | 210 | 210 | 210 |
|
柏建成, 张利霞, 严 翔, 等. 长江经济带绿色金融发展的空间关联结构及驱动因素研究. 管理评论, 2024, 36 (4): 63- 74.
doi: 10.14120/j.cnki.cn11-5057/f.2024.04.005 |
|
|
Bai J C, Zhang L X, Yan X, et al. The spatial network structure and driving factors of green finance development in Yangtze River economic belt. Management Review, 2024, 36 (4): 63- 74.
doi: 10.14120/j.cnki.cn11-5057/f.2024.04.005 |
|
| 曹 杰, 林正雨, 陈春燕, 等. 基于地理探测器的四川省茶产业时空格局变化及驱动因素研究. 中国生态农业学报(中英文), 2023, 31 (4): 619- 631. | |
| Cao J, Lin Z Y, Chen C Y, et al. Spatiotemporal pattern of the tea industry in Sichuan Province and its driving forces based on the geographical detector. Chinese Journal of Eco-Agriculture, 2023, 31 (4): 619- 631. | |
| 陈永忠, 邓绍宏, 陈隆升, 等. 油茶产业发展新论. 南京林业大学学报(自然科学版), 2020, 44 (1): 1- 10. | |
| Chen Y Z, Deng S H, Chen L S, et al. A new view on the development of oil tea Camellia industry. Journal of Nanjing Forestry University (Natural Sciences Edition), 2020, 44 (1): 1- 10. | |
| 范丽美, 侯黔灵. 2024,. 贵州省油茶加工业现状、存在问题及发展对策. 中国油料作物学报, 46(2): 260−266. | |
| Fan L M, Hou Q L. 2024. Current development of Camellia oleifera processing industry in Guizhou Province. Chinese Journal of Oil Crop Sciences, 46(2): 260−266.[in Chinese] | |
| 李文瑛, 宋长鸣. 2017. 价格波动背景下生猪产业链利益分配格局: 基于两种养殖模式产业链的调研. 华中农业大学学报(社会科学版)(2): 8−14, 130. | |
| Li W Y, Song C M. 2017. Study on benefit distribution of swine industry chain under price volatility: based on survey of two raising models of industry chain. Journal of Huazhong Agricultural University (Social Sciences Edition)(2): 8−14, 130. [in Chinese] | |
| 李优树, 冉 丹. 2021. 石油产业链贸易网络及其影响因素研究: 以“一带一路”沿线国家为例. 经济问题, (9): 111−118. | |
| Li Y S, Ran D. 2021. Network structure and influence factors of oil industry chain trade about the countries along “the Belt and Road”. On Economic Problems, (9): 111−118. [in Chinese] | |
|
林颖怡, 汪 勇, 李 颖. 广东河源特色油茶产业现状与高质量发展对策. 中国油脂, 2024, 49 (6): 6- 10, 17.
doi: 10.19902/j.cnki.zgyz.1003-7969.230548 |
|
|
Lin Y Y, Wang Y, Li Y. Current situation and high-quality development strategy of special Camellia oleifera industry in Heyuan, Guangdong. China Oils and Fats, 2024, 49 (6): 6- 10, 17.
doi: 10.19902/j.cnki.zgyz.1003-7969.230548 |
|
| 刘 军. 2014. 整体网分析UCINET软件实用指南(第2版). 上海: 格致出版社. | |
| Liu J. 2014. Lectures on whole network approach: a practical guide to UCINET(2nd ed). Shanghai: Gezhi Publishing House. [in Chinese] | |
| 龙文进, 张玉梅, 樊胜根. 2024. 构建多元化食物供给体系的战略思考. 中国发展观察(S1): 81−86. | |
| Long W J, Zhang Y M, Fan S G. 2024. Strategic thinking on constructing diversified food supply system. China Development Observation(S1): 81−86. [in Chinese] | |
| 吕承超, 姜延杰, 何加豪, 等. 2025. 创新驱动下的数据要素流动网络演化机制研究. 科研管理, 46(6): 10−20. | |
| Lü C C, Jiang Y J, He J H, et al. 2025. Research on the evolution mechanism of data element flow network driven by innovation. Science Research Management. 46(6): 10−20. [in Chinese] | |
|
彭迪云, 周美楠, 邓语宣. 产业空间关联网络对城市群经济韧性的影响: 基于长江中游城市群数据的实证分析. 南昌大学学报(理科版), 2024, 48 (3): 295- 306.
doi: 10.13764/j.cnki.ncdl.20240515.001 |
|
|
Peng D Y, Zhou M N, Deng Y X. The impact of industrial spatial linkage network on the economic resilience of urban agglomeration: an empirical analysis based on the data of urban agglomeration in the middle reaches of the Yangtze River. Journal of Nanchang University (Natural Science), 2024, 48 (3): 295- 306.
doi: 10.13764/j.cnki.ncdl.20240515.001 |
|
|
彭红枫, 王雪童, 马世群. RCEP成员国农产品贸易网络的动态结构及其影响因素分析. 统计研究, 2024, 41 (1): 71- 84.
doi: 10.19343/j.cnki.11-1302/c.2024.01.006 |
|
|
Peng H F, Wang X T, Ma S Q. Analysis on the dynamic structure and influencing factors of agricultural product trade network of RCEP. Statistical Research, 2024, 41 (1): 71- 84.
doi: 10.19343/j.cnki.11-1302/c.2024.01.006 |
|
| 綦 勇, 李思晗, 石俊国. 纵向关系网络中结构洞对企业创新投入与产出的影响. 科学学与科学技术管理, 2017, 38 (7): 53- 61. | |
| Qi Y, Li S H, Shi J G. The influence of structural holes on R & D input and output in vertical network. Science of Science and Management of S & T, 2017, 38 (7): 53- 61. | |
| 苏 屹, 樊起铭. 2025. 区域绿色发展水平的测度及其空间网络结构研究. 管理评论, 37(2): 19−30. | |
| Su Y, Fan Q M. Measurement of regional green development and exploration of its spatial network. Management Review, 2025, 37(2): 19−30. [in Chinese] | |
|
王火根, 肖丽香. 油茶产业综合效益系统动力学仿真研究. 林业经济, 2020, 42 (8): 73- 85.
doi: 10.13843/j.cnki.lyjj.20201103.003 |
|
|
Wang H G, Xiao L X. Study on system dynamics simulation of comprehensive benefits of Camellia oleifera industry. Forestry Economics, 2020, 42 (8): 73- 85.
doi: 10.13843/j.cnki.lyjj.20201103.003 |
|
| 王金凤, 谭新建, 吴喜昌, 等. 我国油茶产业发展现状与对策建议. 世界林业研究, 2020, 33 (6): 80- 85. | |
| Wang J F, Tan X j, Wu X C, et al. Development status and suggestions of Camellia industry in China. World Forestry Research, 2020, 33 (6): 80- 85. | |
| 杨 瑾,王忠伟,庞 燕.2021.基于熵权TOPSIS法的油茶产业发展绩效评价.中南林业科技大学学报,41(12): 168−177. | |
| Yang J, Wang Z W, Pang Y. Performance evaluation of camellia industry development based on entropy TOPSIS method. Journal of Central South University of Forestry and Technology, 2021,, 41(12): 168−177 [in Chinese] | |
| 杨 鑫, 李典潼, 曹建民. 中国南方肉牛生产空间关联分析及产业发展路径研究. 中国农业资源与区划, 2023, 44 (4): 214- 223. | |
| Yang X, Li D T, Cao J M. Spatial correlation analysis and industrial development path of beef cattle production in South China. Chinese Journal of Agricultural Resources and Regional Planning, 2023, 44 (4): 214- 223. | |
| 袁 斌, 张燕媛, 陈 超. 中国苹果产业格局演化及机制分析: 基于农户决策的微观视角. 干旱区资源与环境, 2017, 31 (6): 32- 37. | |
| Yuan B, Zhang Y Y, Chen C. Spatial pattern evolution and its driving factors for apple industry in China-Based on micro perspective of farmers' decision making. Journal of Arid Land Resources and Environment, 2017, 31 (6): 32- 37. | |
| 岳诺亚, 侯俊军. 中国新闻出版业产业关联的网络结构特征研究: 基于投入产出与社会网络分析. 新闻与传播研究, 2025, 32 (8): 94- 111, 128. | |
| Yue N Y, Hou J J. The structural characteristics of newspaper publishing industrial linkages in China: based on input-output and social network analysis. Journal of Journalism & Communication Studies, 2025, 32 (8): 94- 111, 128. | |
| 张 辉, 姜亚洲, 刘尊雷, 等. 湖北省水产养殖水体资源和产业地理分布格局. 中国农业资源与区划, 2019, 40 (7): 181- 187. | |
| Zhang H, Jiang Y Z, Liu Z L, et al. The spatial distribution pattern of water resources and industries for aquaculture in Hubei Province. Chinese Journal of Agricultural Resources and Regional Planning, 2019, 40 (7): 181- 187. | |
|
张立伟, 王辽卫. 我国油茶产业的发展现状与展望. 中国油脂, 2021, 46 (6): 6- 9, 27.
doi: 10.19902/j.cnki.zgyz.1003-7969.2021.06.002 |
|
|
Zhang L W, Wang L W. Prospect and development status of oil-tea Camellia industry in China. China Oils and Fats, 2021, 46 (6): 6- 9, 27.
doi: 10.19902/j.cnki.zgyz.1003-7969.2021.06.002 |
|
| 张 洋, 严茂林, 葛玮玮, 等. 我国食用植物油供给现状分析及未来发展战略研究. 中国油脂, 2022, 47 (4): 1- 8. | |
| Zhang Y, Yan M L, Ge W W, et al. Present situation of edible vegetable oil supply in China and its future development strategy. China Oils and Fats, 2022, 47 (4): 1- 8. | |
| 张兆旭. 2024. 广西油茶产业时空格局演化特征及其影响因素分析. 南宁: 南宁师范大学. | |
| Zhang Z X. 2024. Spatiotemporal evolution characteristics and influencing factors of the Camellia oleifera industry in Guangxi. Nanning: Nanning Normal University. [in Chinese] | |
|
朱湖英, 何佳敏, 张四梅. 中国粮食产业链龙头企业的空间格局演变特征及影响因素研究. 中国农业资源与区划, 2025, 46 (7): 98- 110.
doi: 10.7621/cjarrp.1005-9121.20250708 |
|
|
Zhu H Y, He J M, Zhang S M. The evolution characteristics and influencing factors of the spatial patten of leading enterprises in China’s grain industry chain. Chinese Journal of Agricultural Resources and Regional Planning, 2025, 46 (7): 98- 110.
doi: 10.7621/cjarrp.1005-9121.20250708 |
|
|
朱震锋, 张 创, 吴翔宇, 等. 我国油茶产业发展效率评价研究: 来自15个油茶主产区的实证分析. 林产工业, 2024, 61 (12): 79- 82,88.
doi: 10.19531/j.issn1001-5299.202412013 |
|
|
Zhu Z F, Zhang C, Wu X Y, et al. Analysis on the spatial evolution of China’s Camellia oleifera industry efficiency: empirical research from 15 main producing areas of Camellia oleifera. China Forest Products Industry, 2024, 61 (12): 79- 82,88.
doi: 10.19531/j.issn1001-5299.202412013 |
|
|
Chen Y, Cook W D, Zhu J. Deriving the DEA frontier for two-stage processes. European Journal of Operational Research, 2010, 202 (1): 138- 142.
doi: 10.1016/j.ejor.2009.05.012 |
|
|
Doreian P, Conti N. Social context, spatial structure and social network structure. Social Networks, 2012, 34 (1): 32- 46.
doi: 10.1016/j.socnet.2010.09.002 |
|
| Helfat, C. E. 2003. Dynamic capabilities: understanding strategic change in organizations. Strategic Management Journal, 24(10): 997−1010. | |
| Krugman P. 1991. Increasing returns and economic geography. Journal of Political Economy, 99(3): 483−499. | |
| Qin P J, Shen J, Wei J, et al. 2024. A critical review of the bioactive ingredients and biological functions of Camellia oleifera oil. Current Research in Food Science, 8: 100753. | |
| Smith A. 1776. An inquiry into the nature and causes of the wealth of nations. London: W. Strahan and T. Cadell. | |
|
Swinnen J F M, Maertens M. Globalization, privatization, and vertical coordination in food value chains in developing and transition countries. Agricultural Economics, 2007, 37 (s1): 89- 102.
doi: 10.1111/j.1574-0862.2007.00237.x |
|
| Trienekens J H. Agricultural value chains in developing countries: a framework for analysis. International Food and Agribusiness Management Review, 2011, 14 (2): 51- 82. | |
| Williamson O E. The economics of organization: The transaction cost approach. American Journal of Sociology, 1981, 87 (3): 548- 577. | |
| Williamson O E. 1985,. The economic institutions of capitalism: firms, markets, relational contracting. New York: Free Press. |
| No related articles found! |
| 阅读次数 | ||||||
|
全文 |
|
|||||
|
摘要 |
|
|||||

