
Scientia Silvae Sinicae ›› 2023, Vol. 59 ›› Issue (10): 22-31.doi: 10.11707/j.1001-7488.LYKX20220419
• Frontier & focus: characteristics and warning of forest lightning fire • Previous Articles Next Articles
Wei Li1,2( ),Lifu Shu1,2,Mingyu Wang1,2,*,Weike Li1,2,Shangbo Yuan3,Liqing Si1,2,Fengjun Zhao1,2,Jiajun Song3,Yahui Wang3
Received:2022-06-17
Accepted:2023-10-25
Online:2023-10-25
Published:2023-11-01
Contact:
Mingyu Wang
E-mail:1339159507@qq.com
CLC Number:
Wei Li,Lifu Shu,Mingyu Wang,Weike Li,Shangbo Yuan,Liqing Si,Fengjun Zhao,Jiajun Song,Yahui Wang. Temporal and Spatial Distribution and Dynamic Characteristics of Lightning Fires in the Daxing’anling Mountains from 1980 to 2021[J]. Scientia Silvae Sinicae, 2023, 59(10): 22-31.
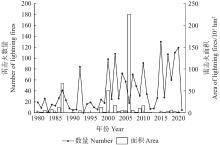
Fig.1
The distribution of annual number and area of lightning fires in Daxing’anling Mountains from 1980 to 2021"
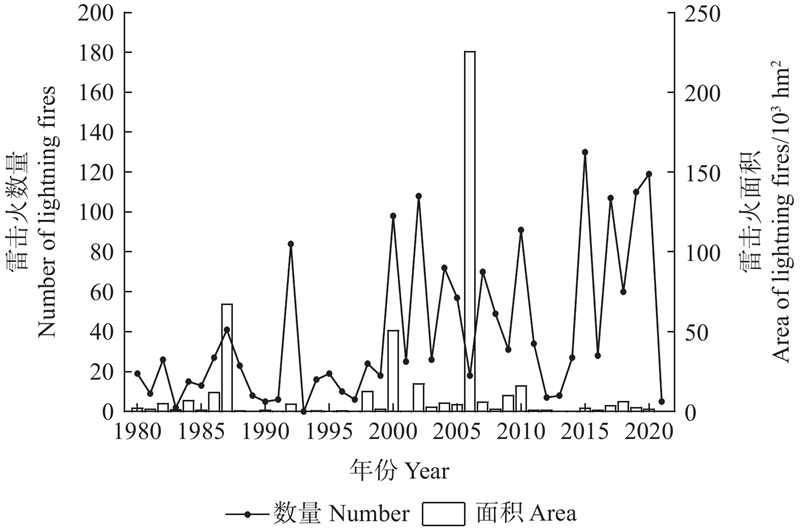
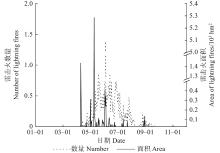
Fig.2
Distribution of the daily number and area of lightning fires in the Daxing’anling Mountains from 1980 to 2021"
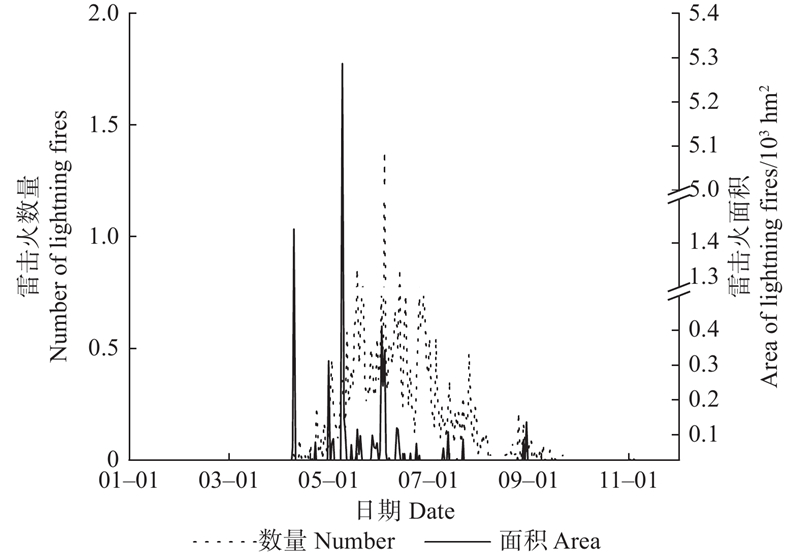
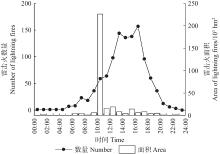
Fig.3
Intraday distribution of the number and area of lightning fires in Daxing’anling Mountains from 1980 to 2021"

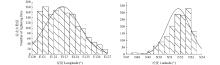
Fig.4
Lightning fires distribution along latitude and longitude in the Da xing’anling Mountains from 1980 to 2021"

Table 1
The number and area of lightning fires in different forestry bureau/counties in the Daxing’anling Mountains from 1980 to 2021"
| 区域 Region | 林业局/县 Forestry bureau/county | 面积 Area/hm2 | 雷击火数量 Number of lightning fires | 雷击火面积 Area of lightning fire/hm2 | 雷击火密度 Density of lightning fire / [times·(104 hm2)?1] | 雷击火面积占比 Area ratio of lightning fire (%) |
| 内蒙古 Inner Mongolia | 阿尔山 Aershan | 483 182 | 11 | 12 401.40 | 0.228 | 2.567 |
| 永安山 Yonganshan | 283 525 | 66 | 8 709.79 | 2.328 | 3.072 | |
| 汗马 Hanma | 107 332 | 14 | 8 490.70 | 1.304 | 7.911 | |
| 乌玛 Wuma | 375 795 | 117 | 8 239.58 | 3.113 | 2.193 | |
| 奇乾 Qiqian | 287 834 | 47 | 7 612.84 | 1.633 | 2.645 | |
| 根河 Genhe | 630 129 | 43 | 6 395.12 | 0.682 | 1.015 | |
| 满归 Mangui | 389 948 | 73 | 5 546.02 | 1.872 | 1.422 | |
| 图里河 Tulihe | 379 201 | 21 | 5 051.60 | 0.554 | 1.332 | |
| 金河 Jinhe | 517 038 | 38 | 4 989.18 | 0.735 | 0.965 | |
| 毕拉河 Bilahe | 471 175 | 15 | 3 725.56 | 0.318 | 0.791 | |
| 大杨树 Dayangshu | 790 291 | 19 | 2 816.53 | 0.240 | 0.356 | |
| 莫尔道嘎 Moerdaoga | 454 378 | 72 | 2 636.65 | 1.585 | 0.580 | |
| 乌尔旗汉 Uerqihan | 593 177 | 19 | 2 531.55 | 0.320 | 0.427 | |
| 阿龙山 Alongshan | 357 061 | 40 | 2 171.86 | 1.120 | 0.608 | |
| 吉文 Jiwen | 361 573 | 27 | 1 678.39 | 0.747 | 0.464 | |
| 甘河 Ganhe | 357 390 | 27 | 1 417.87 | 0.755 | 0.397 | |
| 克一河 Keyihe | 214 442 | 21 | 1 227.20 | 0.979 | 0.572 | |
| 北大河 Beidahe | 363 770 | 12 | 908.87 | 0.330 | 0.250 | |
| 库都尔 Kuduer | 501 705 | 30 | 793.82 | 0.598 | 0.158 | |
| 诺敏经营所 Nuomin Management Station | 148 792 | 16 | 544.30 | 1.075 | 0.366 | |
| 额尔古纳 Erguna | 124 417 | 17 | 480.04 | 1.366 | 0.386 | |
| 得耳布尔 Derbur | 255 422 | 9 | 438.64 | 0.352 | 0.172 | |
| 绰源 Chuoyuan | 313 276 | 4 | 104.93 | 0.128 | 0.033 | |
| 阿里河 Alihe | 468 366 | 11 | 66.20 | 0.235 | 0.014 | |
| 绰尔 Chuor | 426 245 | 4 | 26.66 | 0.094 | 0.006 | |
| 伊图里河Yitulihe | 144 458 | 6 | 4.61 | 0.415 | 0.003 | |
| 总计Total | 779 | 89 009.89 | ||||
| 均值Average | 29.96 | 3 423.46 | 0.889 | 0.011 | ||
| 黑龙江 Heilongjiang | 松岭 Songling | 676 361 | 59 | 229 511.67 | 0.872 | 33.933 |
| 呼中 Huzhong | 769 522 | 132 | 27 600.01 | 1.715 | 3.587 | |
| 西林吉Xilinji | 731 624 | 108 | 10 758.44 | 1.476 | 1.470 | |
| 十八站 Shibazhan | 633 165 | 44 | 8 373.12 | 0.695 | 1.322 | |
| 加格达奇 Jiagedaqi | 965 844 | 32 | 7 540.23 | 0.331 | 0.781 | |
| 塔河 Tahe | 922 620 | 81 | 6 792.31 | 0.878 | 0.736 | |
| 呼中自然保护区 Huzhong Nature Reserve | 167 627 | 24 | 5 906.17 | 1.432 | 3.523 | |
| 韩家园 Hanjiayuan | 906 314 | 61 | 4 180.53 | 0.673 | 0.461 | |
| 呼玛县 Huma County | 251 026 | 13 | 3 642.95 | 0.518 | 1.451 | |
| 阿木尔 Amur | 554 721 | 57 | 2 392.78 | 1.028 | 0.431 | |
| 南瓮河自然保护区 Nanwenghe Nature Reserve | 229 030 | 9 | 2 217.01 | 0.393 | 0.968 | |
| 图强 Tuqiang | 505 791 | 70 | 1 776.11 | 1.384 | 0.351 | |
| 新林 Xinlin | 869 681 | 91 | 1 485.33 | 1.046 | 0.171 | |
| 双河自然保护区 Shuanghe Nature Reserve | 88 861 | 9 | 995.87 | 1.013 | 1.121 | |
| 塔河县 Tahe County | 36 860 | 3 | 46.45 | 0.814 | 0.126 | |
| 漠河县 Mohe County | 36 409 | 3 | 11.68 | 0.824 | 0.032 | |
| 总计Total | 796 | 313 230.70 | ||||
| 均值Average | 49.75 | 19 576.96 | 0.943 | 0.032 |
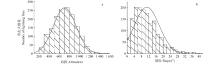
Fig.5
Distribution of lightning fires along slope gradient and altitude in the Daxing’anling Mountains from 1980 to 2021"

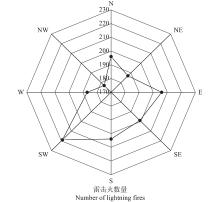
Fig.6
Distribution of number of lightning fires along slope aspect in the Daxing’anling Mountains from 1980 to 2021"

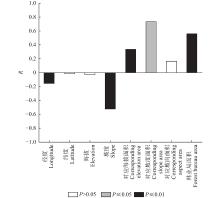
Fig.7
Person correlation analysis between the number of lightning fires and spatial factor"
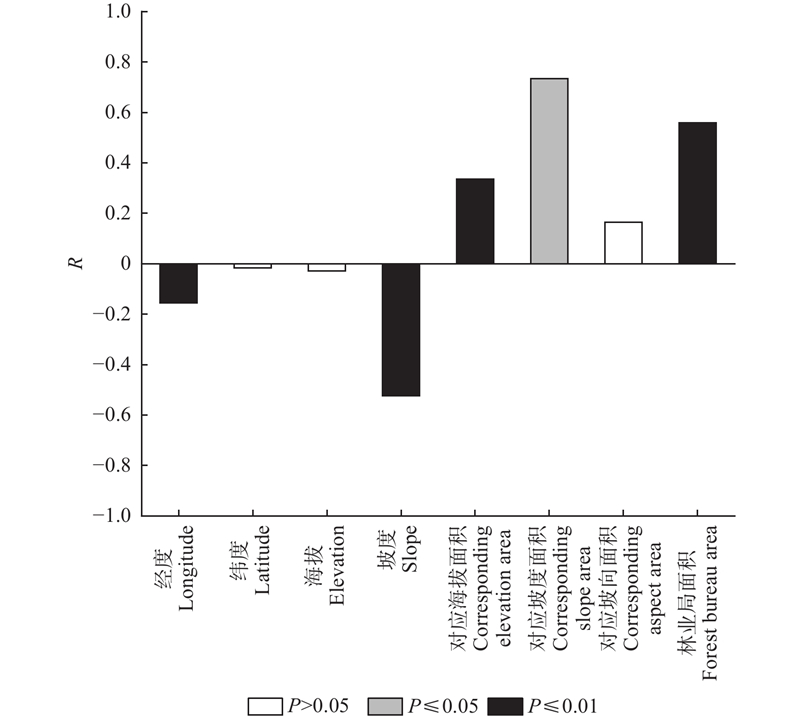
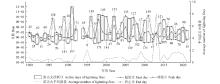
Fig.8
Dynamic features of lightning fires in the Daxing’anling Mountains from 1980 to 2021"
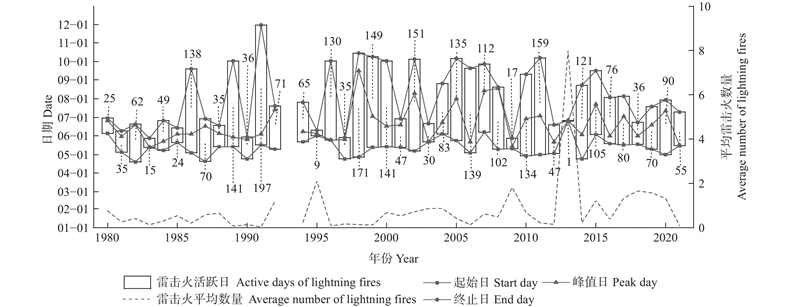
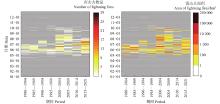
Fig.9
Daily distribution of the number and area of lightning fires in the Daxing’anling Mountains in different periaaods from 1980 to 2021"
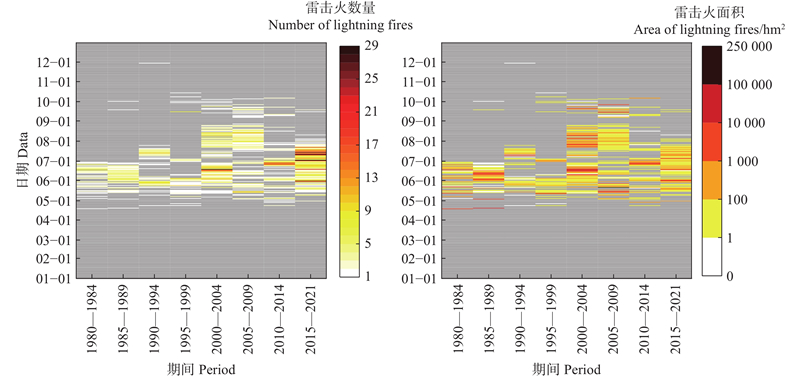
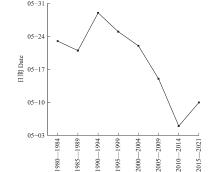
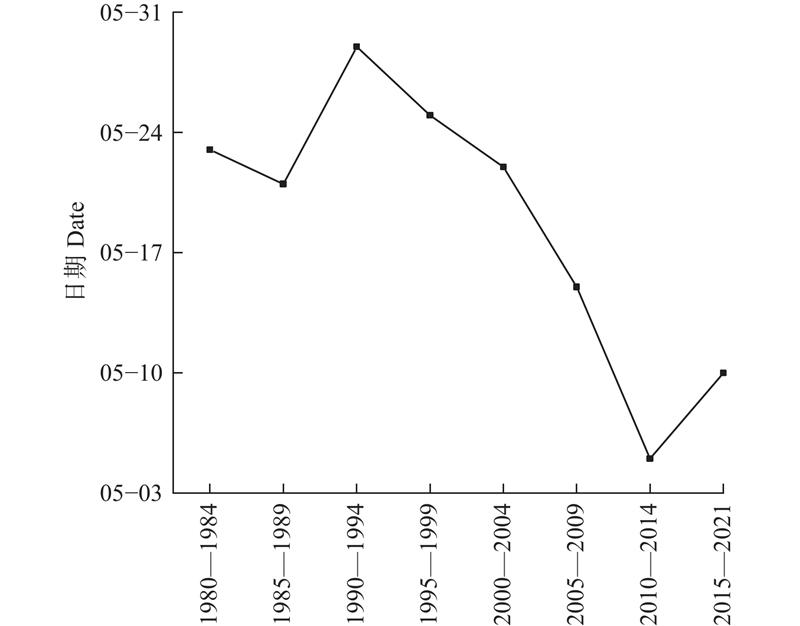
Fig.10
Variation of the first peak date value of lightning fires in the Daxing’anling Mountains in different periods from 1980 to 2021"
|
杜春英, 李 帅, 刘 丹, 等. 大兴安岭地区森林雷击火发生的时空分布. 自然灾害学报, 2010, 19 (3): 72−76.
doi: 10.13577/j.jnd.2010.0312 |
|
|
Du C Y, Li S, Liu D, et al. Spatiotemporal distribution of lightning-caused forest fires in Daxinganling area. Journal of Natural Disasters, 2010, 19 (3): 72−76.
doi: 10.13577/j.jnd.2010.0312 |
|
|
冯俊伟, 沈 浩, 梁 栋. 森林雷击火发生规律研究. 中山大学学报(自然科学版), 2021, 60 (3): 131- 137.
doi: 10.13471/j.cnki.acta.snus.2019.11.06.2019b113 |
|
|
Feng J, Shen H, Liang D. Study on the occurrence law of forest lightning fire. Acta Scientiarum Naturalium Universitatis Sunyatseni(Natural Science Edtion), 2021, 60 (3): 131- 137.
doi: 10.13471/j.cnki.acta.snus.2019.11.06.2019b113 |
|
|
郭福涛, 胡海清, 金 森, 等. 基于负二项和零膨胀负二项回归模型的大兴安岭地区雷击火与气象因素的关系. 植物生态学报, 2010, 34 (5): 571- 577.
doi: 10.3773/j.issn.1005-264x.2010.05.011 |
|
|
Guo F T, Hu H Q, Jin S, et al. Relationship between forest lighting fire occurrence and weather factors in Daxing’an Mountains based on negative binomial model and zero–inflated negative binomial models. Chinese Journal of Plant Ecology, 2010, 34 (5): 571- 577.
doi: 10.3773/j.issn.1005-264x.2010.05.011 |
|
|
郭福涛, 胡海清, 马志海. 应用空间点模式方法研究大兴安岭雷击火空间分布格局. 生态学报, 2009, 29 (12): 6741- 6747.
doi: 10.3321/j.issn:1000-0933.2009.12.051 |
|
|
Guo F T, Hu H Q, Ma Z H. Spatial point process for spatial distribution pattern of lightning-caused forest fires in DaXing'an Mountains.. Chinese Journal of Ecology, 2009, 29 (12): 6741- 6747.
doi: 10.3321/j.issn:1000-0933.2009.12.051 |
|
|
舒立福, 王明玉, 田晓瑞, 等. 我国大兴安岭呼中林区雷击火发生火环境研究. 林业科学, 2003, 39 (6): 94- 99.
doi: 10.3321/j.issn:1001-7488.2003.06.016 |
|
|
Shu L F, Wang M Y, Tian X R, et al. The fire environment mechanism of lightning fire formed for daxing'an mountains. Scientia Silvae Sinicae, 2003, 39 (6): 94- 99.
doi: 10.3321/j.issn:1001-7488.2003.06.016 |
|
| 舒 洋, 孙子瑜, 张 恒. 世界森林雷击火研究现状和展望. 世界林业研究, 2022, 35 (2): 34- 40. | |
| Shu Y, Sun Z Y, Zhang H. Research on lightning fire in forest: current status and outlook. World Forestry Research, 2022, 35 (2): 34- 40. | |
|
孙 瑜, 史明昌, 彭 欢, 等. 基于MAXENT模型的黑龙江大兴安岭森林雷击火火险预测. 应用生态学报, 2014, 25 (4): 1100- 1106.
doi: 10.13287/j.1001-9332.2014.0086 |
|
|
Sun Y, Shi M C, Peng H, et al. Forest lighting fire forecasting for Daxing’anling Mountains based on MAXENT model. Chinese Journal of Applied Ecology, 2014, 25 (4): 1100- 1106.
doi: 10.13287/j.1001-9332.2014.0086 |
|
|
田晓瑞, Douglas J M, 舒立福, 等. 大兴安岭地区森林火险变化及FWI适用性评估. 林业科学, 2010, 46 (5): 127- 132.
doi: 10.11707/j.1001-7488.20100521 |
|
|
Tian X R, Douglas J M, Shu L F, et al. Changes of forest fire danger and the evaluation of the FWI system application in the Daxing'anling region. Forestry Science, 2010, 46 (5): 127- 132.
doi: 10.11707/j.1001-7488.20100521 |
|
|
田晓瑞, 舒立福, 王明玉, 等. 大兴安岭雷击火时空分布及预报模型. 林业科学研究, 2009, 22 (1): 14−20.
doi: 10.3321/j.issn:1001-1498.2009.01.002 |
|
|
Tian X R, Shu L F, Wang M Y, et al. Spatial and temporal distribution of lightning fire and forecasting model for Daxing'anling region. Forestry Science Research, 2009, 22 (1): 14−20.
doi: 10.3321/j.issn:1001-1498.2009.01.002 |
|
|
田晓瑞, 舒立福, 赵凤君, 等. 大兴安岭雷击火发生条件分析. 林业科学, 2012, 48 (7): 98- 103.
doi: 10.11707/j.1001-7488.20120716 |
|
|
Tian X R, Shu L F, Zhao F J, et al. Analysis of the conditions for lightning fire occurrence in Daxing'anling region. Scientia Silvae Sinicae, 2012, 48 (7): 98- 103.
doi: 10.11707/j.1001-7488.20120716 |
|
|
田晓瑞, 舒立福, 赵凤君, 等. 气候变化对中国森林火险的影响. 林业科学, 2017, 53 (7): 159−169.
doi: 10.11707/j.1001-7488.20170716 |
|
|
Tian X R, Shu L F, Zhao F J, et al. Impacts of climate change on forest fire danger in China. Scientia Silvae Sinicae. Scientia Silvae Sinicae, 2017, 53 (7): 159−169.
doi: 10.11707/j.1001-7488.20170716 |
|
|
王晓红, 黄 艳, 张吉利, 等. 基于闪电定位数据和气象数据的大兴安岭雷击火预测模型研究. 中南林业科技大学学报, 2017, 37 (3): 44- 48.
doi: 10.14067/j.cnki.1673-923x.2017.03.007 |
|
|
Wang X H, Huang Y, Zhang J L, et al. Research on daily prediction model of lightning fires in Daxing'anling Region based on lightning location data. Journal of Central South University of Forestry & Technology, 2017, 37 (3): 44- 48.
doi: 10.14067/j.cnki.1673-923x.2017.03.007 |
|
| 徐化成. 1998. 中国大兴安岭森林. 北京: 科学出版社. | |
| Xu H C. 1998. Daxing'an Mountains forests in China. Beijing: Science Press.[in Chinese] | |
| 臧桐汝, 舒立福, 王明玉, 等. 黑龙江大兴安岭林区雷击火时空分布及驱动因素分析. 西北农林科技大学学报(自然科学版), 2022, 50 (12): 64- 76. | |
| Zang T R, Shu L F, Wang M Y, et al. Analysis of spatial and temporal distribution and driving factors of lightning-caused fires in Daxing'anling forest region of Heilongjiang, Journal of Northwest A&. F University(Natural Science Edition. ), 2022, 50 (12): 64- 76. | |
|
赵凤君, 舒立福, 邸雪颖, 等. 气候变暖背景下内蒙古大兴安岭林区森林火灾发生日期的变化. 林业科学, 2009, 45 (6): 166- 172.
doi: 10.3321/j.issn:1001-7488.2009.06.030 |
|
|
Zhao F J, Shu L F, Di X Y, et al. Changes in the occurring date of forest fires in the Inner Mongolia Daxing'anling forest region under global warming. Scientia Silvae Sinicae, 2009, 45 (6): 166- 172.
doi: 10.3321/j.issn:1001-7488.2009.06.030 |
|
| 周长明, 陈 亮, 陆明明, 等. 高纬度林区干雷暴与雷击火时空分布特征及其相关分析. 广西林业科学, 2022, 51 (4): 520- 526. | |
| Zhou C M, Chen L, Lu M M, et al. Temporal and spatial distribution characteristics of dry thunderstorm and lightning fire and their correlation in high latitude forest area. Guangxi Forestry Science, 2022, 51 (4): 520- 526. | |
| Bryson C B, Andrew J D, Lachlan M, et al. 2021. A Bayesian approach to exploring the influence of climate variability modes on fire weather conditions and lightning–ignited wildfires. Climate Dynamics, 1–19. | |
|
Coogan S C P, Cai X L, Jain P, et al. Seasonality and trends in human-and lightning-caused wildfires≥ 2 ha in Canada, 1959—2018. International Journal of Wildland Fire, 2020, 29 (6): 473- 485.
doi: 10.1071/WF19129 |
|
| Fauria M M, Johnson E A. Large-scale climatic patterns control large lightning fire occurrence in Canada and Alaska forest regions. Journal of Geophysical Research: Biogeosciences, 2015, 111 (G4): 1019- 1027. | |
|
Flannigan M, Cantin A S, Groot W J, et al. Global wildland fire season severity in the 21st century. Forest Ecology and Management, 2013, 294, 54- 61.
doi: 10.1016/j.foreco.2012.10.022 |
|
|
Gao C. An R, Wang W, et al. Asymmetrical lightning fire season expansion in the boreal forest of northeast China. Forests, 2021, 12(8), 1023.
doi: 10.3390/f12081023 |
|
|
Jolly W M, Cochrane M A, Freeborn P H, et al. Climate-induced variations in global wildfire danger from 1979 to 2013. Nature Communications, 2015, 6 (1): 7537.
doi: 10.1038/ncomms8537 |
|
|
McRae R. Prediction of areas prone to lightning ignition. International Journal of Wildland Fire, 1992, 2 (3): 123- 130.
doi: 10.1071/WF9920123 |
|
| Nieto H, Aguado I, García M. et al. 2012. Lightning-caused fires in Central Spain: development of a probability model of occurrence for two Spanish regions. Agricultural & Forest Meteorology, 162–163: 35–43. | |
|
Pineda N, Rigo T. The rainfall factor in lightning–ignited wildfires in Catalonia. Agricultural and Forest Meteorology, 2017, 239, 249- 263.
doi: 10.1016/j.agrformet.2017.03.016 |
|
| Podschwit H, Cullen A. 2021, Patterns and trends in simultaneous wildfire activity in the United States from 1984 to 2015. International Journal of Wildland Fire, 29(12): 1057–1071. | |
| Read N, Duff T J, Taylor P G. A lightning-caused wildfire ignition forecasting model for operational use. Agricultural and Forest Meteorology, 2018, 253/254, 233- 246. | |
| Reeve N, Toumi R. Lightning activity as an indicator of climate change. Quarterly Journal of the Royal Meteorological Society, 2010, 125 (555): 893- 903. | |
| Shi G, H Yan, Zhang W, et al. Rapid warming has resulted in more wildfires in northeastern Australia. Science of the Total Environment, 2021, 2021, 144888. | |
| Taylor A R. Ecological aspects of lightning in forests. Proceedings of the Tall Timbers Fire Ecology Conference, 1974, 13, 455- 482. | |
|
Wotton B M, Martell D L. A lightning fire occurrence model for Ontario. Canadian Journal of Forest Research, 2005, 35 (6): 1389- 1401.
doi: 10.1139/x05-071 |
| [1] | Weike Li,Lifu Shu,Shangbo Yuan,Jiajun Song,Wei Li,Liqing Si,Fengjun Zhao,Yahui Wang,Mingyu Wang. Temporal and Spatial Distribution Characteristics of Lightning in Daxing'anling Mountains Based on VLF/LF 3D Lightning Location System [J]. Scientia Silvae Sinicae, 2022, 58(11): 21-30. |
| [2] | Tian Xiaorui;Shu Lifu;Zhao Fengjun;Wang Mingyu. Analysis of the Conditions for Lightning Fire Occurrence in Daxing' anling Region [J]. Scientia Silvae Sinicae, 2012, 48(7): 98-103. |
| [3] | Nie Daoping. STRUCTURAL DYNAMICS OF BAMBOO FOREST STANDS [J]. , 1994, 30(3): 201-208. |
| Viewed | ||||||
|
Full text |
|
|||||
|
Abstract |
|
|||||