
Scientia Silvae Sinicae ›› 2026, Vol. 62 ›› Issue (5): 54-68.doi: 10.11707/j.1001-7488.LYKX20250571
• Research papers • Previous Articles Next Articles
Ying Zhu1,2,*( ),Yao Zhang1,Xiaolei Yang1,Jingya Qiao1,Yuqing Feng2,3
Received:2025-09-17
Revised:2026-02-10
Online:2026-05-10
Published:2026-05-12
Contact:
Ying Zhu
E-mail:zhuying_china@163.com
CLC Number:
Ying Zhu,Yao Zhang,Xiaolei Yang,Jingya Qiao,Yuqing Feng. Responses of Landscape Patterns to Human Activity Intensity in Wetland Buffer Zones of Wujiang District, Suzhou City[J]. Scientia Silvae Sinicae, 2026, 62(5): 54-68.
Fig.1
Wetland resources in Wujiang District"
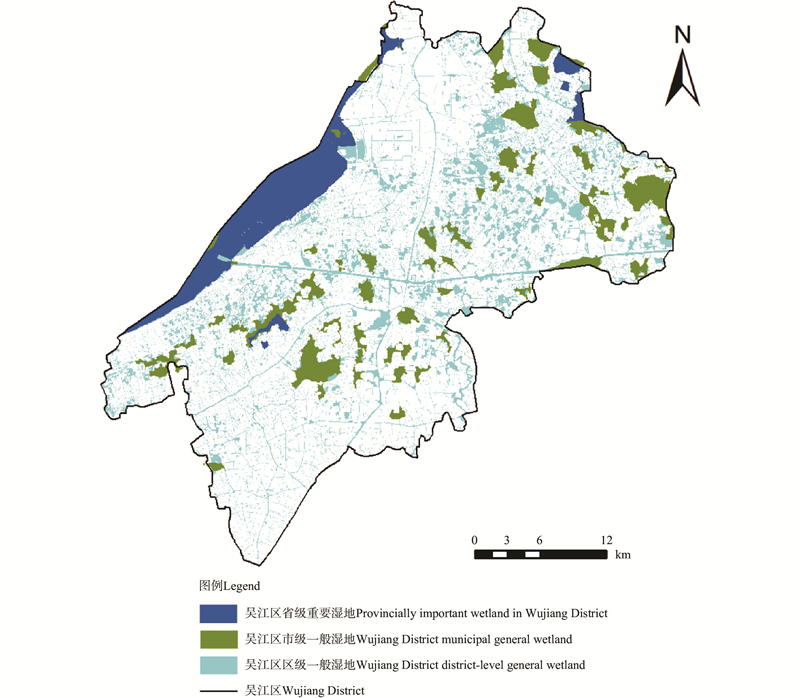
Fig.2
Landuse types in Wujiang District"
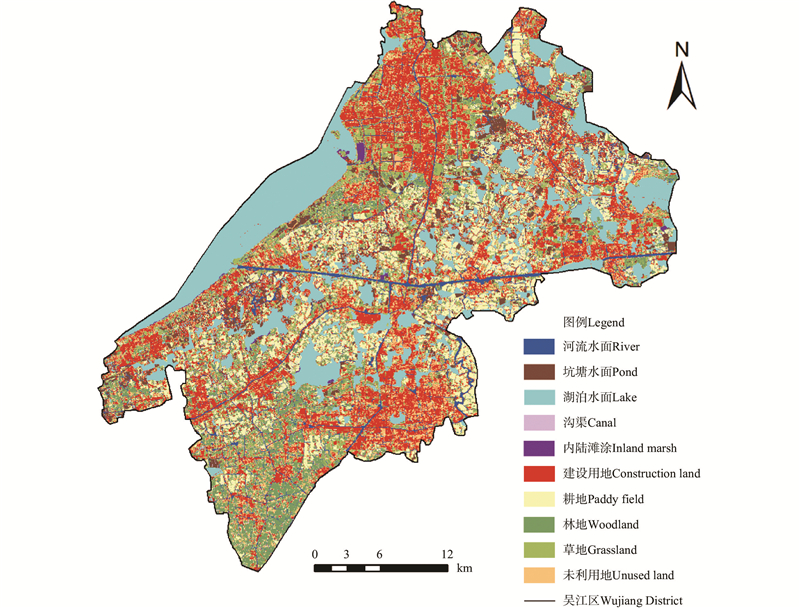
Fig.3
Distribution of wetland samples and buffer zones in Wujiang District"
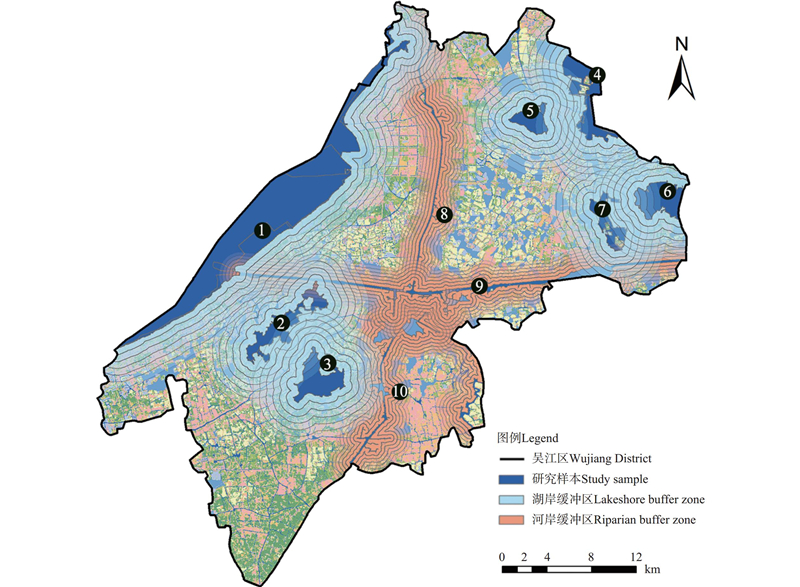
Table 1
Connotations and weights of human activity intensity indicators"
| 指标 Indicator | 指标内涵 Indicator connotation | 指标权重Indicator weight |
建设用地面积占比 Proportion of construction land area(%) | 建设用地是人类活动的主要空间载体,其比例大小直接反映人类对自然地表的 改造强度和空间占据程度 Construction land is the primary spatial carrier of human activities, and its proportion directly reflects the intensity of human modification of the natural surface and the extent of spatial occupation | 0.280 |
路网密度 Road network density/ (km·km-2) | 单位面积内道路总长度的比值。路网密度越高,人类活动的可达性和扩展能力越强,对湿地景观和生态系统的扰动程度也越大 The ratio of the total road length to the area of the evaluation unit. The higher the road netwaork density, the stronger the accessibility and expansion of human activities,and the greater the disturbance to wetland landscapes and ecosystems | 0.232 |
耕地面积占比Proportion of cultivated land area(%) | 单位面积内耕地(含水田、旱地等)的比例。较高的耕地占比表明人类为满足生存需求 对自然生态系统进行的干预和转化强度较大 The proportion of cultivated land (including paddy fields and dry land) within the evaluation unit area. A high proportion indicates intensive human intervention and transformation of natural ecosystems to meet subsistence needs | 0.244 |
| 坑塘水面面积占比 Proportion of pond water surface area(%) | 坑塘水面多因养殖、灌溉和蓄水需求而修建,其比例大小反映了人类对水资源的利用和 调控强度,是生产活动的间接体现 Pond water surfaces are primarily constructed for aquaculture, irrigation, and water storage. Their proportion reflects the intensity of human utilization and regulation of water resources, serving as an indirect indicator of production activities | 0.183 |
交通服务设施点密度 Transportation service facility density/km-2 | 单位面积内交通服务设施(停车场、车站、港口、地铁站等)的聚集程度。本研究采用 核密度方法表征湿地周边休闲娱乐活动强度 The degree of aggregation of transportation service facilities (parking lots, bus stops, ports, subway stations, etc.) within the evaluation unit area. In this study, kernel density estimation is applied to characterize the intensity of recreational activities around wetlands | 0.060 |
Table 2
Ecological significance and practical implications of landscape pattern indices"
| 景观指数 Landscape index | 生态意义 Ecological significance | 应用内涵 Practical implications | 参考文献References |
| 斑块密度 Patch density/km-2 | 单位面积上斑块数量的比值,反映景观破碎化程度和干扰水平 The number of patches per unit area, reflecting the degree of landscape fragmentation and disturbance | 城市化、交通基础设施建设、农业开垦等活动通常增加破碎化; 在高度集约化利用区可能因单一用地集中而降低斑块密度 Urbanization, transportation infrastructure development, and agricultural reclamation usually increase fragmentation, raising patch density; intensive land use may reduce patch density due to concentrated single-use land | |
| 最大斑块指数Largest patch index(%) | 某景观类型中最大斑块面积占该类型 总面积的百分比 The proportion of the largest patch area of a certain landscape type to the total area of that type | 建设用地或耕地扩张可使最大板块指数升高;自然景观破碎化或 退化时最大板块指数降低 Expansion of construction land or cropland may increase the largest patch index, while fragmentation or degradation of natural landscapes reduces it | |
| 连通性指数 Connectivity index(%) | 衡量景观组分之间的功能连接性 Measure the functional connectivity among landscape patches | 道路建设、城市扩张常降低生态斑块连通性; 廊道建设有助于提升连通性 Road construction and urban expansion often reduce connectivity; corridor construction and ecological restoration enhance connect | |
| 聚合度指数Aggregation index | 反映相同景观类型的聚集程度。 Reflect the degree of aggregation of the same landscape type | 集约化农业或大规模建设可提高聚合度指数;分散开发会 降低聚合度指数 Intensive agriculture or large-scale construction increases aggregation index, while scattered development decreases it | |
| 香农多样性指数Shannon’s diversity index | 衡量景观类型的多样性与优势度 Measure the diversity and evenness of landscape types | 中等强度的人类活动可能提高多样性,高强度人类活动往往 导致类型减少、多样性降低 Moderate human activities increase diversity, raising Shannon’s diversity index, while intensive development leads to dominance of few types, reducing Shannon’s diversity index | |
| 香农均匀度指数Shannon’s evenness index | 衡量各景观类型面积分布均衡程度 Measure the evenness of area distribution among landscape types | 高度集约化利用易形成优势类型,SHEI 降低; 适度人类活动可能提高均衡度 Highly intensive utilization can easily form’advantageous types and reduce Shannon’s evenness index; moderate human activity may improve balance evenness |
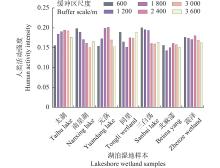
Fig.4
Gradient distribution of human activity intensity in lakeshore buffer zones"
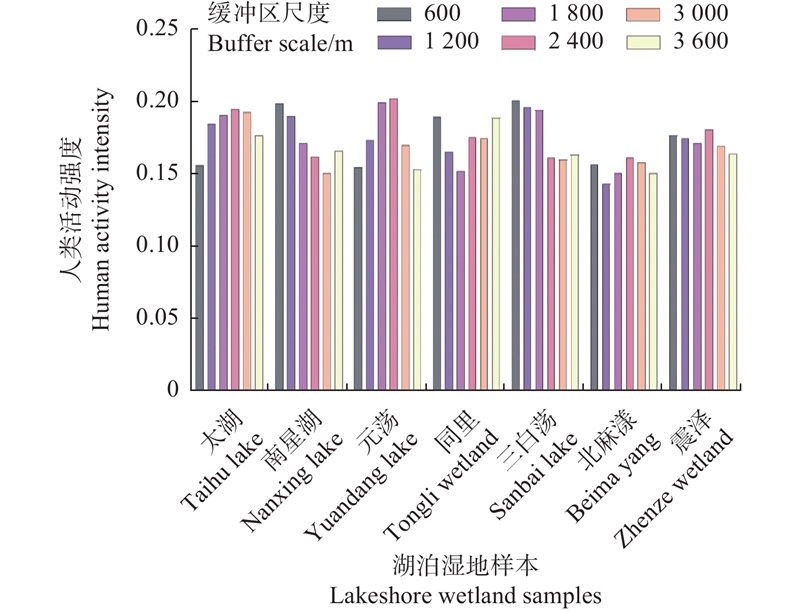
Fig.5
Gradient distribution of human activity intensity in riverine buffer zones"
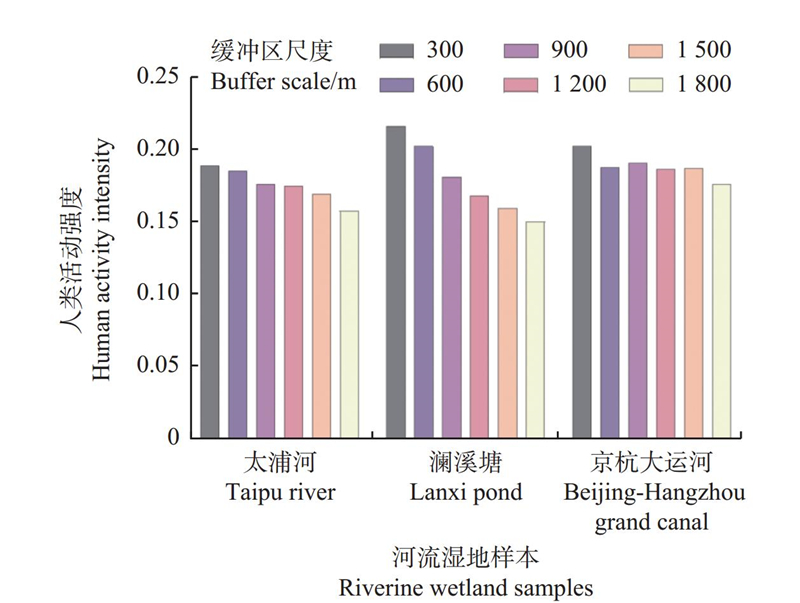
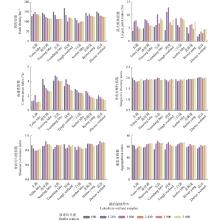
Fig.6
Gradient differentiation of landscape pattern indices in lakeshore buffer zones"
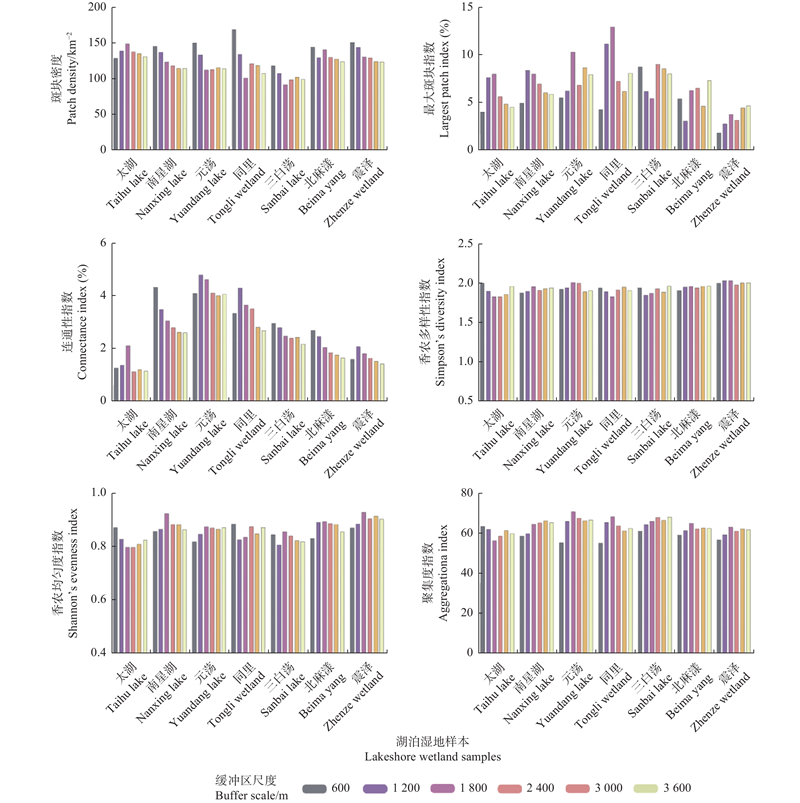
Fig.7
Gradient differentiation of landscape pattern indices in riverine buffer zones"
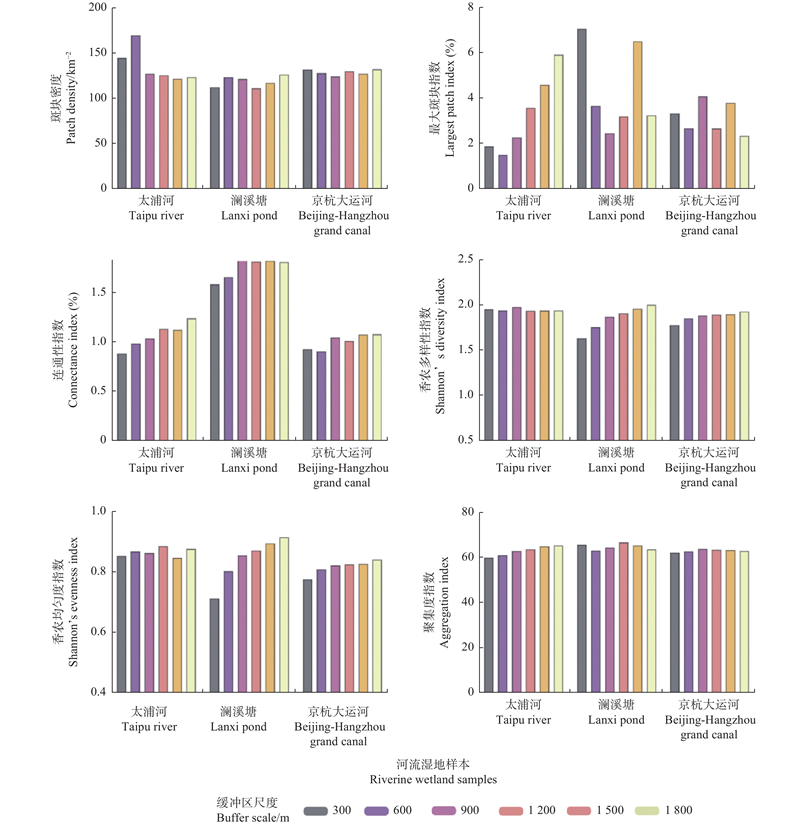
Table 3
Descriptive statistics of human activity intensity and landscape pattern indices in lakeshore buffer zones"
| 项目Item | 均值Mean | 标准差 Standard deviation | 最小值 Minimum | 中位数 Median | 最大值 Maximum | 25分位数 25th percentile | 75分位数 75th percentile |
| 斑块密度Patch density/km-2 | 662.75 | 256.24 | 75 | 650 | 3 293.343 | 475 | 825 |
| 最大斑块指数Largest patch index(%) | 41.77 | 17.51 | 8.56 | 38.88 | |||
| 连通性指数Connectivity index(%) | 42.28 | 13.12 | 100 | 48 | |||
| 聚合度指数Aggregation index | 97.96 | 0.69 | |||||
| 香农均匀度指数Shannon’s evenness index | 0.70 | 0.15 | 0.051 1 | 1 | |||
| 香农多样性指数Shannon’s diversity index | 1.27 | 0.34 | 1.048 | ||||
| 人类活动强度Human activity intensity | 0.19 | 0.06 | 0.014 | 0.192 | 0.363 | 0.147 | 0.236 |
Table 4
Regression results of influencing factors of landscape pattern indices in lakeshore buffer zones"
| 项目Item | 斑块密度Patch density/km-2 | 最大斑块指数Largest patch index(%) | 连通性指数Connectivity index(%) | 聚合度指数Aggregation index | 香农均匀度指数Shannon’s evenness index | 香农多样性指数Shannon’s diversity index |
| 人类活动强度Human activity intensity(HAI) | 241.0*(1.78) | 219.5***(?19.78) | 91.35***(11.86) | 2.298***(6.80) | 2.179***(23.86) | 4.674***(24.15) |
| 人类活动强度平方项Squared term of HAI(HAI2) | ?3 468.3*** (?9.81) | 908.1***(30.06) | 220.0***(?10.57) | ?1.601*(?1.78) | ?8.861*** (?35.59) | ?19.38*** (?36.91) |
| 缓冲区距离Buffer distance/m | ? (?4.16) | (3.12) | ? (?3.81) | 0.000 019 3*** (5.11) | ? (?0.53) | ? (?1.30) |
| 常数项Constant term | 769.7***(60.92) | 46.80***(47.76) | 34.30***(50.37) | 97.54***(315 7.04) | 0.637***(80.09) | 1.155***(68.18) |
| 调整后的决定系数Adjusted R-squared (adj. R2) | 0.062 | 0.210 | 0.006 | 0.022 | 0.259 | 0.256 |
| F | 541.50*** | 1 316.30*** | 59.34*** | 188.12*** | 182 1.24*** | 2 038.01*** |
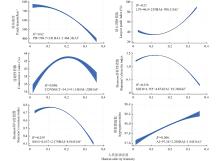
Fig.8
Relationships between different landscape pattern indices and the human activity intensity index in lakeshore buffer zones"
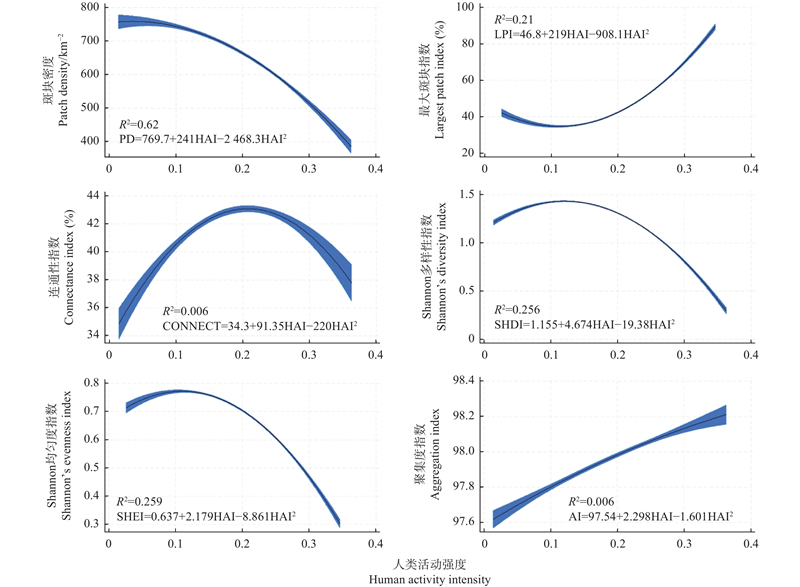
Table 5
Descriptive statistics of human activity intensity and landscape pattern indices in riverine buffer zones"
| 变量名称Variable name | 均值Mean | 标准差 Standard deviation | 最小值 Minimum | 中位数 Median | 最大值 Maximum | 25分位数 25th percentile | 75分位数 75th percentile |
| 斑块密度Patch density/km?2 | 602.83 | 238.09 | 75 | 575 | 200 2.002 | 425 | 750 |
| 最大斑块指数Largest patch index(%) | 45.42 | 18.10 | 43.305 | 96.92 | 30.882 5 | 57.96 | |
| 连通性指数Connectivity index(%) | 43.06 | 13.26 | 40.8 | 100 | 34.042 6 | 50 | |
| 聚合度指数Aggregation index | 98.13 | 0.64 | 98.113 9 | 99.881 3 | 97.680 1 | 98.585 9 | |
| 香农均匀度指数Shannon’s evenness index | 0.68 | 0.16 | 0.696 4 | 1 | 0.582 1 | ||
| 香农多样性指数Shannon’s diversity index | 1.19 | 0.35 | 0.065 | ||||
| 人类活动强度Human activity intensity | 0.20 | 0.06 | 0.026 | 0.199 | 0.346 | 0.154 | 0.244 |
| 缓冲区距离Buffer distance | 1 001.41 | 514.70 | 300 | 900 | 1 800 | 600 | 1 500 |
Table 6
Regression results of influencing factors of landscape indices in riverine buffer zoness"
| 项目Item | 斑块密度Patch density/km-2 | 最大斑块指数Largest patch index(%) | 连通性指数Connectivity index(%) | 聚合度指数Aggregation index | 香农均匀度指数Shannon’s evenness index | 香农多样性指数Shannon’s diversity index |
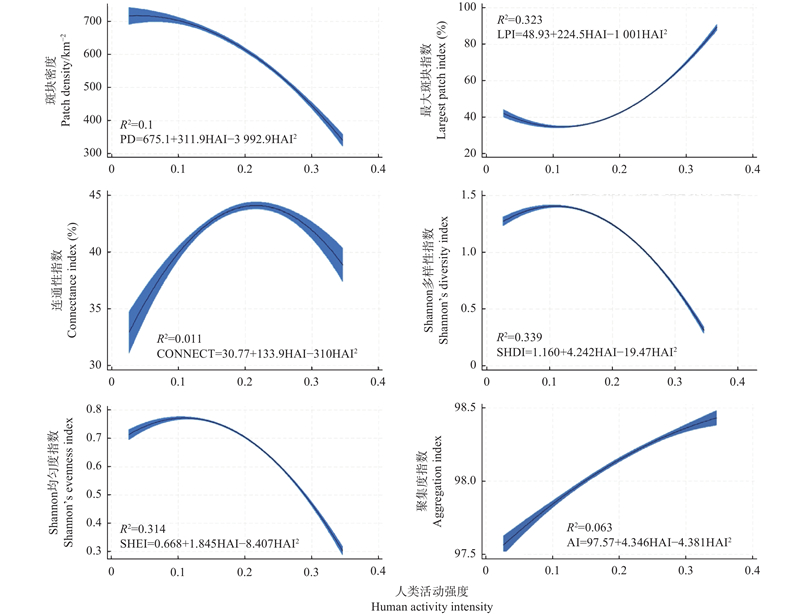
| 人类活动强度Human activity intensity(HAI) | 311.9*(1.79) | -224.5***(-14.69) | 133.9***(10.04) | 4.346***(9.37) | 1.845***(13.53) | 4.242***(14.91) |
| 人类活动强度平方项Squared term of HAI(HAI2) | - (-9.26) | 1 001.0***(25.91) | -310.0*** (-9.19) | -4.381*** (-3.76) | -8.407*** (-24.08) | -19.47*** (-27.33) |
| 缓冲区距离Buffer distance/m | 0.036 2*** (8.74) | -0.001 59*** (-5.90) | -0.001 11*** (-4.50) | - (-10.70) | (1.36) | (2.99) |
| 常数项Constant term | 675.1***(38.83) | 48.93***(33.19) | 30.77***(23.87) | 97.57***(2 138.36) | 0.668***(51.67) | 1.160***(42.01) |
| 调整后的决定系数Adjusted R-squared (adj. R2) | 0.100 | 0.323 | 0.011 | 0.063 | 0.314 | 0.339 |
| F | 537.85 | 1 673.38*** | 47.94*** | 332.83*** | 1 537.29*** | 2 024.16*** |
Fig.9
Relationships between different landscape pattern indices and the human activity intensity index in riverine buffer zones"
|
艾 彬, 徐晓苹, 马世发, 等. 2035年珠江三角洲核心区湿地退化风险评估研究. 湿地科学, 2020, 18 (3): 320- 327.
doi: 10.13248/j.cnki.wetlandsci.2020.03.008 |
|
|
Ai B, Xu X P, Ma S F, et al. Risk assessment of wetland degradation in the core area of the Pearl River Delta in 2035. Wetland Science, 2020, 18 (3): 320- 327.
doi: 10.13248/j.cnki.wetlandsci.2020.03.008 |
|
| 陈 艳. 2013. 武陵源世界自然遗产地旅游生态足迹分析. 林业科学, 49(2): 139−145. | |
| Chen Y. 2013. Analysis of the tourism ecological footprint in Wulingyuan world nature heritage site. Scientia Silvae Sinicae, 49(2): 139−145. [in Chinese] | |
|
丁金华, 许艳秋, 钱 晶. 苏南水网地区水域景观破碎化时空演变特征及驱动因子研究: 以吴江区为例. 西北林学院学报, 2024, 39 (1): 247- 255.
doi: 10.3969/j.issn.1001-7461.2024.01.33 |
|
|
Ding J H, Xu Y Q, Qian J. Spatio-temporal evolution and driving factors of water landscape fragmentation in southern Jiangsu water network: a case study of Wujiang District. Journal of Northwest Forestry University, 2024, 39 (1): 247- 255.
doi: 10.3969/j.issn.1001-7461.2024.01.33 |
|
| 段群滔, 罗立辉. 人类活动强度空间化方法综述与展望: 以青藏高原为例. 冰川冻土, 2021 (5): 1582- 1593. | |
| Duan Q T, Luo L H. Summary and prospect of spatialization method of human activity intensity: taking the Qinghai-Tibet Plateau as an example. Journal of Glaciology and Geocryology, 2021 (5): 1582- 1593. | |
|
胡志斌, 何兴元, 李月辉, 等. 岷江上游地区人类活动强度及其特征. 生态学杂志, 2007, 26 (4): 539- 543.
doi: 10.13292/j.1000-4890.2007.0098 |
|
|
Hu Z B, He X Y, Li Y H, et al. Human activity intensity and its spatial distribution pattern in upper reach of Minjiang River. Chinese Journal of Ecology, 2007, 26 (4): 539- 543.
doi: 10.13292/j.1000-4890.2007.0098 |
|
|
李 帅, 魏 虹, 倪细炉, 等. 基于层次分析法和熵权法的宁夏城市人居环境质量评价. 应用生态学报, 2014, 25 (9): 2700- 2708.
doi: 10.13287/j.1001-9332.2014.0215 |
|
|
Li S, Wei H, Ni X L, et al. Evaluation of urban human settlement quality in Ningxia based on AHP and the entropy method. Chinese Journal of Applied Ecology, 2014, 25 (9): 2700- 2708.
doi: 10.13287/j.1001-9332.2014.0215 |
|
| 刘佳琦, 栗云召, 宗 敏, 等. 黄河三角洲人类干扰活动强度变化及其景观格局响应. 地球信息科学学报, 2018, 20 (8): 1102- 1110. | |
| Liu J Q, Li Y Z, Zong M, et al. Intensity change of human disturbance and its response to landscape pattern in the Yellow River Delta. Journal of Geo-Information Science, 2018, 20 (8): 1102- 1110. | |
|
任浩洋, 刘艳军, 王肖惠, 等. 快速城镇化地区土地利用景观格局演化及影响因素: 以苏州市为例. 东北师大学报(自然科学版), 2024, 56 (1): 143- 153.
doi: 10.16163/j.cnki.dslkxb202201170001 |
|
|
Ren H Y, Liu Y J, Wang X H, et al. Evolution of land use landscape pattern and influencing factors in rapid urbanization areas: a case study of Suzhou City. Journal of Northeast Normal University (Natural Science Edition), 2024, 56 (1): 143- 153.
doi: 10.16163/j.cnki.dslkxb202201170001 |
|
|
石玉胜, 肖捷颖, 沈彦俊, 等. 土地利用与景观格局变化的空间分异特征研究: 以天津市蓟县地区为例. 中国生态农业学报, 2010, 18 (2): 416- 421.
doi: 10.3724/SP.J.1011.2010.00416 |
|
|
Shi Y S, Xiao J Y, Shen Y J, et al. Spatial variation in land use and landscape pattern-a case study of Ji County of Tianjin City. Chinese Journal of Eco-Agriculture, 2010, 18 (2): 416- 421.
doi: 10.3724/SP.J.1011.2010.00416 |
|
| 邬建国. 2007. 景观生态学: 格局、过程、尺度与等级. 2版. 北京: 高等教育出版社. | |
| Wu J G. 2007. Landscape ecology. 2nd ed. Beijing: Higher Education Press. [in Chinese] | |
|
巫丽芸, 何东进, 游巍斌, 等. 东山岛海岸带景观破碎化时空梯度分析. 生态学报, 2020 (3): 1055- 1064.
doi: 10.5846/stxb201811142460 |
|
|
Wu L Y, He D J, You W B, et al. A gradient analysis of coastal landscape fragmentation change in Dongshan island, China. Acta Ecologica Sinica, 2020 (3): 1055- 1064.
doi: 10.5846/stxb201811142460 |
|
| 徐 勇, 孙晓一, 汤 青. 陆地表层人类活动强度: 概念、方法及应用. 地理学报, 2015, 70 (7): 1068- 1079. | |
| Xu Y, Sun X Y, Tang Q. Human activity intensity of land surface: concept, method and application in China. Acta Geographica Sinica, 2015, 70 (7): 1068- 1079. | |
|
易 帆, 陈 旻, 何晓枫, 等. 流域土地利用分析中空间尺度对水质的影响. 中国环境科学, 2023, 43 (8): 4280- 4291.
doi: 10.3969/j.issn.1000-6923.2023.08.045 |
|
|
Yi F, Chen M, He X F, et al. Effect of spatial scale on water quality in watershed land use analysis. China Environmental Science, 2023, 43 (8): 4280- 4291.
doi: 10.3969/j.issn.1000-6923.2023.08.045 |
|
| 尹德洁, 侯冰钰, 王冬薇, 等. 近20年来黄河沿岸济南区段缓冲带景观格局梯度分析. 中国城市林业, 2022, 20 (3): 14- 21. | |
| Yin D J, Hou B Y, Wang D W, et al. Analysis of buffer zone landscape pattern gradient in Jinan section of the Yellow River in recent 20 years. Journal of Chinese Urban Forestry, 2022, 20 (3): 14- 21. | |
|
张洪森, 角媛梅, 陈 凡, 等. 云南九大高原湖泊流域人类活动强度对水质的多尺度影响. 湖泊科学, 2024, 36 (2): 430- 442.
doi: 10.18307/2024.0221 |
|
|
Zhang H S, Jiao Y M, Chen F, et al. Multi-scale impacts of human activity intensity on water quality in nine plateau lake basins in Yunnan Province. Journal of Lake Sciences, 2024, 36 (2): 430- 442.
doi: 10.18307/2024.0221 |
|
| 朱 颖, 周昕宇, 冯育青, 等. 2025. 水网城市湿地生态网络韧性评价: 以苏州中心城区为例. 林业科学, 61(2): 62−73. | |
| Zhu Y, Zhou X Y, Feng Y Q, et al. 2025. Resilience evaluation of wetland ecological network in water network city: a case study of Suzhou central urban area. Scientia Silvae Sinicae, 61(2): 62−73. [in Chinese] | |
| 朱 颖, 顾春望, 李 欣, 等. 基于DPSIRM模型的苏州吴江区湿地生态安全评价. 浙江农林大学学报, 2022, 39 (5): 1114- 1123. | |
| Zhu Y, Gu C W, Li X, et al. Evaluation of wetland ecological security in Wujiang District of Suzhou based on DPSIRM model. Journal of Zhejiang A & F University, 2022, 39 (5): 1114- 1123. | |
| 周冬梅, 陈存友, 王明佳, 等. 基于最佳尺度的城市生态空间景观格局梯度和方向分异特征: 以长沙市为例. 生态与农村环境学报, 2022, 38 (5): 566- 577. | |
| Zhou D M, Chen C Y, Wang M J, et al. Gradient and directional differentiation in landscape pattern characteristics of urban ecological space based on optimal spatial scale: a case study in Changsha City, China. Journal of Ecology and Rural Environment, 2022, 38 (5): 566- 577. | |
|
Dodds W K, Perkin J S, Gerken J E. Human impact on freshwater ecosystem services: a global perspective. Environmental Science & Technology, 2013, 47 (16): 9061- 9068.
doi: 10.1021/es4021052 |
|
| Gustafson E J. 1998. Quantifying landscape spatial pattern: what is the state of the art? Ecosystems, 1(2): 143-156. | |
|
Hudson P F, LaFevor M C. Managing and monitoring human impacts on landscapes for environmental change and sustainability. Journal of Environmental Management, 2014, 138, 1- 3.
doi: 10.1016/j.jenvman.2014.04.014 |
|
|
Klein-Banai C, Theis T L. An urban university’s ecological footprint and the effect of climate change. Ecological Indicators, 2011, 11 (3): 857- 860.
doi: 10.1016/j.ecolind.2010.11.002 |
|
| Luck M, Wu J. A gradient analysis of urban landscape pattern: a case study from the Phoenix metropolitan region, Arizona, USA. Landscape Ecology, 2002, 17 (4): 327- 339. | |
|
Li H, Wu J G. Use and misuse of landscape indices. Landscape Ecology, 2004, 19 (4): 389- 399.
doi: 10.1023/B:LAND.0000030441.15628.d6 |
|
|
Masson M, Saint-Eve A, Delarue J, et al. Identifying the ideal profile of French yogurts for different clusters of consumers. Journal of Dairy Science, 2016, 99 (5): 3421- 3433.
doi: 10.3168/jds.2015-10119 |
|
| Nagendra H. Opposite trends in response for the Shannon and Simpson indices of landscape diversity. Applied Geography, 2002, 22 (2): 175- 186. | |
| Ramachandra T V, Rajinikanth R, Ranjini V G. 2005. Economic valuation of wetlands. Journal of Environmental Biology, 26(suppl): 439−447. | |
|
Shen S G, Pu J, Xu C, et al. Effects of human disturbance on riparian wetland landscape pattern in a coastal region. Remote Sensing, 2022, 14 (20): 5160.
doi: 10.3390/rs14205160 |
|
| Stinchcombe J R, Agrawal A F, Hohenlohe P A, et al. 2008. Estimating nonlinear selection gradients using quadratic regression coefficients: double or nothing? Evolution, International Journal of Organic Evolution, 62(9): 2435−2440. | |
|
Taylor P D, Fahrig L, Henein K, et al. Connectivity is a vital element of landscape structure. Oikos, 1993, 68 (3): 571- 573.
doi: 10.2307/3544927 |
|
| Turner M G, Gardner R H. 2015. Landscape ecology in theory and practice: pattern and process. New York: Springer New York. | |
|
Wang W Y, Yang P, Xia J, et al. Impact of land use on water quality in buffer zones at different scales in the Poyang Lake, middle reaches of the Yangtze River basin. Science of the Total Environment, 2023, 896, 165161.
doi: 10.1016/j.scitotenv.2023.165161 |
|
|
Werner B T, McNamara D E. Dynamics of coupled human-landscape systems. Geomorphology, 2007, 91 (3/4): 393- 407.
doi: 10.1016/j.geomorph.2007.04.020 |
|
|
Wu T, Zha P P, Yu M J, et al. Landscape pattern evolution and its response to human disturbance in a newly metropolitan area: a case study in Jin-Yi metropolitan area. Land, 2021, 10 (8): 767.
doi: 10.3390/land10080767 |
|
|
Xie H Y, Jin X W, Li W P, et al. Identifying critical land use thresholds for biodiversity conservation in China’s lake ecosystems. Environmental Science & Technology, 2025, 59 (11): 5431- 5442.
doi: 10.1021/acs.est.4c09911 |
| Viewed | ||||||
|
Full text |
|
|||||
|
Abstract |
|
|||||
