Scientia Silvae Sinicae ›› 1998, Vol. 34 ›› Issue (zk): 26-34.
Previous Articles Next Articles
Yushan Zheng,Wei Hong,liguang Chen
Online:
Published:
Abstract:
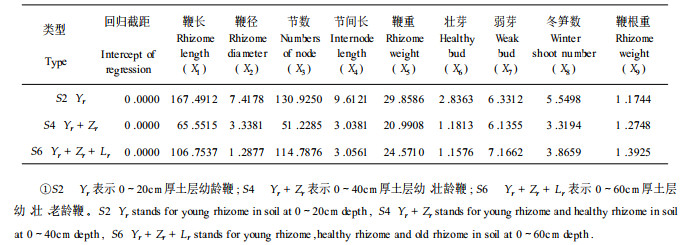
By using the data from 758 plots, the primary selection was carried out by correlation coefficient and standard error, then the optimum mathematical models were selected by the variance inflation coefficients in the determinations of Cp value and colinearity. The results show that at the soil depth of 0~40cm the closest relationships were found between the amount of bamboo shoot emergence and the rhizome diameter, the internode length, and the rhizome root weight of the young and healthy rhizomes, and the weight of bamboo shoot closely related to the internode length, the healthy buds, and rhizome root weight of the young and healthy rhizome. At the soil depth of 0~60cm, the closer relations were found between the amount of new bamboo and the rhizome diameter, the internode length, the rhizome weight, and healthy bud of the young, healthy, and old rhizome, and a closest relation between the weight of new bamboo and the rhizome diameter of the young rhizome, the healthy rhizome, and the old rhizome.
Key words: Phyllostachys heterocycla cv. pubescens, Underground structure, Yield, Variance inflation coefficient, Determinations of Cp value colinearity
Yushan Zheng,Wei Hong,liguang Chen. STUDY ON THE EFFECT OF UNDERGROUND STRUCTURE ON THE YIELD OF BAMBOO SHOOTS[J]. Scientia Silvae Sinicae, 1998, 34(zk): 26-34.
/ / Recommend
Add to citation manager EndNote|Reference Manager|ProCite|BibTeX|RefWorks
URL: http://www.linyekexue.net/EN/
http://www.linyekexue.net/EN/Y1998/V34/Izk/26
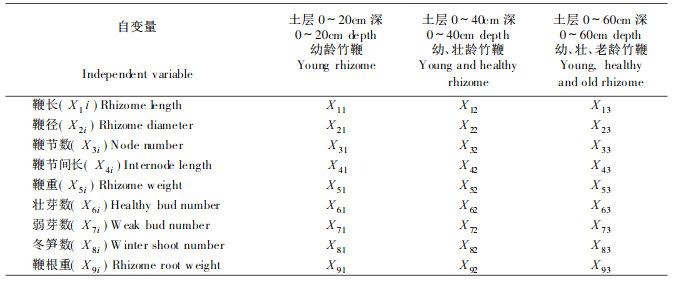
Table 1
The meaning of independent variable in various models"
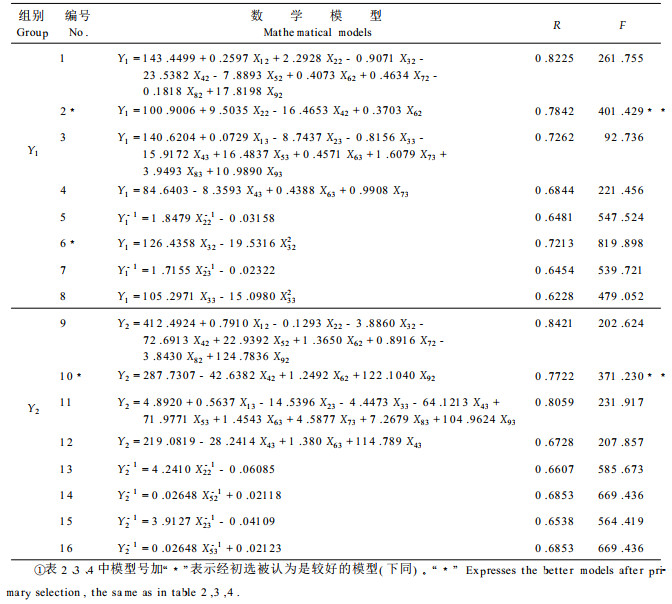
Table 2
Mathematical models of bamboo shoot yield (part)"
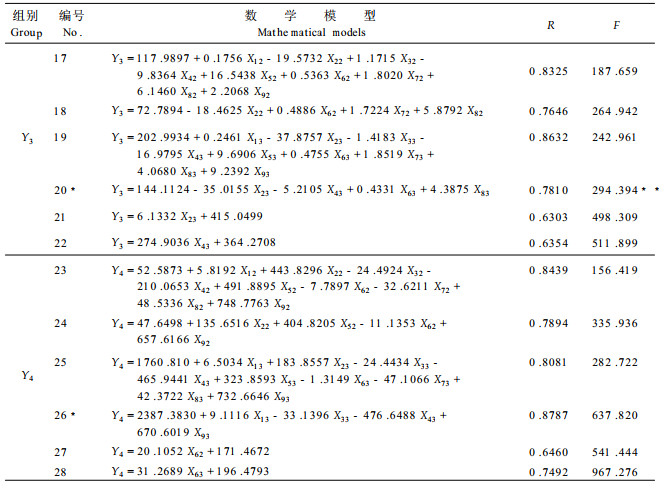
Table 3
Mathematical models of bamboo yield (part)"
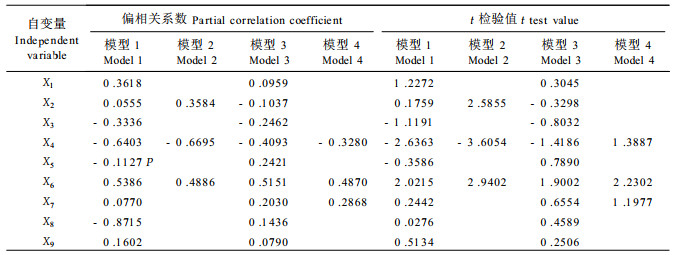
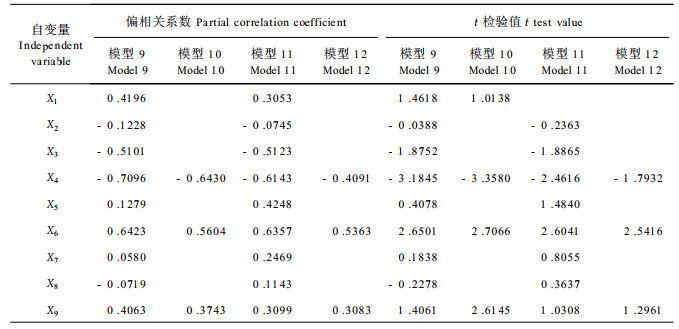
Table 4
Partial correlation coefficient and t test value of partial regression coefficient (group Y1)"
Table 5
Partial correlation coefficient and t test value of partial regression coefficient (group Y2)"
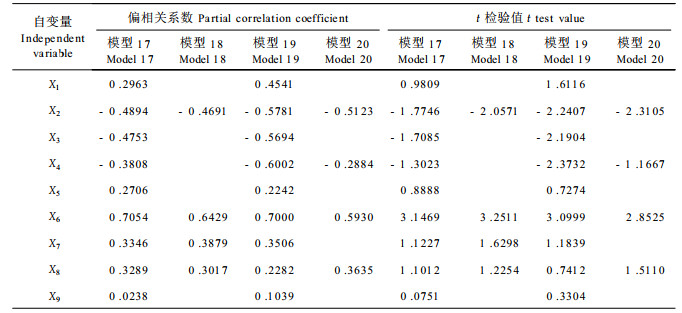
Table 6
Partial correlation coefficient and t test value of partial regression coefficient (group Y3)"
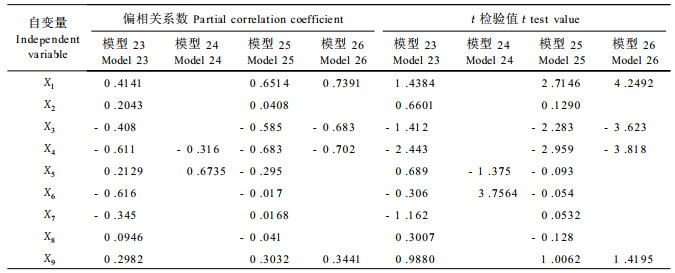
Table 7
Partial correlation coefficient and t test value of partial regression coefficient (group Y4)"
Table 8
Determination value of Cp"
Table 9
Variance inflation coefficient"