
Scientia Silvae Sinicae ›› 2025, Vol. 61 ›› Issue (5): 171-179.doi: 10.11707/j.1001-7488.LYKX20240066
• Research papers • Previous Articles Next Articles
Xinglong Zhou1( ),Jingxing Liu2,Ning Lü2,Jianrong Li1,Jinjuan Yang1,Li Yu1,Junli Yang1,Yuxiang Ji1
Received:2024-02-01
Online:2025-05-20
Published:2025-05-24
CLC Number:
Xinglong Zhou,Jingxing Liu,Ning Lü,Jianrong Li,Jinjuan Yang,Li Yu,Junli Yang,Yuxiang Ji. Genetic Analysis of Different Geographical Populations of Paratrioza sinica in Northwest China[J]. Scientia Silvae Sinicae, 2025, 61(5): 171-179.
Table 1
Sampling data of Paratrioza sinica"
| 采样地点 Sampling site | 种群代码 Population code | 纬度 Latitude | 经度 Longitude | 海拔 Altitude/m | 寄主植物 Host plants | 样本数量 Sample size | 采样时间 Sampling time |
| 惠农区Huinong District | HNQ | 106°41'12'' | 39°5'29'' | 枸杞Lycium barbarum | 24 | 2023?07?08 | |
| 西夏区Xixia District | XXQ | 106°13'15'' | 38°6'48'' | 枸杞Lycium barbarum | 22 | 2023?07?08 | |
| 利通区Litong District | LTQ | 106°12'12'' | 37°47'43'' | 枸杞Lycium barbarum | 22 | 2023?07?05 | |
| 红寺堡区Hongsipu District | HSP | 105°56'43'' | 37°26'23'' | 枸杞Lycium barbarum | 40 | 2023?07?05 | |
| 沙坡头区Shapotou District | SPT | 105°12'15'' | 36°56'7'' | 枸杞Lycium barbarum | 29 | 2023?07?31 | |
| 中宁县Zhongning County | ZNX | 105°39'50'' | 37°29'40'' | 枸杞Lycium barbarum | 40 | 2023?07?07 | |
| 玉门市Yumen City | YMS | 96°59'34'' | 40°20'32'' | 枸杞Lycium barbarum | 33 | 2023?07?15 | |
| 金塔县Jinta County | JinT | 98°44'42'' | 40°11'2'' | 枸杞Lycium barbarum | 33 | 2023?07?18 | |
| 嘉峪关市Jiayuguan City | JYG | 98°22'50'' | 39°50'38'' | 枸杞Lycium barbarum | 22 | 2023?08?17 | |
| 酒泉市Jiuquan City | JQS | 98°30'24'' | 39°46'46'' | 枸杞Lycium barbarum | 17 | 2023?07?17 | |
| 古浪县Gulang County | GLX | 103°37'3'' | 37°32'58'' | 枸杞Lycium barbarum | 28 | 2023?08?04 | |
| 兰州市Lanzhou City | LZS | 103°37'3'' | 36°5′24″ | 枸杞Lycium barbarum | 22 | 2023?07?03 | |
| 景泰县Jingtai County | JTX | 104°6'28'' | 37°17'7'' | 枸杞Lycium barbarum | 40 | 2023?08?04 | |
| 靖远县Jingyuan County | JYX | 105°4'29'' | 36°57'23'' | 枸杞Lycium barbarum | 40 | 2023?07?31 | |
| 阿克塞县Akesai County | AKS | 94°17'53'' | 39°39'24'' | 枸杞Lycium barbarum | 24 | 2023?08?15 | |
| 石河子市Shihezi City | SHZ | 85°28'25'' | 44°53'54'' | 446 | 枸杞Lycium barbarum | 28 | 2023?08?22 |
| 格尔木市Geermu City | GEM | 94°30′47″ | 36°0′38″ | 枸杞Lycium barbarum | 24 | 2023?07?15 | |
| 德令哈市Delingha City | DLH | 96°24′36″ | 36°25′12″ | 枸杞Lycium barbarum | 24 | 2023?06?18 |
Table 2
P. sinica haplotype distribution of different geographical population in Northwest of China"
| 种群代码 Population code | 枸杞木虱单倍型 Haplotypes of P.sinica | |||||
| H1 | H2 | H3 | H4 | H5 | 合计Total | |
| HNQ | 24 | 24 | ||||
| XXQ | 22 | 22 | ||||
| LTQ | 22 | 22 | ||||
| HSP | 40 | 40 | ||||
| SPT | 29 | 29 | ||||
| ZNX | 40 | 40 | ||||
| YMS | 33 | 33 | ||||
| JinT | 33 | 33 | ||||
| JYG | 22 | 22 | ||||
| JQS | 13 | 4 | 17 | |||
| GLX | 13 | 7 | 8 | 28 | ||
| LZS | 22 | 22 | ||||
| JTX | 18 | 12 | 10 | 40 | ||
| JYX | 40 | 40 | ||||
| AKS | 8 | 16 | 24 | |||
| SHZ | 28 | 28 | ||||
| GEM | 24 | 24 | ||||
| DLH | 24 | 24 | ||||
| 合计 Total | 80 | 344 | 48 | 8 | 32 | 512 |
| 比例 Proportion(%) | 15.63 | 67.19 | 9.38 | 1.56 | 6.25 | 100 |
Table 3
Genetic diversity analysis and neutral test of different Paratrioza sinica geographical population in northwest of China"
| 种群代码 Population code | S | h | Hd | π | K | Tajima’s D | Fu’s Fs |
| HNQ | 0 | 1 | 0.000 | 0.000 | 0.000 | — | — |
| XXQ | 0 | 1 | 0.000 | 0.000 | 0.000 | — | — |
| LTQ | 0 | 1 | 0.000 | 0.000 | 0.000 | — | — |
| HSP | 0 | 1 | 0.000 | 0.000 | 0.000 | — | — |
| SPT | 0 | 1 | 0.000 | 0.000 | 0.000 | — | — |
| ZNX | 0 | 1 | 0.000 | 0.000 | 0.000 | — | — |
| YMS | 0 | 1 | 0.000 | 0.000 | 0.000 | — | — |
| JinT | 0 | 1 | 0.000 | 0.000 | 0.000 | — | — |
| JYG | 0 | 1 | 0.000 | 0.000 | 0.000 | — | — |
| JQS | 3 | 2 | 0.464±0.070 | 1.391 | 1.841 | 0.979 | |
| GLX | 4 | 3 | 0.582±0.047 | 1.496 | 1.590 | 0.993 | |
| LZS | 0 | 1 | 0.000 | 0.000 | 0.000 | — | — |
| JTX | 4 | 3 | 0.656±0.030 | 1.477 | 1.362 | 1.027 | |
| JYX | 0 | 1 | 0.000 | 0.000 | 0.000 | — | — |
| AKS | 3 | 2 | 0.464±0.070 | 1.391 | 1.842 | 0.979 | |
| SHZ | 0 | 1 | 0.000 | 0.000 | 0.000 | — | — |
| GEM | 0 | 1 | 0.000 | 0.000 | 0.000 | — | — |
| DLH | 0 | 1 | 0.000 | 0.000 | 0.000 | — | — |
| 合计Total | 5 | 5 | 0.512±0.023 | 1.110 | 0.876 | 0.911 |
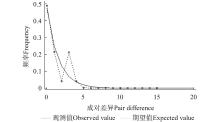
Fig.1
Mismatch distribution analysis of 18 populations of Paratrioza sinica"

Table 4
Pairwise Fst and gene flow Nm values of different geographical populations of Paratrioza sinica"
| 种群代码 Population code | AKS | DLH | GEM | GLX | HNQ | HSP | JinT | JQS | JTX | JYG | JYX | LTQ | LZS | SHZ | SPT | XXQ | YMS | ZNX |
| AKS | 0.000 | 0.000 | 0.000 | inf | 0.000 | 0.000 | 0.000 | inf | 0.303 | 0.478 | 0.000 | 0.000 | 0.000 | 1.012 | inf | inf | 0.478 | |
| DLH | 0.000 | 0.000 | 0.000 | inf | 0.000 | 0.000 | 0.000 | inf | 0.272 | 0.423 | 0.000 | 0.000 | 0.000 | 0.954 | inf | inf | 0.423 | |
| GEM | 0.000 | 0.000 | 0.000 | inf | 0.000 | 0.000 | 0.000 | inf | 0.198 | 0.295 | 0.000 | 0.000 | 0.000 | 0.824 | inf | inf | 0.295 | |
| GLX | 0.000 | 0.000 | 0.000 | inf | 0.000 | 0.000 | 0.000 | inf | 0.237 | 0.363 | 0.000 | 0.000 | 0.000 | 0.892 | inf | inf | 0.363 | |
| HNQ | 1.000 | 1.000 | 1.000 | 1.000 | inf | inf | inf | inf | 1.165 | 1.056 | inf | inf | inf | 0.200 | inf | inf | 1.056 | |
| HSP | 0.000 | 0.000 | 0.000 | 0.000 | 1.000 | 0.000 | 0.000 | inf | 0.198 | 0.295 | 0.000 | 0.000 | 0.000 | 0.824 | inf | inf | 0.295 | |
| JinT | 0.000 | 0.000 | 0.000 | 0.000 | 1.000 | 0.000 | 0.000 | inf | 0.198 | 0.295 | 0.000 | 0.000 | 0.000 | 0.824 | inf | inf | 0.295 | |
| JQS | 0.000 | 0.000 | 0.000 | 0.000 | 1.000 | 0.000 | 0.000 | inf | 0.303 | 0.478 | 0.000 | 0.000 | 0.000 | 1.012 | inf | inf | 0.478 | |
| JTX | 1.000 | 1.000 | 1.000 | 1.000 | 1.000 | 1.000 | 1.000 | 1.000 | 0.341 | 0.929 | inf | inf | inf | 1.141 | inf | inf | 0.929 | |
| JYG | 0.262 | 0.238 | 0.179 | 0.211 | 0.688 | 0.179 | 0.179 | 0.262 | 0.289 | 0.108 | 0.272 | 0.303 | 0.237 | 0.490 | 0.649 | 0.649 | 0.108 | |
| JYX | 0.380 | 0.345 | 0.256 | 0.304 | 0.652 | 0.256 | 0.256 | 0.380 | 0.605 | 0.103 | 0.423 | 0.478 | 0.363 | 0.248 | 0.651 | 0.651 | 0.000 | |
| LTQ | 0.000 | 0.000 | 0.000 | 0.000 | 1.000 | 0.000 | 0.000 | 0.000 | 1.000 | 0.238 | 0.345 | 0.000 | 0.000 | 0.954 | inf | inf | 0.423 | |
| LZS | 0.000 | 0.000 | 0.000 | 0.000 | 1.000 | 0.000 | 0.000 | 0.000 | 1.000 | 0.262 | 0.380 | 0.000 | 0.000 | 1.012 | inf | inf | 0.478 | |
| SHZ | 0.000 | 0.000 | 0.000 | 0.000 | 1.000 | 0.000 | 0.000 | 0.000 | 1.000 | 0.211 | 0.304 | 0.000 | 0.000 | 0.892 | inf | inf | 0.363 | |
| SPT | 0.636 | 0.615 | 0.561 | 0.590 | 0.181 | 0.561 | 0.561 | 0.636 | 0.681 | 0.388 | 0.220 | 0.615 | 0.636 | 0.590 | 0.710 | 0.710 | 0.248 | |
| XXQ | 1.000 | 1.000 | 1.000 | 1.000 | 1.000 | 1.000 | 1.000 | 1.000 | 1.000 | 0.478 | 0.478 | 1.000 | 1.000 | 1.000 | 0.508 | 0.000 | 0.651 | |
| YMS | 1.000 | 1.000 | 1.000 | 1.000 | 1.000 | 1.000 | 1.000 | 1.000 | 1.000 | 0.478 | 0.478 | 1.000 | 1.000 | 1.000 | 0.508 | 0.000 | 0.651 | |
| ZNX | 0.380 | 0.345 | 0.256 | 0.304 | 0.652 | 0.256 | 0.256 | 0.380 | 0.605 | 0.103 | -0.043 | 0.345 | 0.380 | 0.304 | 0.220 | 0.478 | 0.478 |
Table 5
Analysis of molecular variance (AMOVA) of Paratrioza sinica different geographical populations"
| 变异来源 Source of variation | 自由度 df | 平方和 Sum of squares | 方差组分 Variance components | 变异百分率 Percentage of variation | Fst |
| 种群间变异 Among populations | 17 | 181.557 | 0.371 32 Va | 64.28 | 0.642 78 |
| 种群内变异 Within populations | 494 | 101.943 | 0.206 36 Vb | 35.72 | |
| 总变异 Total | 511 | 283.500 | 0.577 68 | 100% |
Table 6
Genetic distance among Paratrioza sinica different geographical populations of COI gene"
| 种群代码 Population code | AKS | DLH | GEM | GLX | HNQ | HSP | JinT | JQS | JTX | JYG | JYX | LTQ | LZS | SHZ | SPT | XXQ | YMS |
| DLH | 0.003 | ||||||||||||||||
| GEM | 0.003 | 0.000 | |||||||||||||||
| GLX | 0.004 | 0.004 | 0.004 | ||||||||||||||
| HNQ | 0.002 | 0.002 | 0.002 | 0.005 | |||||||||||||
| HSP | 0.002 | 0.002 | 0.002 | 0.005 | 0.000 | ||||||||||||
| JinT | 0.002 | 0.002 | 0.002 | 0.005 | 0.000 | 0.000 | |||||||||||
| JQS | 0.003 | 0.003 | 0.003 | 0.004 | 0.002 | 0.002 | 0.002 | ||||||||||
| JTX | 0.004 | 0.004 | 0.004 | 0.005 | 0.002 | 0.002 | 0.002 | 0.004 | |||||||||
| JYG | 0.005 | 0.005 | 0.005 | 0.007 | 0.002 | 0.002 | 0.002 | 0.005 | 0.003 | ||||||||
| JYX | 0.002 | 0.002 | 0.002 | 0.005 | 0.000 | 0.000 | 0.000 | 0.002 | 0.002 | 0.002 | |||||||
| LTQ | 0.002 | 0.002 | 0.002 | 0.005 | 0.000 | 0.000 | 0.000 | 0.002 | 0.002 | 0.002 | 0.000 | ||||||
| LZS | 0.002 | 0.002 | 0.002 | 0.005 | 0.000 | 0.000 | 0.000 | 0.002 | 0.002 | 0.002 | 0.000 | 0.000 | |||||
| SHZ | 0.005 | 0.005 | 0.005 | 0.002 | 0.007 | 0.007 | 0.007 | 0.005 | 0.006 | 0.009 | 0.007 | 0.007 | 0.007 | ||||
| SPT | 0.002 | 0.002 | 0.002 | 0.005 | 0.000 | 0.000 | 0.000 | 0.002 | 0.002 | 0.002 | 0.000 | 0.000 | 0.000 | 0.007 | |||
| XXQ | 0.002 | 0.002 | 0.002 | 0.005 | 0.000 | 0.000 | 0.000 | 0.002 | 0.002 | 0.002 | 0.000 | 0.000 | 0.000 | 0.007 | 0.000 | ||
| YMS | 0.002 | 0.002 | 0.002 | 0.005 | 0.000 | 0.000 | 0.000 | 0.002 | 0.002 | 0.002 | 0.000 | 0.000 | 0.000 | 0.007 | 0.000 | 0.000 | |
| ZNX | 0.002 | 0.002 | 0.002 | 0.005 | 0.000 | 0.000 | 0.000 | 0.002 | 0.002 | 0.002 | 0.000 | 0.000 | 0.000 | 0.007 | 0.000 | 0.000 | 0.000 |
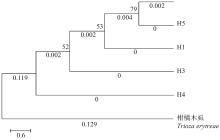
Fig.2
Haplotype phylogenetic tree of Paratrioza sinica geographical populations neighbor-joining method of COI gene sequences"
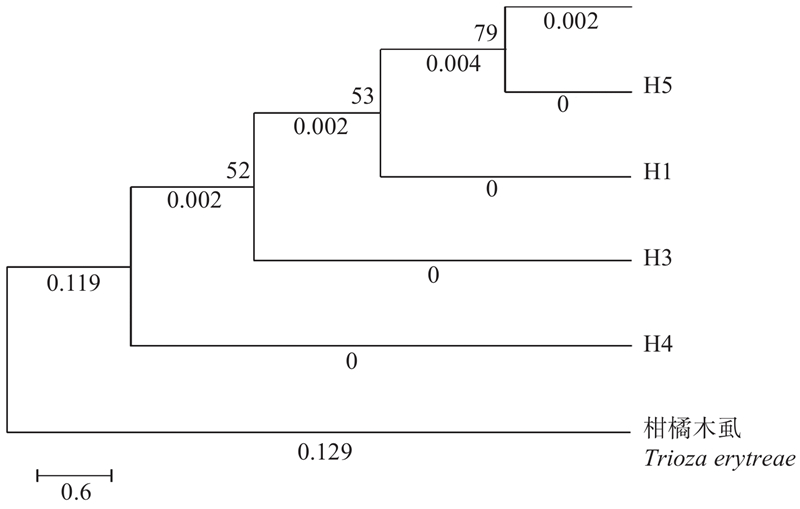
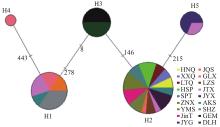
Fig.3
Median-joining network of haplotypes of Paratrioza sinica"
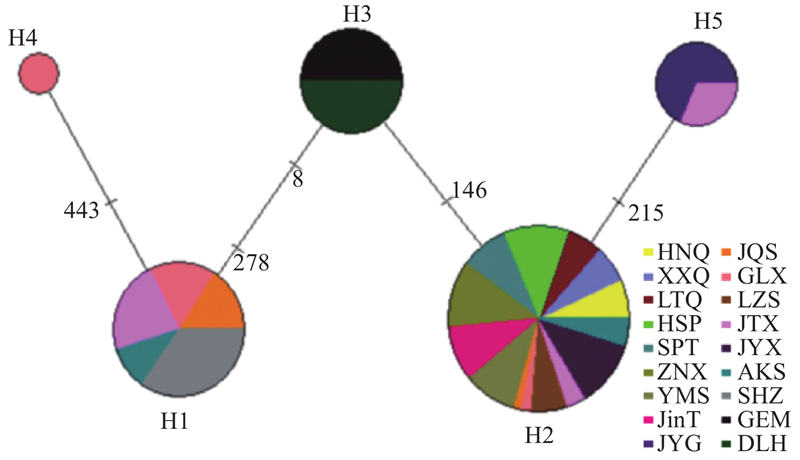
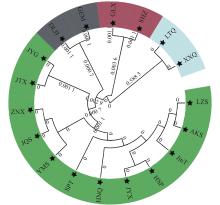
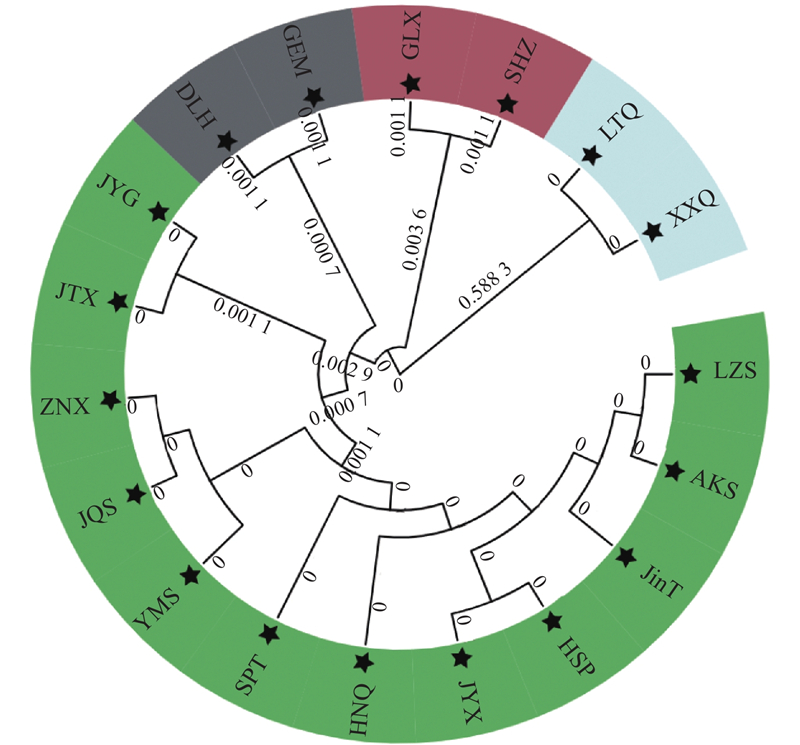
Fig.4
UPGMA dendrogram of 18 populations Paratrioza sinica geographical populations based on COI gene sequences"
| 姜 宁, 夏振远, 谢永辉, 等. 基于线粒体COI基因的云南西花蓟马种群遗传多样性研究. 中国烟草学报, 2023, 29 (4): 66- 75. | |
| Jiang N, Xia Z Y, Xie Y H, et al. Polulation genetic diversity of Frankliniella occidentalis in Yunnan based on mtDNA COI gene. Acta Tabacaria Sinica, 2023, 29 (4): 66- 75. | |
| 马力文, 刘 静. 2018. 枸杞气象业务服务. 北京: 气象出版社. | |
| Ma L W, Liu J. 2018. Meteorological business service of wolfberry. Beijing: Meteorological Press. [in Chinese] | |
|
沈登荣, 宋文菲, 袁盛勇. 等. 基于mtDNA-COⅠ的云南西花蓟马的遗传分析. 植物保护, 2014, 40 (5): 75- 79.
doi: 10.3969/j.issn.0529-1542.2014.05.013 |
|
|
Shen D R, Song W F, Yuan S Y, et al. Genetic analysis of Frankliniella occidentalis based on mt DNA-COI in Yunnan, China. Plant Protection, 2014, 40 (5): 75- 79.
doi: 10.3969/j.issn.0529-1542.2014.05.013 |
|
| 谢艳兰, 张宏瑞, 李正跃. 基于线粒体 COI基因的中国西南地区木领针蓟马地理种群的遗传分化分析. 昆虫学报, 2019, 62 (3): 370- 380. | |
| Xie Y L, Zhang H R, Li Z Y. Analysis of genetic differentiation among geographic populations of Helionothrips mube (Thysanoptera: Thripidae) in southwestern China based on mitochondrial COI gene. Acta Entomologica Sinica, 2019, 62 (3): 370- 380. | |
| 熊忠平, 吴培福, 徐 磊,等. 2018. 二斑栗实象COI序列多态性分析. 西南林业大学学报(自然科学), 38(1): 110−116. | |
| Xiong Z P, Wu P F, Xu L, et al. 2018 Analysis of COI Genetic Sequence Polymorphisms of Curculio bimaculatus. Journal of Southwest Forestry University, 38(1): 110−116. [in Chinese] | |
| 徐 磊, 季莹莹, 黎 红, 等. 基于线粒体COI基因的南海浮游介形类斜突浮萤单倍型与种群遗传结构研究. 生态科学, 2019, 38 (5): 15- 22. | |
| Xu L, Ji Y Y, Li H, et al. Genetic structure and haplotype pattern of marine planktonic ostracod Proceroecia procera from the South China Sea based on the mitochondrial COI gene. Ecological Science, 2019, 38 (5): 15- 22. | |
| 杨顺义, 周兴隆, 宋丽雯, 等. 基于mt DNA COI基因的甘肃截形叶螨不同地理种群遗传分化分析. 昆虫学报, 2017, 60 (9): 1083- 1092. | |
| Yang S Y, Zhou X L, Song L W, et al. Analysis of genetic differentiation among different geographic populations of Tetranychus truncatus (Acari: Tetranychidae) in Gansu province, northwestern China based on mt DNA COI gene. Acta Entomologica Sinica, 2017, 60 (9): 1083- 1092. | |
| 张海燕, 陈光辉, 古丽扎尔·阿不都克力木. 等, 2021. 基于mt DNA COI基因的新疆部分地区叶蝉的分子鉴定. 中国农学通报, 37(36): 119−129. | |
| Zhang H Y, Chen G H, Gulinazha A, et al. 2021. Cicadellidae in some areas of Xinjiang: molecular identification based on mt DNA COI gene. Chinese Agricultural Science Bulletin, 37(36): 119−129. [in Chinese] | |
|
郑梓豪, 吴珊珊, 魏 勇, 等. 基于线粒体COI基因分析广州市15个白纹伊蚊种群的遗传多样性. 中国人兽共患病学报, 2021, 37 (11): 985- 994.
doi: 10.3969/j.issn.1002-2694.2021.00.141 |
|
|
Zheng Z H, Wu S S, Wei Y, et al. Analysis of the genetic diversity of 15 Aedes albopictus populations in Guangzhou based on the mitochondrial COI gene. Chinese Journal of Zoonoses, 2021, 37 (11): 985- 994.
doi: 10.3969/j.issn.1002-2694.2021.00.141 |
|
| 朱玉溪, 王欣宇, 杨 润, 等. 昆虫共生菌调控宿主温度适应性研究进展. 植物保护学报, 2022, 49 (6): 1565- 1575. | |
| Zhu Y X, Wang X Y, Yang R, et al. Advances in researches on symbiont-mediated thermal adaption in insects. Journal of Plant Protection, 2022, 49 (6): 1565- 1575. | |
|
Bandelt H J, Forster P, Rohl A. Median-joining networks for inferring intraspecific phylogenies. Molecular Biology and Evolution, 1999, 16 (1): 37- 48.
doi: 10.1093/oxfordjournals.molbev.a026036 |
|
| Chen Y T, Zhang Y K, Du W X, et al. 2016. Geography has a greater effect than Wolbachia infection on population genetic structure in the spider mite, Tetranychus pueraricola. Bulletin of Entomological Research , 106(5): 685. | |
|
Excoffier L, Lischer H E. Arlequin suite ver 3.5: a new series of programs to perform population genetics analyses under Linux and Windows. Molecular Ecology Resources, 2010, 10 (3): 564- 567.
doi: 10.1111/j.1755-0998.2010.02847.x |
|
| Frankham R, Ballou J D, Briscoe D A. 2002. Introduction to conservation genetics . Cambridge: Cambridge University Press: 5-30. | |
|
Grant W A S, Bowen B W. Shallow population histories in deep evolutionary lineages of marine fishes: insights from sardines and anchovies and lessons for conservation. Journal of Heredity, 1998, 89 (5): 415- 426.
doi: 10.1093/jhered/89.5.415 |
|
| Hague M T, Caldwell C N, Cooper B S. Pervasive effects of Wolbachia on host temperature preference. mBio, 2020, 11 (5): e01768- 20. | |
|
Ju J F, Bing X L, Zhao D S, et al. Wolbachia supplement biotin and riboflavin to enhance reproduction in planthoppers. The ISME Journal, 2020, 14 (3): 676- 687.
doi: 10.1038/s41396-019-0559-9 |
|
|
Knight A, Mindell D P. Substitution Bias. Weighting of DNA sequence evolution and the phylogenetic position of Fea's Viper. Systems Biology, 1993, 42 (1): 18- 31.
doi: 10.1093/sysbio/42.1.18 |
|
| Lan H, Shi L. The origin and genetic differentiation of nativebreeds of pigs in southwest China: an approach from mitochondrial DNA polymorphism. Biochemical Genetics, 1993, 31 (1/2): 51- 60. | |
| Lohman D J, Peccie D, Pierce N E, et al. 2008. Phylogeography and genetic diversity of a widespread old world butterfly, Lampides boeticus (Lepidoptera: Lycaenidae). BMCE Volutionary Biology, (8): 301. | |
|
Marullo R, Mercati F, Vono G. DNA barcoding: A reliable method for the identification of thrips species (Thysanoptera, Thripidae) collected on sticky traps in onion fields. Insects, 2020, 11 (8): 489.
doi: 10.3390/insects11080489 |
|
| Miller N, Birley A J, Overall A D J, et al. 2003. Population genetic structure of the lettuce root aphid, Pemphigus bursar (L. ), in relation to geographic distance, gene flow andlushost plant usage. Heredity, 91(3): 217−223. | |
|
Nneji L M, Adeola A C, Ayoola A O, et al. DNA barcoding and species delimitation of butterflies (Lepidoptera) from Nigeria. Molecular Biology Reports, 2020, 47 (12): 9441- 9457.
doi: 10.1007/s11033-020-05984-5 |
|
| Rogers A R, Harpending H. Population growth makes waves in the distribution of pairwise genetic differences. Mol Biol Evol, 1992, 9 (3): 552- 569. | |
|
Rozas J, Ferrer-Mata A, Sanchez-Delbarrio J C, et al. DnaSP 6: DNA sequence polymorphism analysis of large data sets. Molecular Biology and Evolution, 2017, 34 (12): 3299- 3302.
doi: 10.1093/molbev/msx248 |
|
|
Simon C, Frati F, Beckenbach A, et al. Evolution, Weighting, and phylogenetic utility of mitochondrial gene sequences and a compilation of conserved polymerase chain reaction primers. Annals of the Entomological Society of America, 1994, 87 (6): 651- 701.
doi: 10.1093/aesa/87.6.651 |
|
| Skibinski D O, Gallagher C, Beynon C M. Mitochondrial DNAinheritance. Nature, 1994, 368 (6474): 817- 818. | |
| Symondson W O C, Lidddll J E. 1996. The ecology of agricultural pests: biochemical approaches. London: Chapmanand Hall, Melbourne. 231−263. | |
| Vrijenhoek R C, 1994. Genetic diversity and fitness in small populations. Conserv Genet, 68: 37−53. | |
| Zhang Y K, Ding X L, Zhang K J, et al. Wolbachia play an important role in affecting mt DNA variation of Tetranychus truncatus (Trombidiformes: Tetranychidae). Environmental Entomology, 2013, 42 (6): 1240- 1245. |
| [1] | Xinyu Li,Minqiu Wang,Meiling Yuan,Ueno Saneyoshi,Xingtong Wu,Mengying Cai,Tsumura Yoshihiko,Yafeng Wen. Genetic Differentiation and Demographic History of Cryptomeria, A Relict Plant, in East Asia [J]. Scientia Silvae Sinicae, 2022, 58(6): 66-78. |
| [2] | Yuanchen Zhang,Shaohui Lu,Dongfeng Gong,Xingli Ma. Analysis of Genetic Diversity and Genetic Structure in Geographic Populations of Corythucha ciliata(Hemiptera: Tingidae) from China Based on Mitochondrial DNA COⅠ Gene Sequences [J]. Scientia Silvae Sinicae, 2021, 57(8): 102-111. |
| [3] | Ma Songmei, Wang Chuncheng, Sun Fangfang, Wei Bo, Nie Yingbin. Genetic Diversity of an Endangered Plant Amygdalus ledebouriana in Xinjiang [J]. Scientia Silvae Sinicae, 2019, 55(9): 71-80. |
| [4] | Zhang Shouke, Fang Linxin, Liu Yaning, Wang Yi, Zhang Wei, Shu Jinping, Zhang Yabo, Wang Yangdong, Wang Haojie. Genetic Differentiation and Structural Variation of ATP Synthase Gene of Curculio chinensis (Coleptera: Curculionidae) under Selection Pressure at Different Altitudes [J]. Scientia Silvae Sinicae, 2019, 55(6): 65-73. |
| [5] | Wang Yanhong, Yu Qi, Yang Jia, Zhao Peng, Li Zhonghu, Zhao Guifang. Genetic Diversity and Population Structure of Quercus serrata var.brevipetiolata Revealed by nSSR Markers [J]. Scientia Silvae Sinicae, 2015, 51(12): 121-131. |
| [6] | Xia Mingrui;Zhou Guona;Gao Baojia;. Sequence Variation of CO Ⅰ Gene of Dendrolimus tabulaeformis in Different Types of Stand [J]. Scientia Silvae Sinicae, 2012, 48(9): 171-175. |
| [7] | Li Nan;Liu Xinhong;Li Yingang;Li Haibo;Sheng Weitong;Hui Gangying;Zheng Yongqi. Genetic Diversity in Natural Populations of Styrax tonkinensis [J]. Scientia Silvae Sinicae, 2012, 48(11): 49-56. |
| [8] | Tang Qin;Zeng Xiuli;Liao Ming'an;Pan Guangtang;Zha Xi;Gong Junhua;Ciren Zhuoga. SRAP Analysis of Genetic Diversity of Paeonia ludlowii in Tibet [J]. Scientia Silvae Sinicae, 2012, 48(1): 70-76. |
| [9] | Gao Baojia;Du Juan;Gao Suhong;Liu Junxia. Genetic Diversity and Differentiations of Fall Webworm (Hyphantria cunea) Populations [J]. Scientia Silvae Sinicae, 2010, 46(8): 120-124. |
| [10] | Wang Tiejuan;Li Weiqiong;Zhang Shuyan;Meng Xiangfei. Genetic Diversity and Differentiation of Five Natural Populations of Artemisia halodendron [J]. Scientia Silvae Sinicae, 2010, 46(12): 171-175. |
| [11] | Zhang Rui;Zhou Zhichun;Jin Guoqing;Luo Wenjian . Genetic Diversity and Genetic Differentiation of Taxus wallichiana var. mairei Provenances [J]. Scientia Silvae Sinicae, 2009, 12(1): 50-56. |
| [12] | Huang Jiuxiang;Huang Feiben;Xu Han;Li Yide;Zhuang Xueying. Genetic Diversity of Vatica mangachapoi in Hainan Island Revealed by AFLP [J]. Scientia Silvae Sinicae, 2008, 44(5): 46-52. |
| [13] | Li Yingang;Zhou Zhichun;Jin Guoqing. Genetic Diversity for Different Provenances of Cephalotaxus fortunei [J]. Scientia Silvae Sinicae, 2008, 44(2): 64-69. |
| [14] | Wang Hua;Hao Junmin;Wang Baoqing;Pei Dong. SSR Analysis of Genetic Diversity of Eight Natural Walnut Populations in China [J]. Scientia Silvae Sinicae, 2007, 43(7): 120-124. |
| [15] | Zhang Ping;Zhou Zhichun;Jin Guoqing;Fan Huihua;Hu Hongbao. Genetic Diversity Analysis and Provenance Zone Allocation of Schima superba in China Using RAPD Markers [J]. Scientia Silvae Sinicae, 2006, 42(2): 38-42. |
| Viewed | ||||||
|
Full text |
|
|||||
|
Abstract |
|
|||||