
Scientia Silvae Sinicae ›› 2022, Vol. 58 ›› Issue (4): 40-50.doi: 10.11707/j.1001-7488.20220405
• Research papers • Previous Articles Next Articles
Huiling Tian1,Jianhua Zhu1,2,*,Xiao He3,Xinyun Chen4,Zunji Jian1,Chenyu Li1,Xueyuan Guo1,Guosheng Huang4,Wenfa Xiao1,2
Received:2021-11-16
Online:2022-04-25
Published:2022-07-20
Contact:
Jianhua Zhu
CLC Number:
Huiling Tian,Jianhua Zhu,Xiao He,Xinyun Chen,Zunji Jian,Chenyu Li,Xueyuan Guo,Guosheng Huang,Wenfa Xiao. Projected Biomass Carbon Stock of Arbor Forest of Three Provinces in Northeastern China Based on Random Forest Model[J]. Scientia Silvae Sinicae, 2022, 58(4): 40-50.
Table 1
Afforestation and reforestation area of arbors from 2016 to 2060 of three provinces in northeast China 104hm2"
| 年份Year | 辽宁Liaoning | 吉林Jilin | 黑龙江Heilongjiang | 合计Total | |||||||
| 人工 Planted | 天然 Natural | 人工 Planted | 天然 Natural | 人工 Planted | 天然 Natural | 人工 Planted | 天然 Natural | ||||
| 2016—2020 | 1.42 | 0.71 | 7.41 | 3.70 | 64.20 | 32.10 | 73.03 | 36.52 | |||
| 2021—2025 | 1.32 | 0.66 | 6.89 | 3.45 | 59.74 | 29.87 | 67.95 | 33.98 | |||
| 2026—2030 | 1.25 | 0.63 | 6.52 | 3.26 | 56.50 | 28.25 | 64.27 | 32.14 | |||
| 2031—2035 | 1.20 | 0.60 | 6.24 | 3.12 | 54.05 | 27.03 | 61.48 | 30.74 | |||
| 2036—2040 | 1.16 | 0.58 | 6.02 | 3.01 | 52.19 | 26.10 | 59.37 | 29.69 | |||
| 2041—2045 | 1.13 | 0.56 | 5.86 | 2.93 | 50.79 | 25.39 | 57.77 | 28.89 | |||
| 2046—2050 | 0.44 | 0.22 | 2.29 | 1.15 | 19.89 | 9.94 | 22.62 | 11.31 | |||
| 2051—2055 | 0.00 | 0.00 | 0.00 | 0.00 | 0.00 | 0.00 | 0.00 | 0.00 | |||
| 2056—2060 | 0.00 | 0.00 | 0.00 | 0.00 | 0.00 | 0.00 | 0.00 | 0.00 | |||
| 2016—2060 | 7.92 | 3.96 | 41.23 | 20.62 | 357.36 | 178.68 | 406.51 | 203.25 | |||
Table 2
Biomass-volume model and carbon accounting factors for dominant tree species (groups) of three provinces in northeast China"
| 起源 Origin | 优势树种(组) Dominant tree species (group) | 现有林面积 Existing forest area/ 104 hm2 | 生物量-蓄积模型Bj, p=aj×Vj, pbj×λj Biomass-volume model | 生物量含碳率 Biomass carbon fraction | ||||
| 样本数 Sample number | a | b | 相关系数 Correlation coefficient (R2) | 校正系数 Correction coefficient (λ) | ||||
| 天然林 Natural forest | 云杉Picea asperata | 13.02 | 25 | 5.413 | 0.633 | 0.966 | 1.012 | 0.493 |
| 落叶松Larix gmelinii | 227.79 | 38 | 2.985 | 0.746 | 0.902 | 1.022 | 0.489 | |
| 油松Pinus tabulaeformis | 6.35 | 72 | 2.475 | 0.752 | 0.951 | 1.013 | 0.517 | |
| 栎类Quercus | 348.65 | 18 | 1.682 | 0.918 | 0.978 | 1.007 | 0.480 | |
| 白桦Betula platyphylla | 319.48 | 12 | 8.329 | 0.467 | 0.627 | 1.050 | 0.487 | |
| 榆树Ulmus pumila | 39.64 | 59 | 3.300 | 0.741 | 0.884 | 1.035 | 0.476 | |
| 杨树Populus | 64.01 | 19 | 1.703 | 0.803 | 0.884 | 1.027 | 0.491 | |
| 针叶混交林Mixed coniferous forest | 45.99 | 11 | 6.699 | 0.538 | 0.808 | 1.012 | 0.502 | |
| 阔叶混交林Mixed broadleaved forest | 1 179.05 | 20 | 1.526 | 0.908 | 0.898 | 1.028 | 0.479 | |
| 针阔混交林Mixed coniferous and broadleaved forest | 248.10 | 54 | 3.088 | 0.734 | 0.832 | 1.033 | 0.494 | |
| 小计Subtotal | 2 568.28 | |||||||
| 人工林 Planted forest | 云杉Picea asperata | 13.15 | 25 | 5.413 | 0.633 | 0.966 | 1.012 | 0.493 |
| 落叶松Larix gmelinii | 208.17 | 38 | 2.985 | 0.746 | 0.902 | 1.022 | 0.489 | |
| 樟子松Pinus sylvestris var. mongolica | 28.78 | 39 | 5.117 | 0.602 | 0.889 | 1.017 | 0.511 | |
| 油松Pinus tabulaeformis | 41.40 | 72 | 2.475 | 0.752 | 0.951 | 1.013 | 0.517 | |
| 栎类Quercus | 12.56 | 18 | 1.682 | 0.918 | 0.978 | 1.007 | 0.480 | |
| 杨树Populus | 146.56 | 19 | 1.703 | 0.803 | 0.884 | 1.027 | 0.491 | |
| 针叶混交林Mixed coniferous forest | 76.32 | 11 | 6.699 | 0.538 | 0.808 | 1.012 | 0.502 | |
| 阔叶混交林Mixed broadleaved forest | 90.66 | 20 | 1.526 | 0.908 | 0.898 | 1.028 | 0.479 | |
| 小计Subtotal | 617.59 | |||||||
Table 3
Optimal model evaluation indicators of volume gross growth of dominant tree species (group) in natural and planted forests"
| 起源Origin | 优势树种(组)Dominant tree species (group) | 样地数Sample plot number | 最优模型mtry mtry of the optimal model | 10折交叉验证评价指标10-fold cross-validation evaluation index | ||
| R2 | MAE/m3 | RMSE/m3 | ||||
| 天然林 Natural forest | 云杉Picea asperata | 43 | 8 | 0.740 | 0.677 | 1.050 |
| 落叶松Larix gmelinii | 660 | 29 | 0.653 | 0.457 | 0.606 | |
| 油松Pinus tabulaeformis | 31 | 28 | 0.481 | 1.191 | 1.364 | |
| 栎类Quercus | 1 657 | 29 | 0.661 | 0.506 | 0.726 | |
| 白桦Betula platyphylla | 861 | 13 | 0.392 | 0.866 | 1.158 | |
| 榆树Ulmus pumila | 24 | 20 | 0.829 | 0.977 | 1.042 | |
| 杨树Populus | 73 | 14 | 0.670 | 1.112 | 1.488 | |
| 针叶混交林Mixed coniferous forest | 169 | 16 | 0.684 | 1.350 | 1.913 | |
| 阔叶混交林Mixed broadleaved forest | 4 376 | 5 | 0.308 | 1.237 | 1.643 | |
| 针阔混交林Mixed coniferous and broadleaved forest | 474 | 5 | 0.396 | 1.422 | 1.820 | |
| 人工林 Planted forest | 云杉Picea asperata | 29 | 29 | 0.828 | 2.573 | 2.908 |
| 落叶松Larix gmelinii | 939 | 19 | 0.409 | 1.902 | 2.519 | |
| 樟子松Pinus sylvestris var. mongolica | 134 | 1 | 0.350 | 1.990 | 2.586 | |
| 油松Pinus tabulaeformis | 220 | 28 | 0.570 | 0.375 | 0.451 | |
| 栎类Quercus | 33 | 26 | 0.416 | 1.877 | 2.137 | |
| 杨树Populus | 713 | 28 | 0.466 | 1.979 | 2.585 | |
| 针叶混交林Mixed coniferous forest | 30 | 19 | 0.485 | 1.923 | 2.501 | |
| 阔叶混交林Mixed broadleaved forest | 69 | 13 | 0.443 | 1.445 | 1.865 | |
Table 4
Confusion matrix and evaluation indicators of mortality model of dominant tree species (group) in natural and planted forests"
| 起源 Origin | 实际样地数 Actual sample plot number | 预测样地数Predictive sample plot number | 误差率 Error rate (%) | 评价指标Evaluation index | |||
| 发生枯损 Mortality | 未发生枯损 Non-mortality | R2 | MAE | RMSE | |||
| 天然林 Natural forest | 发生枯损 Mortality | 2 596 | 4 | 0.15 | 0.671 | 0.399 | 0.806 |
| 未发生枯损 Non-mortality | 138 | 5 630 | 2.39 | ||||
| 人工林 Planted forest | 发生枯损 Mortality | 1 188 | 12 | 1.00 | 0.731 | 0.598 | 1.126 |
| 未发生枯损 Non-mortality | 2 | 965 | 0.21 | ||||
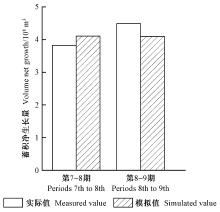
Fig.1
Comparison between the measured and the random forest model simulated national forest inventories of three provinces in northeast China"

Table 5
Carbon storage, annual carbon sink, and carbon density of existing and new arbor forests from 2015 to 2060 of three provinces in northeast China"
| 项目Item | 年份 Year | 天然林Natural forest | 人工林Planted forest | 乔木林Arbor forest | ||||||||
| 碳储量 Carbon storage/ TgC | 年碳汇量 Annual carbon sink/ (TgC·a-1) | 碳密度 Carbon density/ (MgC·hm-2) | 碳储量 Carbon storage/ TgC | 年碳汇量 Annual carbon sink/ (TgC·a-1) | 碳密度 Carbon density/ (MgC·hm-2) | 碳储量 Carbon storage/ TgC | 年碳汇量 Annual carbon sink/ (TgC·a-1) | 碳密度 Carbon density/ (MgC·hm-2) | ||||
| 现有林地 Existing woodland | 2015 | 1 321.48 | — | 51.45 | 176.43 | — | 28.57 | 1 497.92 | — | 47.02 | ||
| 2020 | 1 487.56 | 33.22 | 57.92 | 219.44 | 8.60 | 35.53 | 1 707.00 | 41.82 | 53.58 | |||
| 2025 | 1 646.33 | 31.75 | 64.10 | 253.74 | 6.86 | 41.08 | 1 900.06 | 38.61 | 59.64 | |||
| 2030 | 1 800.86 | 30.91 | 70.12 | 283.45 | 5.94 | 45.90 | 2 084.31 | 36.85 | 65.42 | |||
| 2035 | 1 951.94 | 30.22 | 76.00 | 309.89 | 5.29 | 50.18 | 2 261.83 | 35.50 | 71.00 | |||
| 2040 | 2 100.40 | 29.69 | 81.78 | 334.47 | 4.92 | 54.16 | 2 434.87 | 34.61 | 76.43 | |||
| 2045 | 2 243.45 | 28.61 | 87.35 | 356.34 | 4.37 | 57.70 | 2 599.79 | 32.98 | 81.60 | |||
| 2050 | 2 384.38 | 28.19 | 92.84 | 377.24 | 4.18 | 61.08 | 2 761.62 | 32.37 | 86.68 | |||
| 2055 | 2 523.51 | 27.83 | 98.26 | 397.52 | 4.06 | 64.37 | 2 921.03 | 31.88 | 91.69 | |||
| 2060 | 2 660.88 | 27.47 | 103.61 | 417.31 | 3.96 | 67.57 | 3 078.19 | 31.43 | 96.62 | |||
| 新增林地 New woodland | 2015 | 0 | — | 0 | 0 | — | 0 | 0 | — | 0 | ||
| 2020 | 3.04 | 0.61 | 8.32 | 11.64 | 2.33 | 15.93 | 14.68 | 2.94 | 13.40 | |||
| 2025 | 7.92 | 0.98 | 11.23 | 31.18 | 3.91 | 22.12 | 39.10 | 4.89 | 18.49 | |||
| 2030 | 14.42 | 1.30 | 14.05 | 56.94 | 5.15 | 27.74 | 71.36 | 6.45 | 23.18 | |||
| 2035 | 22.36 | 1.59 | 16.76 | 87.36 | 6.08 | 32.75 | 109.72 | 7.67 | 27.42 | |||
| 2040 | 31.65 | 1.86 | 19.41 | 121.41 | 6.81 | 37.23 | 153.06 | 8.67 | 31.29 | |||
| 2045 | 42.15 | 2.10 | 21.96 | 158.10 | 7.34 | 41.18 | 200.26 | 9.44 | 34.78 | |||
| 2050 | 52.45 | 2.06 | 25.80 | 191.58 | 6.70 | 47.13 | 244.03 | 8.75 | 40.02 | |||
| 2055 | 62.04 | 1.92 | 30.52 | 219.60 | 5.60 | 54.02 | 281.63 | 7.52 | 46.19 | |||
| 2060 | 71.27 | 1.85 | 35.06 | 243.69 | 4.82 | 59.95 | 314.95 | 6.66 | 51.65 | |||

Fig.2
Variations in carbon storage and carbon density of arbor forest from 2015 to 2060 of various provinces in Northeast China"
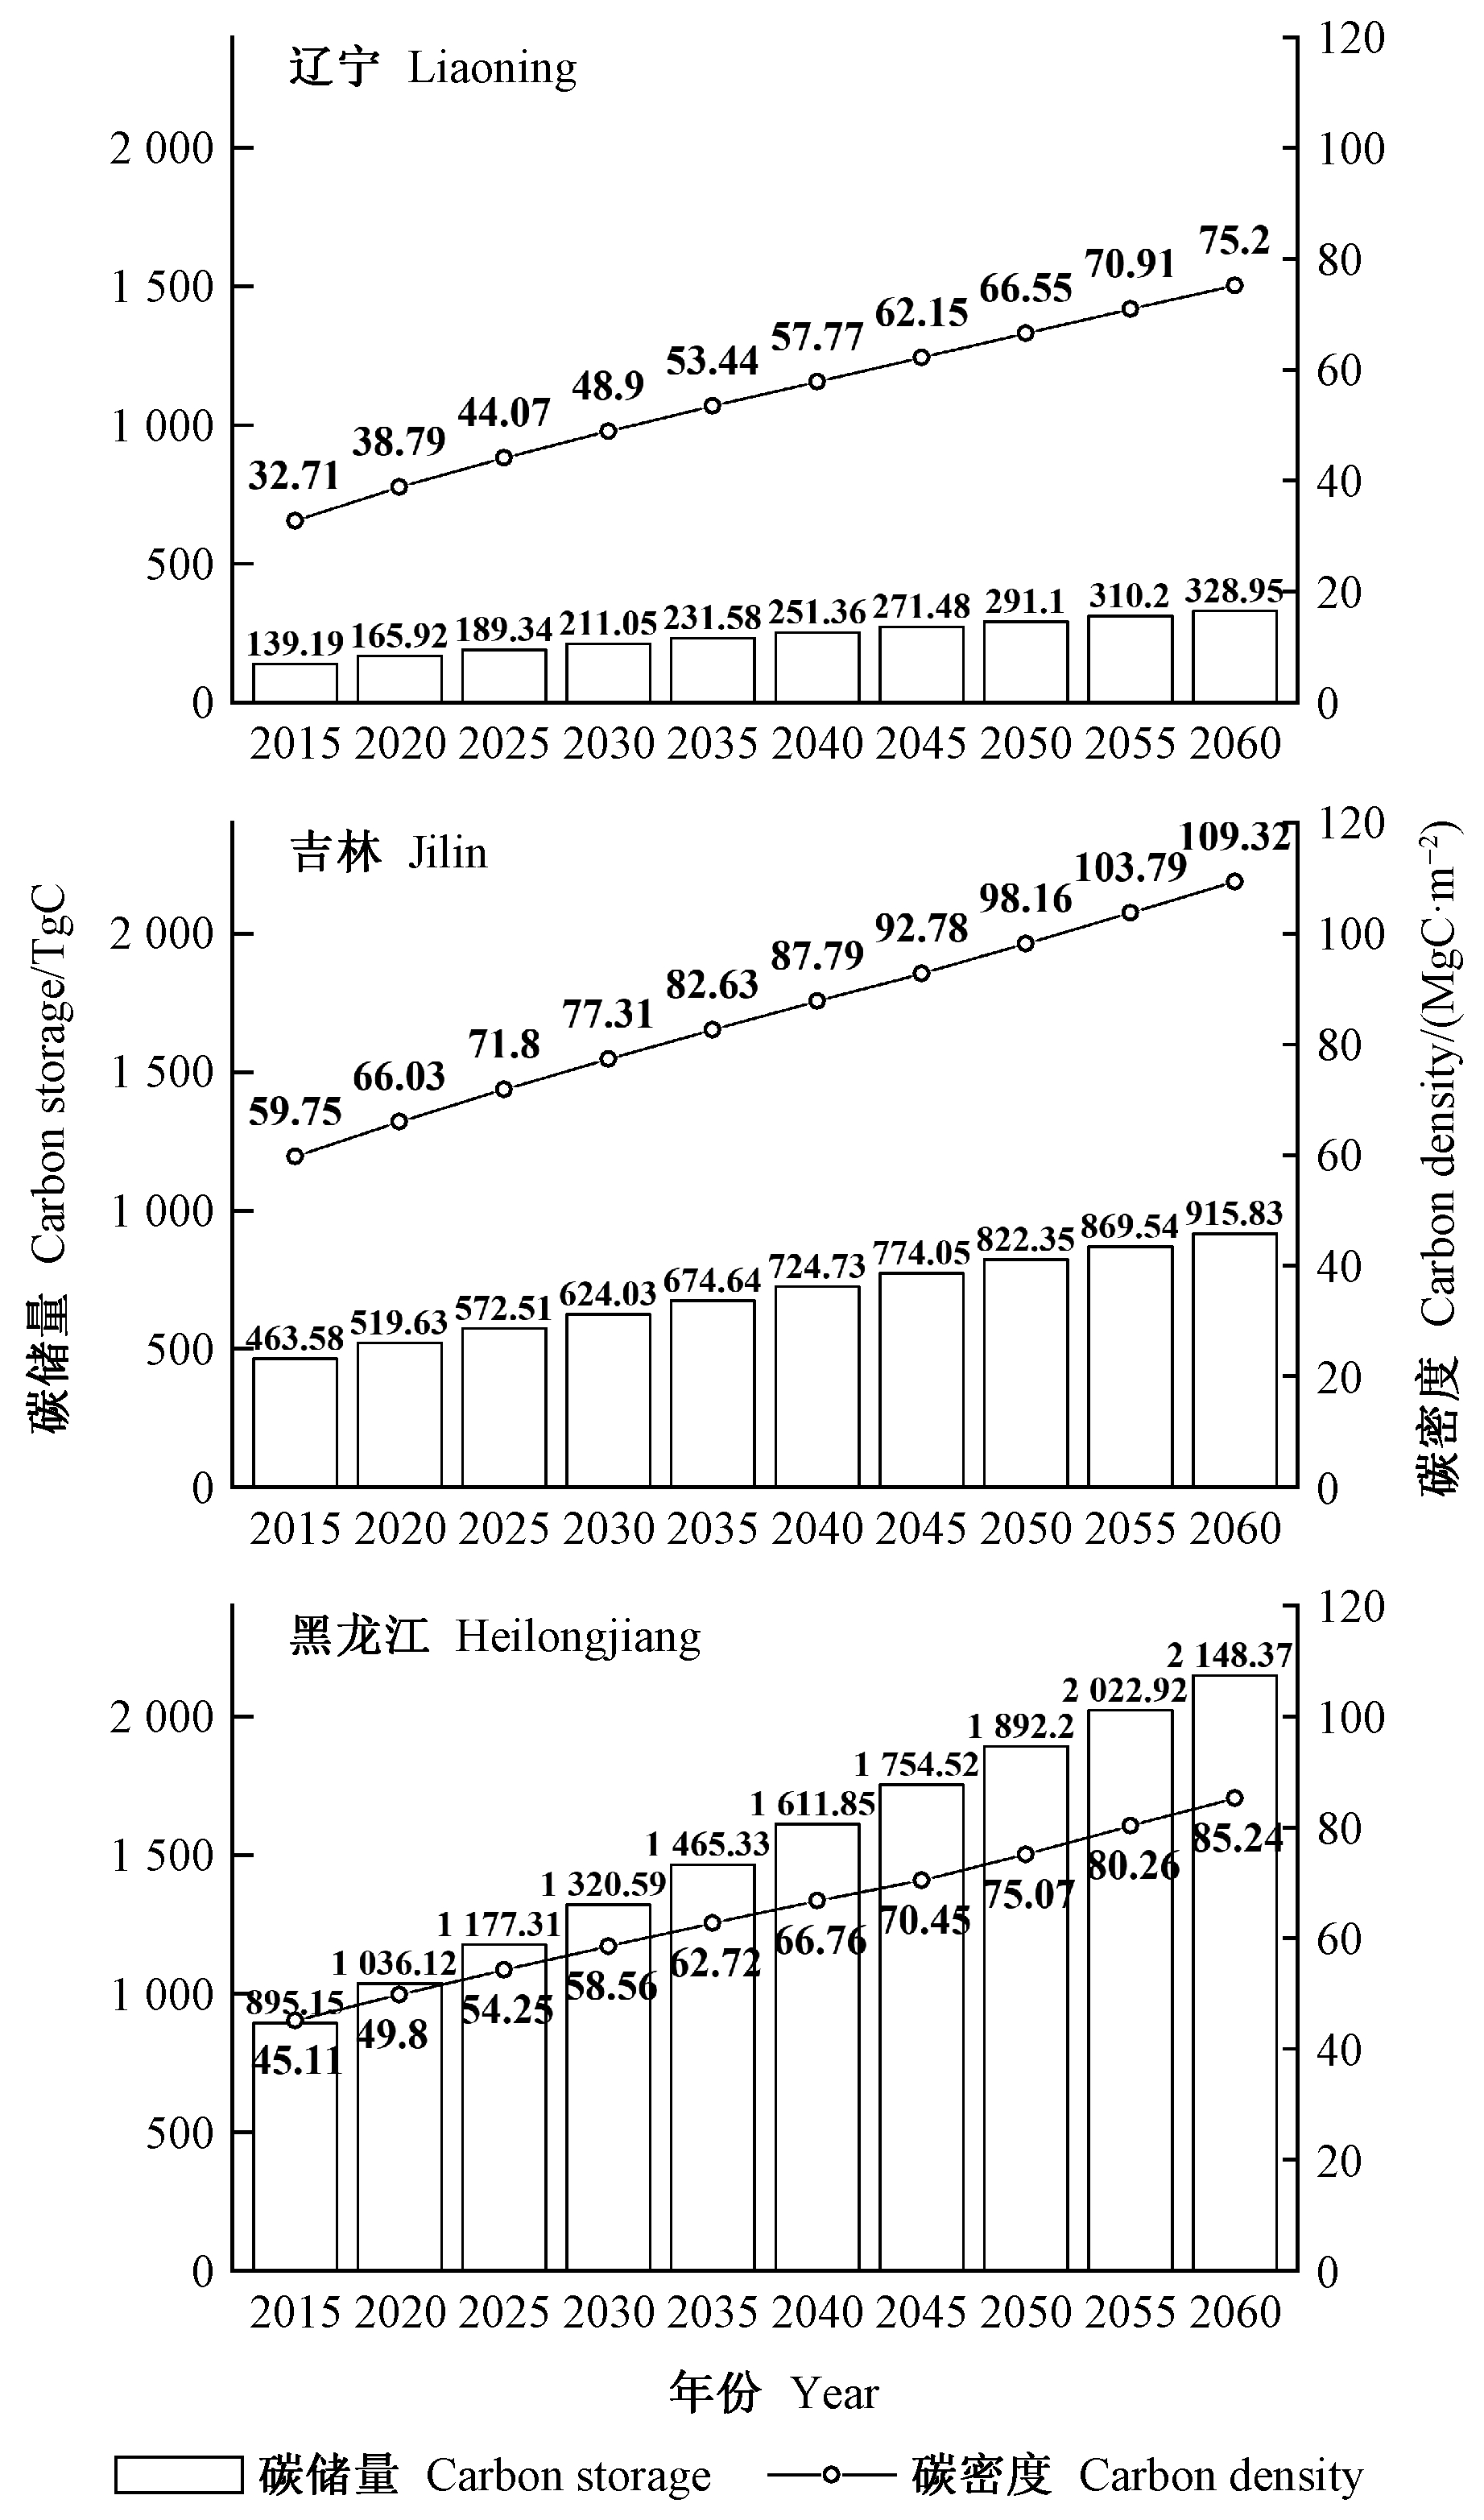
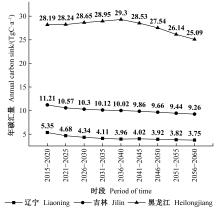
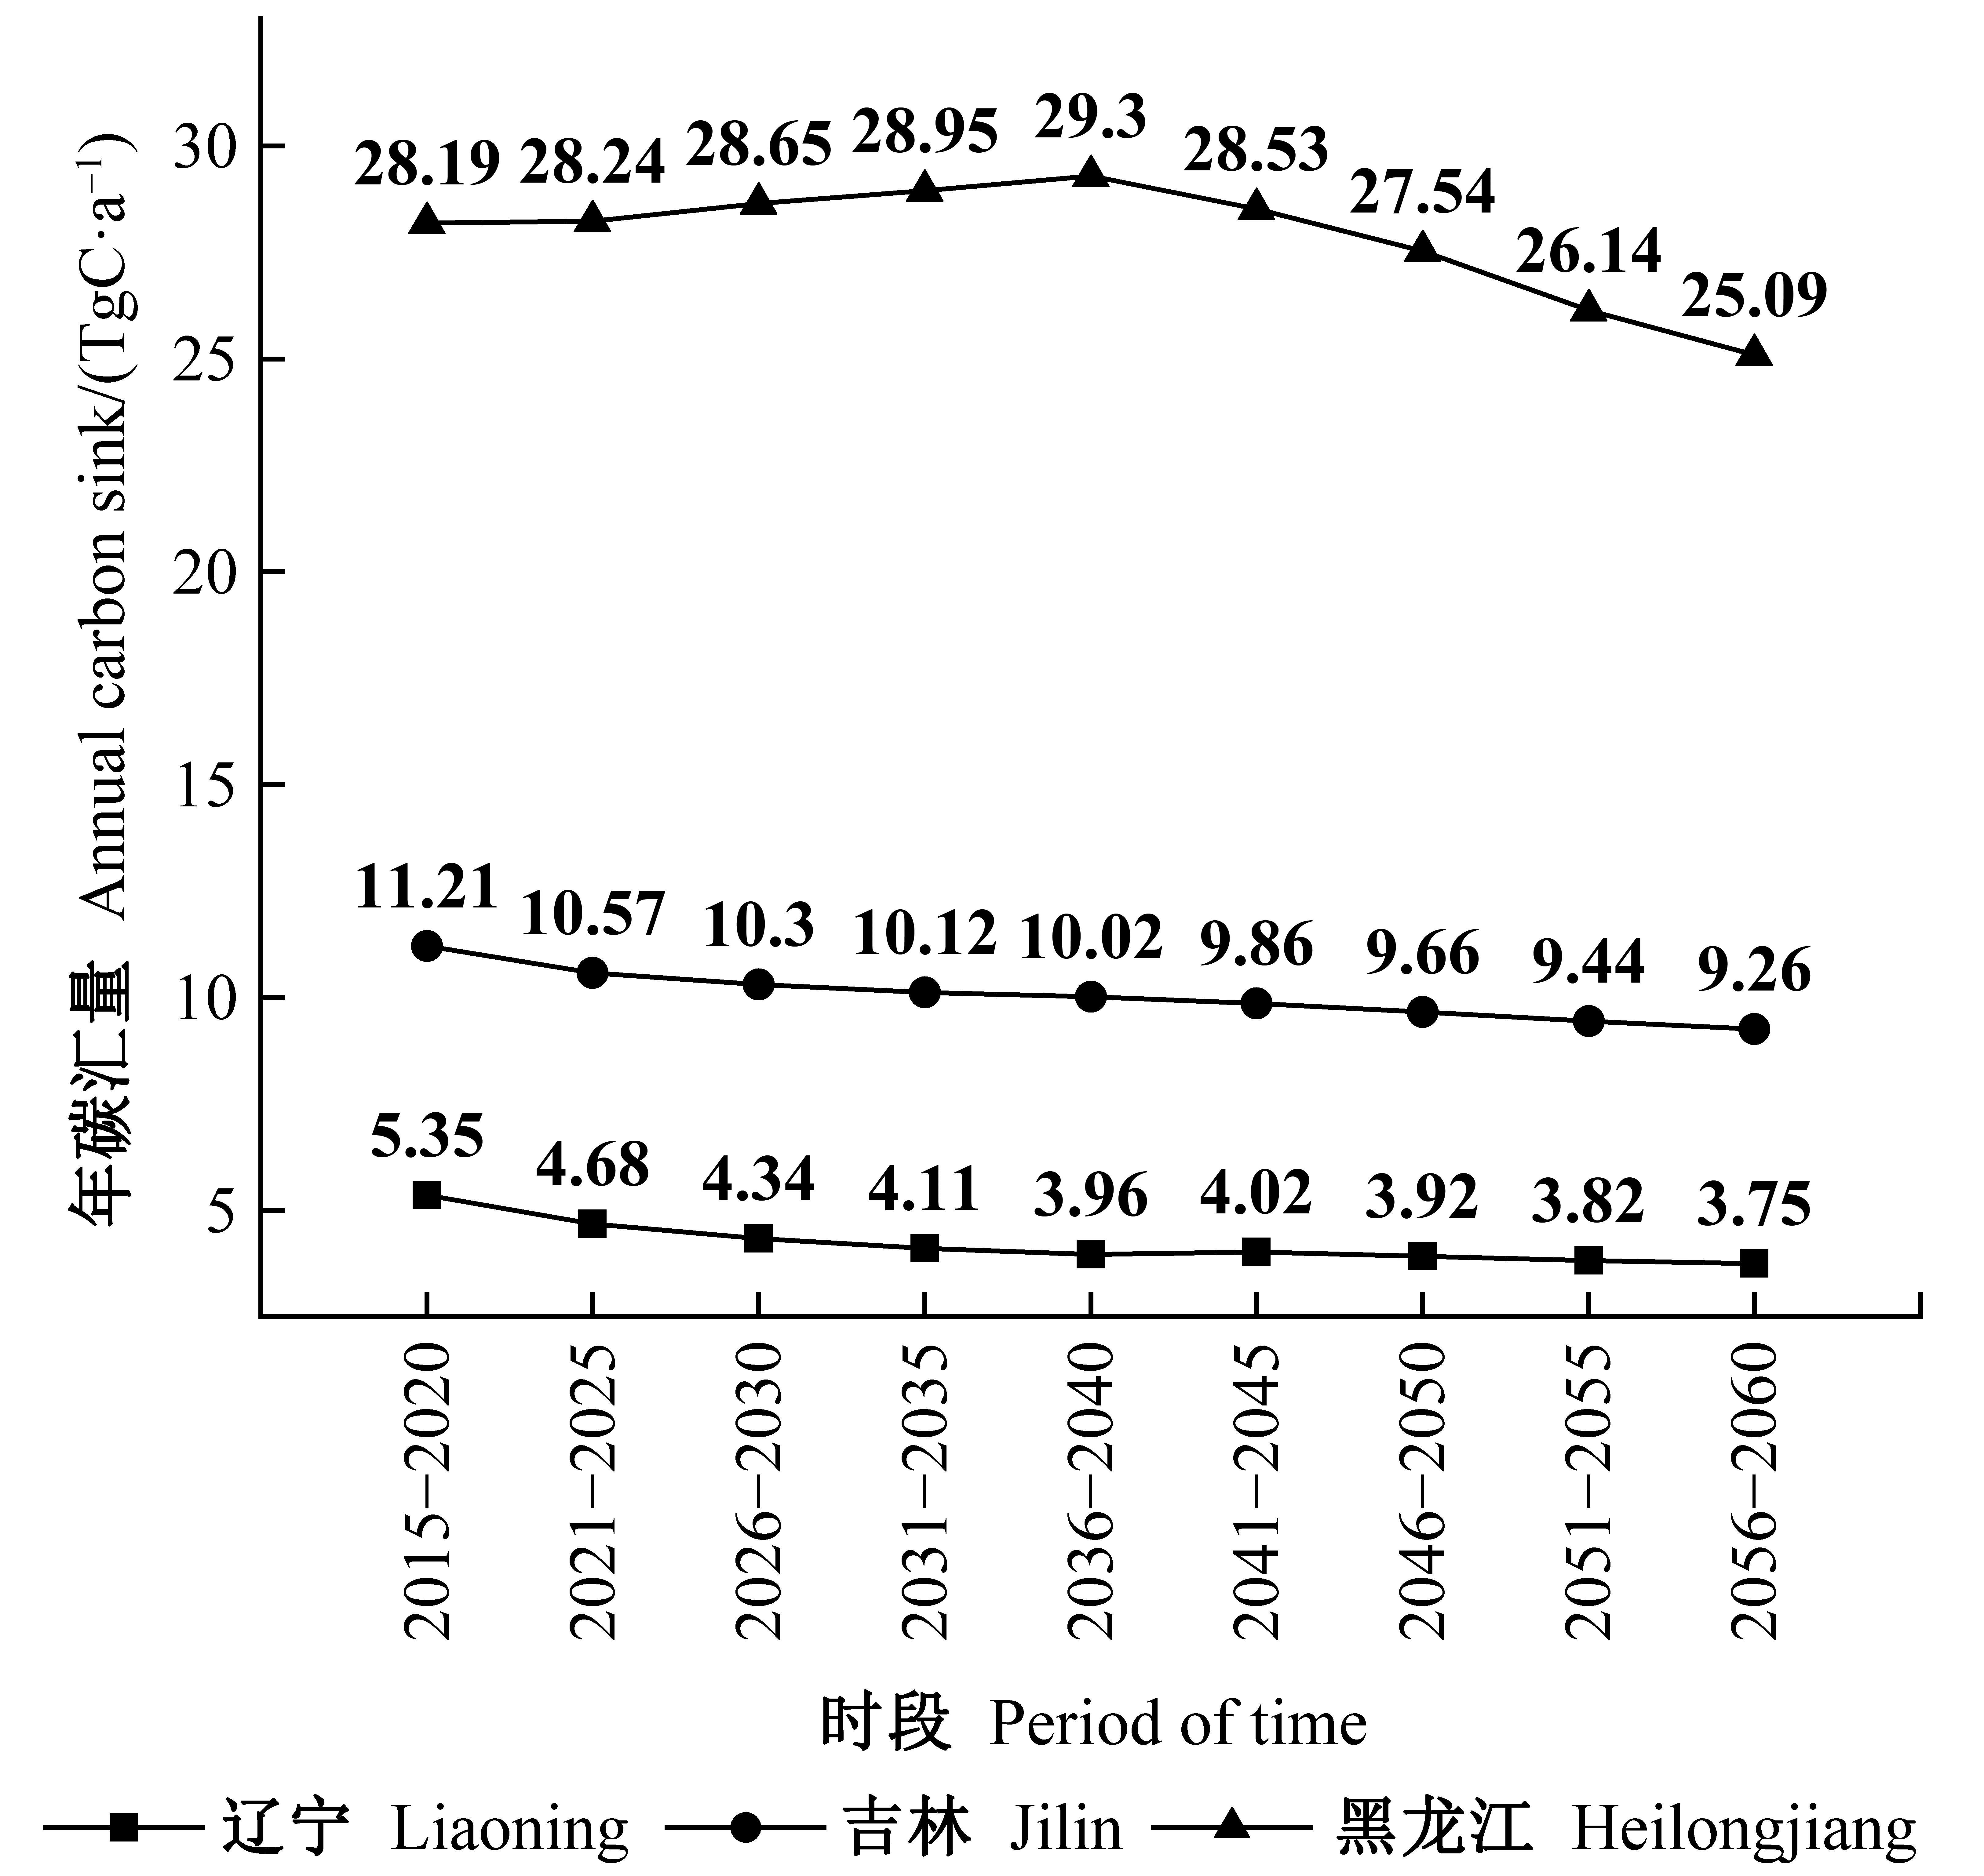
Fig.3
Variations in annual carbon sink of arbor forest from 2015 to 2060 of various provinces in Northeast China"
| 范春楠, 韩士杰, 郭忠玲, 等. 吉林省森林植被固碳现状与速率. 植物生态学报, 2016, 40 (4): 341- 353. | |
| Fan C N , Han S J , Guo Z L , et al. Present status and rate of carbon sequestration of forest vegetation in Jilin Province, Northeast China. Chinese Journal of Plant Ecology, 2016, 40 (4): 341- 353. | |
| 国家林业和草原局. 中国森林资源报告(2014—2018). 北京: 中国林业出版社, 2019. | |
| State Forestry and Grassland Administration of China . Report of forest resources in China (2014—2018). Beijing: China Forestry Publishing House, 2019. | |
|
郭颖婕, 刘晓燕, 郭茂祖, 等. 植物抗性基因识别中的随机森林分类方法. 计算机科学与探索, 2012, 6 (1): 67- 77.
doi: 10.3778/j.issn.1673-9418.2012.01.005 |
|
|
Guo Y J , Liu X Y , Guo M Z , et al. Identification of plant resistance gene with random forest. Journal of Frontiers of Computer Science & Technology, 2012, 6 (1): 67- 77.
doi: 10.3778/j.issn.1673-9418.2012.01.005 |
|
|
焦燕, 胡海清. 黑龙江省森林植被碳储量及其动态变化. 应用生态学报, 2005, 16 (12): 2248- 2252.
doi: 10.3321/j.issn:1001-9332.2005.12.005 |
|
|
Jiao Y , Hu H Q . Carbon storage and its dynamics of forest vegetations in Heilongjiang Province. Chinese Journal of Applied Ecology, 2005, 16 (12): 2248- 2252.
doi: 10.3321/j.issn:1001-9332.2005.12.005 |
|
| 李奇, 朱建华, 冯源, 等. 中国森林乔木林碳储量及其固碳潜力预测. 气候变化研究进展, 2018, 14 (3): 287- 294. | |
| Li Q , Zhu J H , Feng Y , et al. Carbon storage and carbon sequestration potential of the forest in China. Climate Change Research, 2018, 14 (3): 287- 294. | |
|
李婉华, 陈宏, 郭坤, 等. 基于随机森林算法的用电负荷预测研究. 计算机工程与应用, 2016, 52 (23): 236- 243.
doi: 10.3778/j.issn.1002-8331.1606-0203 |
|
|
Li W H , Chen H , Guo K , et al. Research on electrical load prediction based on random forest algorithm. Computer Engineering and Applications, 2016, 52 (23): 236- 243.
doi: 10.3778/j.issn.1002-8331.1606-0203 |
|
| 罗云建, 王效科, 张小全, 等. 中国森林生态系统生物量及其分配研究. 北京: 中国林业出版社, 2013. | |
| Luo Y J , Wang X K , Zhang X Q , et al. Biomass and its allocation of forest ecosystems in China. Beijing: China Forestry Publishing House, 2013. | |
| 马晓哲, 王铮. 中国分省区森林碳汇量的一个估计. 科学通报, 2011, 56 (6): 433- 439. | |
| Ma X Z , Wang Z . An estimation of forest carbon sinks by provinces and regions in China. Chinese Science Bulletin, 2011, 56 (6): 433- 439. | |
| 欧强新, 雷相东, 沈琛琛, 等. 基于随机森林算法的落叶松-云冷杉混交林单木胸径生长预测. 北京林业大学学报, 2019, 41 (9): 9- 19. | |
| Ou Q X , Lei X D , Shen C C , et al. Individual tree DBH growth prediction of larch-spruce-fir mixed forests based on random forest algorithm. Journal of Beijing Forestry University, 2019, 41 (9): 9- 19. | |
| 王春梅, 邵彬, 王汝南. 东北地区两种主要造林树种生态系统固碳潜力. 生态学报, 2010, 30 (7): 1764- 1772. | |
| Wang C M , Shao B , Wang R N . Carbon sequestration potential of ecosystem of two main tree species in Northeast China. Acta Ecologica Sinica, 2010, 30 (7): 1764- 1772. | |
|
郗婷婷, 李顺龙. 黑龙江省森林碳汇潜力分析. 林业经济问题, 2006, 26 (6): 519- 522.519-522, 526
doi: 10.3969/j.issn.1005-9709.2006.06.008 |
|
|
Xi T T , Li S L . Analysis of forestry carbon mitigation potential in Heilongjiang Province. Issues of Forestry Economics, 2006, 26 (6): 519- 522.519-522, 526
doi: 10.3969/j.issn.1005-9709.2006.06.008 |
|
| 许恩银, 王维枫, 聂影, 等. 中国林业碳贡献区域分布及潜力预测. 中国人口·资源与环境, 2020, 30 (5): 36- 45. | |
| Xu E Y , Wang W F , Nie Y , et al. Regional distribution and potential forecast of China's forestry carbon contributions. China Population, Resources and Environment, 2020, 30 (5): 36- 45. | |
| 张煜星, 王雪军. 全国森林蓄积生物量模型建立和碳变化研究. 中国科学(生命科学), 2021, 51 (2): 199- 214. | |
| Zhang Y X , Wang X J . Study on forest volume-to-biomass modeling and carbon storage dynamics in China. Scientia Sinica (Vitae), 2021, 51 (2): 199- 214. | |
| 中共中央国务院. 关于完整准确全面贯彻新发展理念做好碳达峰碳中和工作的意见. 中华人民共和国国务院公报, 2021, (31): 33- 38. | |
| Opinions of the Central Committee of the CPC and the State Council . Carbon dioxide peaking and carbon neutrality in full and faithful implementation of the new development. Philosophy Chinese Full Text, 2021, (31): 33- 38. | |
| 周志华. 机器学习. 北京: 清华大学出版社, 2016. | |
| Zhou Z H . Machine learning. Beijing: Tsinghua University Press, 2016. | |
|
Ashraf M I , Zhao Z Y , Bourque C P A , et al. Integrating biophysical controls in forest growth and yield predictions with artificial intelligence technology. Canadian Journal of Forest Research, 2013, 43 (12): 1162- 1171.
doi: 10.1139/cjfr-2013-0090 |
|
|
De'ath G . Boosted trees for ecological modeling and prediction. Ecology, 2007, 88 (1): 243- 251.
doi: 10.1890/0012-9658(2007)88[243:BTFEMA]2.0.CO;2 |
|
|
Doelman J C , Stehfest E , van Vuuren D P , et al. Afforestation for climate change mitigation: potentials, risks and trade-offs. Global Change Biology, 2020, 26 (3): 1576- 1591.
doi: 10.1111/gcb.14887 |
|
|
Fang J , Chen A , Peng C , et al. Changes in forest biomass carbon storage in China between 1949 and 1998. Science, 2001, 292 (5525): 2320- 2322.
doi: 10.1126/science.1058629 |
|
|
Fang J Y , Guo Z D , Hu H F , et al. Forest biomass carbon sinks in East Asia, with special reference to the relative contributions of forest expansion and forest growth. Global Change Biology, 2014, 20 (6): 2019- 2030.
doi: 10.1111/gcb.12512 |
|
|
Fernández-Martínez M , Vicca S , Janssens I A , et al. Addendum: nutrient availability as the key regulator of global forest carbon balance. Nature Climate Change, 2014, 4 (7): 643.
doi: 10.1038/nclimate2282 |
|
|
Gong P , Liu H , Zhang M N , et al. Stable classification with limited sample: transferring a 30-m resolution sample set collected in 2015 to mapping 10-m resolution global land cover in 2017. Science Bulletin, 2019, 64 (6): 370- 373.
doi: 10.1016/j.scib.2019.03.002 |
|
|
Hu H F , Wang S P , Guo Z D , et al. The stage-classified matrix models project a significant increase in biomass carbon stocks in China's forests between 2005 and 2050. Scientific Reports, 2015, 5, 11203.
doi: 10.1038/srep11203 |
|
|
Jevšenak J , Skudnik M . A random forest model for basal area increment predictions from national forest inventory data. Forest Ecology and Management, 2021, 479, 118601.
doi: 10.1016/j.foreco.2020.118601 |
|
| Kuhn M , Johnson K . Applied predictive modeling. New York: Springer, 2013. | |
|
Lin B Q , Ge J M . Valued forest carbon sinks: how much emissions abatement costs could be reduced in China. Journal of Cleaner Production, 2019, 224, 455- 464.
doi: 10.1016/j.jclepro.2019.03.221 |
|
|
Lun F , Liu Y , He L , et al. Life cycle research on the carbon budget of the Larix principis-rupprechtii plantation forest ecosystem in North China. Journal of Cleaner Production, 2018, 177, 178- 186.
doi: 10.1016/j.jclepro.2017.12.126 |
|
|
Mina M , Huber M O , Forrester D I , et al. Multiple factors modulate tree growth complementarity in Central European mixed forests. Journal of Ecology, 2018, 106 (3): 1106- 1119.
doi: 10.1111/1365-2745.12846 |
|
| Ni J . Carbon storage in Chinese terrestrial ecosystems: approaching a more accurate estimate. Climatic Change, 2013, 119 (3/4): 905- 917. | |
|
Ou Q X , Lei X D , Shen C C . Individual tree diameter growth models of larch-spruce-fir mixed forests based on machine learning algorithms. Forests, 2019, 10 (2): 187.
doi: 10.3390/f10020187 |
|
|
Prasad A M , Iverson L R , Liaw A . Newer classification and regression tree techniques: bagging and random forests for ecological prediction. Ecosystems, 2006, 9 (2): 181- 199.
doi: 10.1007/s10021-005-0054-1 |
|
|
Qi G , Chen H , Zhou L , et al. Carbon stock of larch plantations and its comparison with an old-growth forest in northeast China. Chinese Geographical Science, 2016, 26 (1): 10- 21.
doi: 10.1007/s11769-015-0772-z |
|
|
Qiu Z X , Feng Z K , Song Y N , et al. Carbon sequestration potential of forest vegetation in China from 2003 to 2050: predicting forest vegetation growth based on climate and the environment. Journal of Cleaner Production, 2020, 252, 119715.
doi: 10.1016/j.jclepro.2019.119715 |
|
|
Richards K R , Stokes C . A review of forest carbon sequestration cost studies: a dozen years of research. Climatic Change, 2004, 63 (1/2): 1- 48.
doi: 10.1023/B:CLIM.0000018503.10080.89 |
|
|
Sharma T , Kurz W A , Stinson G , et al. A 100-year conservation experiment: impacts on forest carbon stocks and fluxes. Forest Ecology and Management, 2013, 310, 242- 255.
doi: 10.1016/j.foreco.2013.06.048 |
|
|
Stinson G , Kurz W A , Smyth C E , et al. An inventory-based analysis of Canada's managed forest carbon dynamics, 1990 to 2008. Global Change Biology, 2011, 17 (6): 2227- 2244.
doi: 10.1111/j.1365-2486.2010.02369.x |
|
|
Tang X L , Zhao X , Bai Y F , et al. Carbon pools in China's terrestrial ecosystems: new estimates based on an intensive field survey. Proceedings of the National Academy of Sciences of the United States of America, 2018, 115 (16): 4021- 4026.
doi: 10.1073/pnas.1700291115 |
|
|
Wei S G , Dai Y J , Liu B Y , et al. A China data set of soil properties for land surface modeling. Journal of Advances in Modeling Earth Systems, 2013, 5 (2): 212- 224.
doi: 10.1002/jame.20026 |
| [1] | Zhongqiu Sun,Jinping Gao,Fayun Wu,Xianlian Gao,Yang Hu,Jianxin Gao. Estimating Forest Stock Volume via Small-Footprint LiDAR Point Cloud Data and Random Forest Algorithm [J]. Scientia Silvae Sinicae, 2021, 57(8): 68-81. |
| [2] | Qiu Shuai, Shen Baichun, Li Tingting, Guo Juan, Wang Ji, Sun Lina, Chen Xuping, Hu Shaoqing. A Method of Osmanthus fragrans Cultivars Identification Based on Random Forest Algorithm and SRAP Molecular Markers [J]. Scientia Silvae Sinicae, 2018, 54(1): 32-45. |
| [3] | Liang Huiling, Lin Yurui, Yang Guang, Su Zhangwen, Wang Wenhui, Guo Futao. Application of Random Forest Algorithm on the Forest Fire Prediction in Tahe Area Based on Meteorological Factors [J]. Scientia Silvae Sinicae, 2016, 52(1): 89-98. |
| [4] | Liu Enbin, Shi Yongjun, Li Yongfu, Zhou Guomo, Yang Dong. Non Spatial Structural Characteristic of Moso Bamboo Forest and Its Dynamics in Zhejiang Province [J]. Scientia Silvae Sinicae, 2013, 49(9): 1-7. |
| [5] | hi Gangrong;Xing Haitao. Eco-Anatomical Characteristics of Eight Tree Species in Xiangshan Mountain, Huaibei [J]. Scientia Silvae Sinicae, 2007, 43(3): 28-33. |
| [6] | Feng Zhiqiang. THE MARKING METHOD OF EQUAL PROBABILITY FOR EQUAL MARK AND ITS APPLICATION TO THE SELECTION OF AMELIORATED WALNUT VARIETIES [J]. , 1989, 25(4): 382-388. |
| Viewed | ||||||
|
Full text |
|
|||||
|
Abstract |
|
|||||